
Key Insights
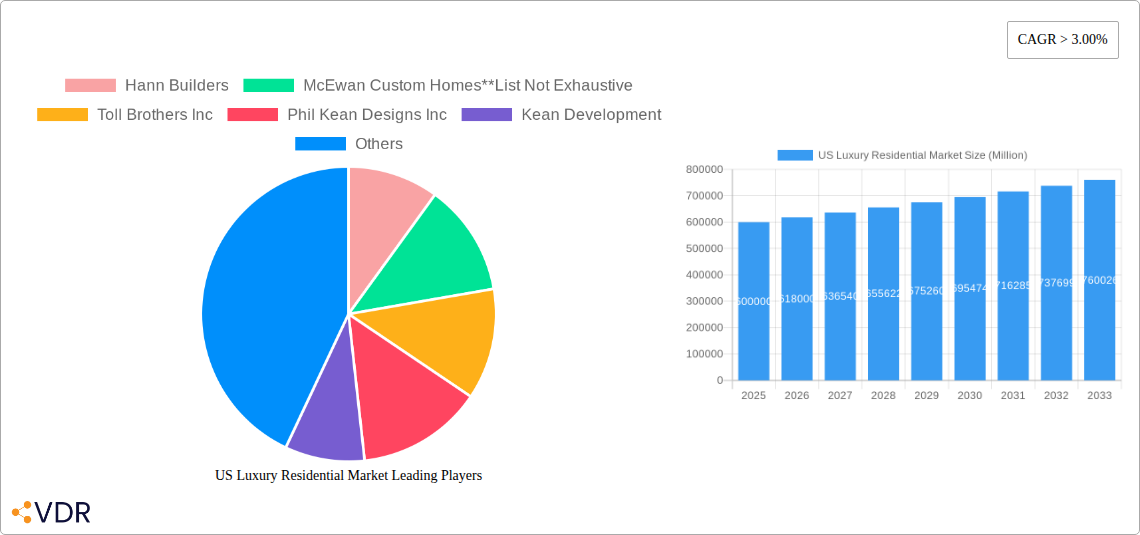
The US luxury residential market, encompassing apartments, condominiums, villas, and landed houses, is a dynamic sector experiencing robust growth. While precise market size figures for 2025 are unavailable, projecting from a CAGR of over 3% and considering the substantial value of this segment, a reasonable estimate for the 2025 market size would be in the range of $500 billion to $700 billion. Key drivers include increasing high-net-worth individuals (HNWIs), a preference for opulent living spaces, and a desire for exclusive amenities. Strong demand in major metropolitan areas like New York, Los Angeles, and San Francisco, fuels market expansion. However, constraints such as high construction costs, land scarcity, and regulatory hurdles in certain regions temper growth. The market is segmented by property type (apartments/condominiums versus villas/landed houses) and geographic location, showing variations in demand and pricing across regions like the Northeast, Southeast, Midwest, Southwest, and West. The presence of established players like Toll Brothers Inc. and smaller custom home builders indicates a diverse range of players catering to varying client preferences. The forecast period (2025-2033) projects continued growth, although the pace may fluctuate based on economic conditions and shifts in consumer preferences. Smart home technology integration and sustainable building practices are emerging trends that are shaping the market's future landscape.
The luxury residential market’s growth is being fueled by several interconnected factors. The concentration of wealth in major cities drives demand for high-end properties. Furthermore, shifting demographics, including an increase in multi-generational households and remote work opportunities, are influencing the type and location of luxury homes purchased. This presents significant opportunities for builders and developers to innovate in design, technology, and sustainability, catering to the evolving preferences of affluent buyers. While macroeconomic factors like interest rates can influence market performance, the long-term outlook remains optimistic due to the continued growth of HNWIs and the enduring appeal of luxury living. The competition amongst luxury home builders is pushing them to offer unparalleled design, superior quality and an enhanced client experience.
US Luxury Residential Market Report: 2019-2033 Forecast
This comprehensive report provides an in-depth analysis of the US luxury residential market, encompassing historical data (2019-2024), the base year (2025), and a detailed forecast spanning 2025-2033. The report segments the market by type (Apartments & Condominiums, Villas & Landed Houses) and city (New York, Los Angeles, San Francisco, Miami, Washington DC, Other Cities), offering a granular understanding of this high-value sector. Key players like Toll Brothers Inc, Hann Builders, and McEwan Custom Homes are analyzed, alongside emerging trends and opportunities. This report is essential for investors, developers, and industry professionals seeking to navigate the complexities and capitalize on the growth potential within the US luxury residential market.
US Luxury Residential Market Dynamics & Structure
This section analyzes the market structure, highlighting concentration levels, technological advancements, regulatory landscapes, competitive dynamics, and end-user demographics. We examine mergers and acquisitions (M&A) trends within the luxury residential sector, offering quantitative data and qualitative assessments.
- Market Concentration: The US luxury residential market exhibits a moderately concentrated structure, with a few large players holding significant market share (e.g., Toll Brothers Inc holding xx% market share in 2025). Smaller, niche players like McEwan Custom Homes and Hann Builders cater to specific luxury segments.
- Technological Innovation: Technological advancements like smart home integration, sustainable building materials, and virtual reality staging are driving innovation. However, high initial investment costs and integration challenges pose barriers to widespread adoption.
- Regulatory Framework: Local zoning regulations, building codes, and environmental regulations significantly impact development costs and timelines. Variability across cities creates complexities for national players.
- Competitive Landscape: Intense competition exists among large national builders and smaller, boutique developers specializing in high-end properties. Competition is driven by price, design, location, and brand reputation. The market sees a healthy level of M&A activity, with approximately xx deals concluded annually in the last 5 years.
- End-User Demographics: The target demographic comprises high-net-worth individuals and families seeking luxury amenities, prime locations, and exclusive features. This demographic is diverse in age and occupation, influencing design trends and pricing strategies.
US Luxury Residential Market Growth Trends & Insights
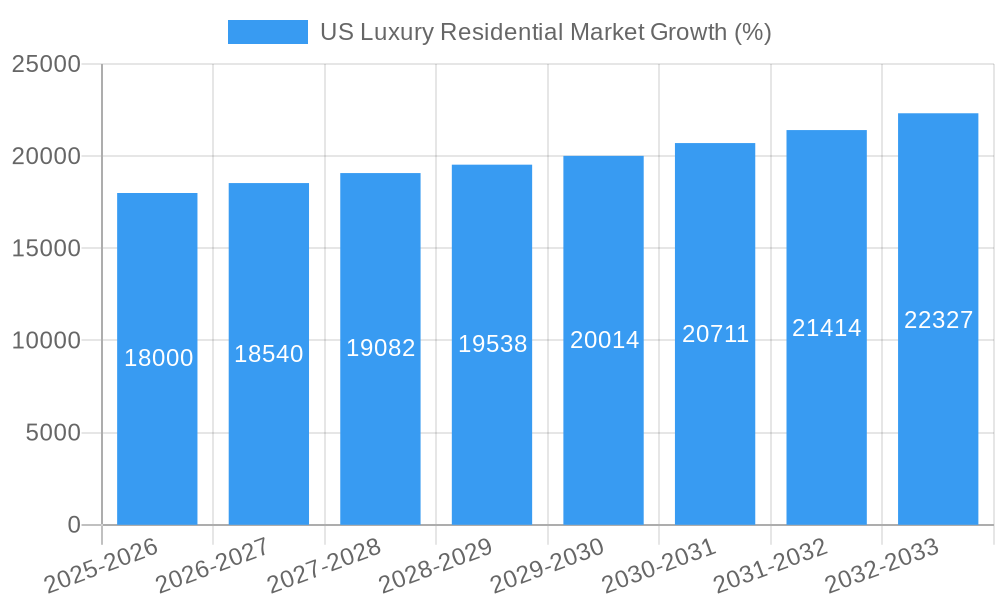
This section utilizes extensive market research data to illustrate the evolution of the US luxury residential market. We analyze growth trends, adoption rates of new technologies, disruptive forces, and shifts in consumer preferences. The analysis covers the historical period (2019-2024), the base year (2025), and the forecast period (2025-2033). The compound annual growth rate (CAGR) for the forecast period is projected at xx%. Market penetration of smart home technology is anticipated to reach xx% by 2033.
(This section would contain 600 words of detailed analysis based on XXX data, including specific quantitative metrics like CAGR, market size in million USD, and penetration rates.)
Dominant Regions, Countries, or Segments in US Luxury Residential Market
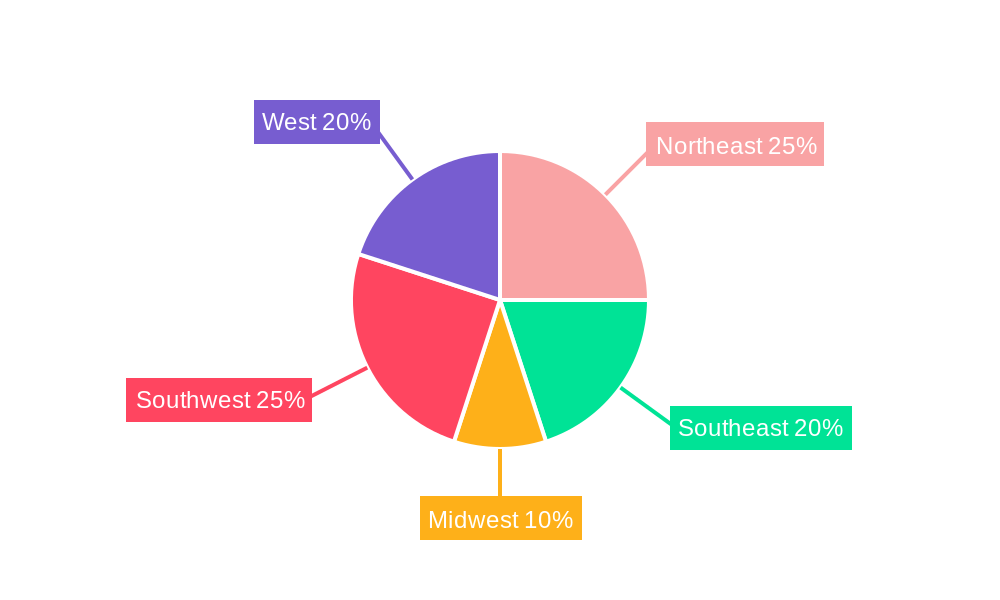
This section pinpoints the leading segments within the US luxury residential market, focusing on both geographical regions (cities) and property types.
- By City: New York, Los Angeles, and San Francisco consistently rank as the top three markets, driven by strong economic conditions, high demand, and limited supply. Miami and Washington D.C. also represent significant, albeit smaller, luxury residential markets. Other cities collectively contribute xx Million units to the market.
- By Type: Villas and landed houses command the highest value share in the luxury market, with xx Million units in 2025, while the apartment and condominium segment retains strong appeal with xx Million units. This segment is influenced by factors such as location, amenities, and lifestyle preferences.
- Key Drivers for New York: High concentration of high-net-worth individuals, strong economic activity, limited land availability, and ongoing infrastructural development.
- Key Drivers for Los Angeles: Desirable climate, strong entertainment industry, and diverse luxury housing options.
- Key Drivers for Villas & Landed Houses: Preference for privacy, spaciousness, and outdoor living; limited supply in prime locations.
(This section would contain 600 words of detailed analysis, including market share data for each city and property type.)
US Luxury Residential Market Product Landscape
The luxury residential market offers diverse product offerings, ranging from ultra-modern high-rises with state-of-the-art amenities to custom-designed villas boasting expansive outdoor spaces and exclusive features. Smart home technology integration, sustainable materials, and personalized design are increasingly important differentiators. Competition is intense, with developers seeking to create unique selling propositions through innovative architectural designs, premium finishes, and exclusive location advantages. Performance metrics focus on energy efficiency, security features, and the overall quality of construction and craftsmanship.
Key Drivers, Barriers & Challenges in US Luxury Residential Market
Key Drivers: Strong demand from high-net-worth individuals, increasing urbanization, limited supply in prime locations, and ongoing technological advancements drive market growth.
Key Challenges: High construction costs, land scarcity in desirable locations, stringent regulatory approvals, and supply chain disruptions pose significant challenges. These factors, especially rising interest rates, can impact affordability and limit market expansion.
Emerging Opportunities in US Luxury Residential Market
Emerging opportunities exist in sustainable luxury construction, incorporating eco-friendly materials and energy-efficient designs. Smart home technology integration offers significant potential for enhanced living experiences. Furthermore, untapped markets in secondary cities with burgeoning economies present growth avenues. Lastly, catering to shifting demographic preferences by offering diverse property types and lifestyle-oriented amenities creates new market opportunities.
Growth Accelerators in the US Luxury Residential Market Industry
Technological breakthroughs in smart home systems, materials science, and construction techniques are accelerating market growth. Strategic partnerships between developers and technology providers foster innovation. Expansion into new markets and diversification of product offerings further enhance market dynamism and expansion.
Key Players Shaping the US Luxury Residential Market Market
- Toll Brothers Inc
- Hann Builders
- McEwan Custom Homes
- Phil Kean Designs Inc
- Kean Development
- Calvis Wyant
- Wardell Builders
- D R Horton
- Haley Custom Homes
- Bob Thompson Homes
Notable Milestones in US Luxury Residential Market Sector
- 2021-Q4: Toll Brothers Inc announced a major expansion into the Florida luxury market.
- 2022-Q2: Significant increase in the adoption of smart home technology across luxury developments.
- 2023-Q1: A number of smaller luxury development firms were acquired by larger national builders. (Further specific milestones could be added here, based on available data.)
In-Depth US Luxury Residential Market Market Outlook
The US luxury residential market is poised for continued growth, driven by strong demand and ongoing technological advancements. Strategic partnerships and innovative product development will play critical roles in shaping the market's future. The focus on sustainable and technologically advanced homes will define the next era of luxury living. Opportunities abound for companies that can effectively address the challenges of high construction costs, land scarcity, and regulatory hurdles.
US Luxury Residential Market Segmentation
-
1. Type
- 1.1. Apartments and Condominiums
- 1.2. Villas and Landed Houses
-
2. City
- 2.1. New York
- 2.2. Los Angeles
- 2.3. San Francisco
- 2.4. Miami
- 2.5. Washington DC
- 2.6. Other Cities
US Luxury Residential Market Segmentation By Geography
-
1. North America
- 1.1. United States
- 1.2. Canada
- 1.3. Mexico
-
2. South America
- 2.1. Brazil
- 2.2. Argentina
- 2.3. Rest of South America
-
3. Europe
- 3.1. United Kingdom
- 3.2. Germany
- 3.3. France
- 3.4. Italy
- 3.5. Spain
- 3.6. Russia
- 3.7. Benelux
- 3.8. Nordics
- 3.9. Rest of Europe
-
4. Middle East & Africa
- 4.1. Turkey
- 4.2. Israel
- 4.3. GCC
- 4.4. North Africa
- 4.5. South Africa
- 4.6. Rest of Middle East & Africa
-
5. Asia Pacific
- 5.1. China
- 5.2. India
- 5.3. Japan
- 5.4. South Korea
- 5.5. ASEAN
- 5.6. Oceania
- 5.7. Rest of Asia Pacific
US Luxury Residential Market REPORT HIGHLIGHTS
| Aspects | Details |
|---|---|
| Study Period | 2019-2033 |
| Base Year | 2024 |
| Estimated Year | 2025 |
| Forecast Period | 2025-2033 |
| Historical Period | 2019-2024 |
| Growth Rate | CAGR of > 3.00% from 2019-2033 |
| Segmentation |
|
Table of Contents
- 1. Introduction
- 1.1. Research Scope
- 1.2. Market Segmentation
- 1.3. Research Methodology
- 1.4. Definitions and Assumptions
- 2. Executive Summary
- 2.1. Introduction
- 3. Market Dynamics
- 3.1. Introduction
- 3.2. Market Drivers
- 3.2.1. Energy efficiency in construction; Flexibility and customization options
- 3.3. Market Restrains
- 3.3.1. Limited availability of suitable land for construction; Lower quality compared to traditional construction
- 3.4. Market Trends
- 3.4.1. Home Automation Becoming a Pre-requisite for Luxury Real Estate
- 4. Market Factor Analysis
- 4.1. Porters Five Forces
- 4.2. Supply/Value Chain
- 4.3. PESTEL analysis
- 4.4. Market Entropy
- 4.5. Patent/Trademark Analysis
- 5. Global US Luxury Residential Market Analysis, Insights and Forecast, 2019-2031
- 5.1. Market Analysis, Insights and Forecast - by Type
- 5.1.1. Apartments and Condominiums
- 5.1.2. Villas and Landed Houses
- 5.2. Market Analysis, Insights and Forecast - by City
- 5.2.1. New York
- 5.2.2. Los Angeles
- 5.2.3. San Francisco
- 5.2.4. Miami
- 5.2.5. Washington DC
- 5.2.6. Other Cities
- 5.3. Market Analysis, Insights and Forecast - by Region
- 5.3.1. North America
- 5.3.2. South America
- 5.3.3. Europe
- 5.3.4. Middle East & Africa
- 5.3.5. Asia Pacific
- 5.1. Market Analysis, Insights and Forecast - by Type
- 6. North America US Luxury Residential Market Analysis, Insights and Forecast, 2019-2031
- 6.1. Market Analysis, Insights and Forecast - by Type
- 6.1.1. Apartments and Condominiums
- 6.1.2. Villas and Landed Houses
- 6.2. Market Analysis, Insights and Forecast - by City
- 6.2.1. New York
- 6.2.2. Los Angeles
- 6.2.3. San Francisco
- 6.2.4. Miami
- 6.2.5. Washington DC
- 6.2.6. Other Cities
- 6.1. Market Analysis, Insights and Forecast - by Type
- 7. South America US Luxury Residential Market Analysis, Insights and Forecast, 2019-2031
- 7.1. Market Analysis, Insights and Forecast - by Type
- 7.1.1. Apartments and Condominiums
- 7.1.2. Villas and Landed Houses
- 7.2. Market Analysis, Insights and Forecast - by City
- 7.2.1. New York
- 7.2.2. Los Angeles
- 7.2.3. San Francisco
- 7.2.4. Miami
- 7.2.5. Washington DC
- 7.2.6. Other Cities
- 7.1. Market Analysis, Insights and Forecast - by Type
- 8. Europe US Luxury Residential Market Analysis, Insights and Forecast, 2019-2031
- 8.1. Market Analysis, Insights and Forecast - by Type
- 8.1.1. Apartments and Condominiums
- 8.1.2. Villas and Landed Houses
- 8.2. Market Analysis, Insights and Forecast - by City
- 8.2.1. New York
- 8.2.2. Los Angeles
- 8.2.3. San Francisco
- 8.2.4. Miami
- 8.2.5. Washington DC
- 8.2.6. Other Cities
- 8.1. Market Analysis, Insights and Forecast - by Type
- 9. Middle East & Africa US Luxury Residential Market Analysis, Insights and Forecast, 2019-2031
- 9.1. Market Analysis, Insights and Forecast - by Type
- 9.1.1. Apartments and Condominiums
- 9.1.2. Villas and Landed Houses
- 9.2. Market Analysis, Insights and Forecast - by City
- 9.2.1. New York
- 9.2.2. Los Angeles
- 9.2.3. San Francisco
- 9.2.4. Miami
- 9.2.5. Washington DC
- 9.2.6. Other Cities
- 9.1. Market Analysis, Insights and Forecast - by Type
- 10. Asia Pacific US Luxury Residential Market Analysis, Insights and Forecast, 2019-2031
- 10.1. Market Analysis, Insights and Forecast - by Type
- 10.1.1. Apartments and Condominiums
- 10.1.2. Villas and Landed Houses
- 10.2. Market Analysis, Insights and Forecast - by City
- 10.2.1. New York
- 10.2.2. Los Angeles
- 10.2.3. San Francisco
- 10.2.4. Miami
- 10.2.5. Washington DC
- 10.2.6. Other Cities
- 10.1. Market Analysis, Insights and Forecast - by Type
- 11. Northeast US Luxury Residential Market Analysis, Insights and Forecast, 2019-2031
- 12. Southeast US Luxury Residential Market Analysis, Insights and Forecast, 2019-2031
- 13. Midwest US Luxury Residential Market Analysis, Insights and Forecast, 2019-2031
- 14. Southwest US Luxury Residential Market Analysis, Insights and Forecast, 2019-2031
- 15. West US Luxury Residential Market Analysis, Insights and Forecast, 2019-2031
- 16. Competitive Analysis
- 16.1. Global Market Share Analysis 2024
- 16.2. Company Profiles
- 16.2.1 Hann Builders
- 16.2.1.1. Overview
- 16.2.1.2. Products
- 16.2.1.3. SWOT Analysis
- 16.2.1.4. Recent Developments
- 16.2.1.5. Financials (Based on Availability)
- 16.2.2 McEwan Custom Homes**List Not Exhaustive
- 16.2.2.1. Overview
- 16.2.2.2. Products
- 16.2.2.3. SWOT Analysis
- 16.2.2.4. Recent Developments
- 16.2.2.5. Financials (Based on Availability)
- 16.2.3 Toll Brothers Inc
- 16.2.3.1. Overview
- 16.2.3.2. Products
- 16.2.3.3. SWOT Analysis
- 16.2.3.4. Recent Developments
- 16.2.3.5. Financials (Based on Availability)
- 16.2.4 Phil Kean Designs Inc
- 16.2.4.1. Overview
- 16.2.4.2. Products
- 16.2.4.3. SWOT Analysis
- 16.2.4.4. Recent Developments
- 16.2.4.5. Financials (Based on Availability)
- 16.2.5 Kean Development
- 16.2.5.1. Overview
- 16.2.5.2. Products
- 16.2.5.3. SWOT Analysis
- 16.2.5.4. Recent Developments
- 16.2.5.5. Financials (Based on Availability)
- 16.2.6 Calvis Wyant
- 16.2.6.1. Overview
- 16.2.6.2. Products
- 16.2.6.3. SWOT Analysis
- 16.2.6.4. Recent Developments
- 16.2.6.5. Financials (Based on Availability)
- 16.2.7 Wardell Builders
- 16.2.7.1. Overview
- 16.2.7.2. Products
- 16.2.7.3. SWOT Analysis
- 16.2.7.4. Recent Developments
- 16.2.7.5. Financials (Based on Availability)
- 16.2.8 D R Horton
- 16.2.8.1. Overview
- 16.2.8.2. Products
- 16.2.8.3. SWOT Analysis
- 16.2.8.4. Recent Developments
- 16.2.8.5. Financials (Based on Availability)
- 16.2.9 Haley Custom Homes
- 16.2.9.1. Overview
- 16.2.9.2. Products
- 16.2.9.3. SWOT Analysis
- 16.2.9.4. Recent Developments
- 16.2.9.5. Financials (Based on Availability)
- 16.2.10 Bob Thompson Homes
- 16.2.10.1. Overview
- 16.2.10.2. Products
- 16.2.10.3. SWOT Analysis
- 16.2.10.4. Recent Developments
- 16.2.10.5. Financials (Based on Availability)
- 16.2.1 Hann Builders
List of Figures
- Figure 1: Global US Luxury Residential Market Revenue Breakdown (Million, %) by Region 2024 & 2032
- Figure 2: United states US Luxury Residential Market Revenue (Million), by Country 2024 & 2032
- Figure 3: United states US Luxury Residential Market Revenue Share (%), by Country 2024 & 2032
- Figure 4: North America US Luxury Residential Market Revenue (Million), by Type 2024 & 2032
- Figure 5: North America US Luxury Residential Market Revenue Share (%), by Type 2024 & 2032
- Figure 6: North America US Luxury Residential Market Revenue (Million), by City 2024 & 2032
- Figure 7: North America US Luxury Residential Market Revenue Share (%), by City 2024 & 2032
- Figure 8: North America US Luxury Residential Market Revenue (Million), by Country 2024 & 2032
- Figure 9: North America US Luxury Residential Market Revenue Share (%), by Country 2024 & 2032
- Figure 10: South America US Luxury Residential Market Revenue (Million), by Type 2024 & 2032
- Figure 11: South America US Luxury Residential Market Revenue Share (%), by Type 2024 & 2032
- Figure 12: South America US Luxury Residential Market Revenue (Million), by City 2024 & 2032
- Figure 13: South America US Luxury Residential Market Revenue Share (%), by City 2024 & 2032
- Figure 14: South America US Luxury Residential Market Revenue (Million), by Country 2024 & 2032
- Figure 15: South America US Luxury Residential Market Revenue Share (%), by Country 2024 & 2032
- Figure 16: Europe US Luxury Residential Market Revenue (Million), by Type 2024 & 2032
- Figure 17: Europe US Luxury Residential Market Revenue Share (%), by Type 2024 & 2032
- Figure 18: Europe US Luxury Residential Market Revenue (Million), by City 2024 & 2032
- Figure 19: Europe US Luxury Residential Market Revenue Share (%), by City 2024 & 2032
- Figure 20: Europe US Luxury Residential Market Revenue (Million), by Country 2024 & 2032
- Figure 21: Europe US Luxury Residential Market Revenue Share (%), by Country 2024 & 2032
- Figure 22: Middle East & Africa US Luxury Residential Market Revenue (Million), by Type 2024 & 2032
- Figure 23: Middle East & Africa US Luxury Residential Market Revenue Share (%), by Type 2024 & 2032
- Figure 24: Middle East & Africa US Luxury Residential Market Revenue (Million), by City 2024 & 2032
- Figure 25: Middle East & Africa US Luxury Residential Market Revenue Share (%), by City 2024 & 2032
- Figure 26: Middle East & Africa US Luxury Residential Market Revenue (Million), by Country 2024 & 2032
- Figure 27: Middle East & Africa US Luxury Residential Market Revenue Share (%), by Country 2024 & 2032
- Figure 28: Asia Pacific US Luxury Residential Market Revenue (Million), by Type 2024 & 2032
- Figure 29: Asia Pacific US Luxury Residential Market Revenue Share (%), by Type 2024 & 2032
- Figure 30: Asia Pacific US Luxury Residential Market Revenue (Million), by City 2024 & 2032
- Figure 31: Asia Pacific US Luxury Residential Market Revenue Share (%), by City 2024 & 2032
- Figure 32: Asia Pacific US Luxury Residential Market Revenue (Million), by Country 2024 & 2032
- Figure 33: Asia Pacific US Luxury Residential Market Revenue Share (%), by Country 2024 & 2032
List of Tables
- Table 1: Global US Luxury Residential Market Revenue Million Forecast, by Region 2019 & 2032
- Table 2: Global US Luxury Residential Market Revenue Million Forecast, by Type 2019 & 2032
- Table 3: Global US Luxury Residential Market Revenue Million Forecast, by City 2019 & 2032
- Table 4: Global US Luxury Residential Market Revenue Million Forecast, by Region 2019 & 2032
- Table 5: Global US Luxury Residential Market Revenue Million Forecast, by Country 2019 & 2032
- Table 6: Northeast US Luxury Residential Market Revenue (Million) Forecast, by Application 2019 & 2032
- Table 7: Southeast US Luxury Residential Market Revenue (Million) Forecast, by Application 2019 & 2032
- Table 8: Midwest US Luxury Residential Market Revenue (Million) Forecast, by Application 2019 & 2032
- Table 9: Southwest US Luxury Residential Market Revenue (Million) Forecast, by Application 2019 & 2032
- Table 10: West US Luxury Residential Market Revenue (Million) Forecast, by Application 2019 & 2032
- Table 11: Global US Luxury Residential Market Revenue Million Forecast, by Type 2019 & 2032
- Table 12: Global US Luxury Residential Market Revenue Million Forecast, by City 2019 & 2032
- Table 13: Global US Luxury Residential Market Revenue Million Forecast, by Country 2019 & 2032
- Table 14: United States US Luxury Residential Market Revenue (Million) Forecast, by Application 2019 & 2032
- Table 15: Canada US Luxury Residential Market Revenue (Million) Forecast, by Application 2019 & 2032
- Table 16: Mexico US Luxury Residential Market Revenue (Million) Forecast, by Application 2019 & 2032
- Table 17: Global US Luxury Residential Market Revenue Million Forecast, by Type 2019 & 2032
- Table 18: Global US Luxury Residential Market Revenue Million Forecast, by City 2019 & 2032
- Table 19: Global US Luxury Residential Market Revenue Million Forecast, by Country 2019 & 2032
- Table 20: Brazil US Luxury Residential Market Revenue (Million) Forecast, by Application 2019 & 2032
- Table 21: Argentina US Luxury Residential Market Revenue (Million) Forecast, by Application 2019 & 2032
- Table 22: Rest of South America US Luxury Residential Market Revenue (Million) Forecast, by Application 2019 & 2032
- Table 23: Global US Luxury Residential Market Revenue Million Forecast, by Type 2019 & 2032
- Table 24: Global US Luxury Residential Market Revenue Million Forecast, by City 2019 & 2032
- Table 25: Global US Luxury Residential Market Revenue Million Forecast, by Country 2019 & 2032
- Table 26: United Kingdom US Luxury Residential Market Revenue (Million) Forecast, by Application 2019 & 2032
- Table 27: Germany US Luxury Residential Market Revenue (Million) Forecast, by Application 2019 & 2032
- Table 28: France US Luxury Residential Market Revenue (Million) Forecast, by Application 2019 & 2032
- Table 29: Italy US Luxury Residential Market Revenue (Million) Forecast, by Application 2019 & 2032
- Table 30: Spain US Luxury Residential Market Revenue (Million) Forecast, by Application 2019 & 2032
- Table 31: Russia US Luxury Residential Market Revenue (Million) Forecast, by Application 2019 & 2032
- Table 32: Benelux US Luxury Residential Market Revenue (Million) Forecast, by Application 2019 & 2032
- Table 33: Nordics US Luxury Residential Market Revenue (Million) Forecast, by Application 2019 & 2032
- Table 34: Rest of Europe US Luxury Residential Market Revenue (Million) Forecast, by Application 2019 & 2032
- Table 35: Global US Luxury Residential Market Revenue Million Forecast, by Type 2019 & 2032
- Table 36: Global US Luxury Residential Market Revenue Million Forecast, by City 2019 & 2032
- Table 37: Global US Luxury Residential Market Revenue Million Forecast, by Country 2019 & 2032
- Table 38: Turkey US Luxury Residential Market Revenue (Million) Forecast, by Application 2019 & 2032
- Table 39: Israel US Luxury Residential Market Revenue (Million) Forecast, by Application 2019 & 2032
- Table 40: GCC US Luxury Residential Market Revenue (Million) Forecast, by Application 2019 & 2032
- Table 41: North Africa US Luxury Residential Market Revenue (Million) Forecast, by Application 2019 & 2032
- Table 42: South Africa US Luxury Residential Market Revenue (Million) Forecast, by Application 2019 & 2032
- Table 43: Rest of Middle East & Africa US Luxury Residential Market Revenue (Million) Forecast, by Application 2019 & 2032
- Table 44: Global US Luxury Residential Market Revenue Million Forecast, by Type 2019 & 2032
- Table 45: Global US Luxury Residential Market Revenue Million Forecast, by City 2019 & 2032
- Table 46: Global US Luxury Residential Market Revenue Million Forecast, by Country 2019 & 2032
- Table 47: China US Luxury Residential Market Revenue (Million) Forecast, by Application 2019 & 2032
- Table 48: India US Luxury Residential Market Revenue (Million) Forecast, by Application 2019 & 2032
- Table 49: Japan US Luxury Residential Market Revenue (Million) Forecast, by Application 2019 & 2032
- Table 50: South Korea US Luxury Residential Market Revenue (Million) Forecast, by Application 2019 & 2032
- Table 51: ASEAN US Luxury Residential Market Revenue (Million) Forecast, by Application 2019 & 2032
- Table 52: Oceania US Luxury Residential Market Revenue (Million) Forecast, by Application 2019 & 2032
- Table 53: Rest of Asia Pacific US Luxury Residential Market Revenue (Million) Forecast, by Application 2019 & 2032
Frequently Asked Questions
1. What is the projected Compound Annual Growth Rate (CAGR) of the US Luxury Residential Market?
The projected CAGR is approximately > 3.00%.
2. Which companies are prominent players in the US Luxury Residential Market?
Key companies in the market include Hann Builders, McEwan Custom Homes**List Not Exhaustive, Toll Brothers Inc, Phil Kean Designs Inc, Kean Development, Calvis Wyant, Wardell Builders, D R Horton, Haley Custom Homes, Bob Thompson Homes.
3. What are the main segments of the US Luxury Residential Market?
The market segments include Type, City.
4. Can you provide details about the market size?
The market size is estimated to be USD XX Million as of 2022.
5. What are some drivers contributing to market growth?
Energy efficiency in construction; Flexibility and customization options.
6. What are the notable trends driving market growth?
Home Automation Becoming a Pre-requisite for Luxury Real Estate.
7. Are there any restraints impacting market growth?
Limited availability of suitable land for construction; Lower quality compared to traditional construction.
8. Can you provide examples of recent developments in the market?
N/A
9. What pricing options are available for accessing the report?
Pricing options include single-user, multi-user, and enterprise licenses priced at USD 3800, USD 4500, and USD 5800 respectively.
10. Is the market size provided in terms of value or volume?
The market size is provided in terms of value, measured in Million.
11. Are there any specific market keywords associated with the report?
Yes, the market keyword associated with the report is "US Luxury Residential Market," which aids in identifying and referencing the specific market segment covered.
12. How do I determine which pricing option suits my needs best?
The pricing options vary based on user requirements and access needs. Individual users may opt for single-user licenses, while businesses requiring broader access may choose multi-user or enterprise licenses for cost-effective access to the report.
13. Are there any additional resources or data provided in the US Luxury Residential Market report?
While the report offers comprehensive insights, it's advisable to review the specific contents or supplementary materials provided to ascertain if additional resources or data are available.
14. How can I stay updated on further developments or reports in the US Luxury Residential Market?
To stay informed about further developments, trends, and reports in the US Luxury Residential Market, consider subscribing to industry newsletters, following relevant companies and organizations, or regularly checking reputable industry news sources and publications.
Methodology
Step 1 - Identification of Relevant Samples Size from Population Database


Step 2 - Approaches for Defining Global Market Size (Value, Volume* & Price*)

Note*: In applicable scenarios
Step 3 - Data Sources
Primary Research
- Web Analytics
- Survey Reports
- Research Institute
- Latest Research Reports
- Opinion Leaders
Secondary Research
- Annual Reports
- White Paper
- Latest Press Release
- Industry Association
- Paid Database
- Investor Presentations

Step 4 - Data Triangulation
Involves using different sources of information in order to increase the validity of a study
These sources are likely to be stakeholders in a program - participants, other researchers, program staff, other community members, and so on.
Then we put all data in single framework & apply various statistical tools to find out the dynamic on the market.
During the analysis stage, feedback from the stakeholder groups would be compared to determine areas of agreement as well as areas of divergence


