
Key Insights
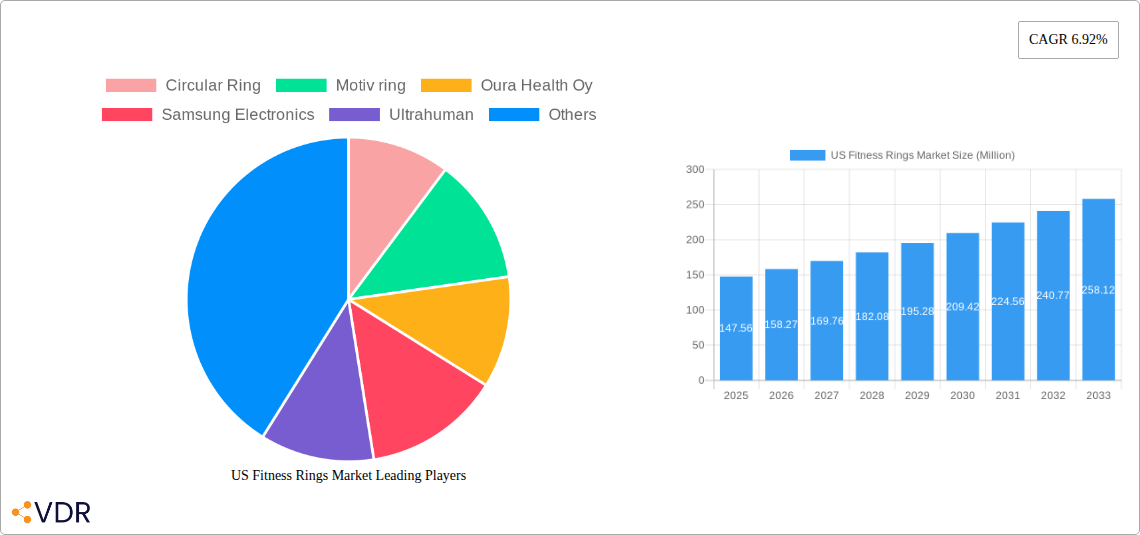
The US fitness ring market, valued at $147.56 million in 2025, is projected to experience robust growth, driven by several key factors. The increasing prevalence of health-conscious lifestyles, coupled with advancements in wearable technology offering sophisticated health tracking capabilities beyond simple step counting, fuels market expansion. Consumers are increasingly seeking convenient and discreet ways to monitor their sleep, activity levels, and overall wellbeing, making fitness rings an attractive alternative to bulky smartwatches. The integration of advanced sensors enabling accurate heart rate monitoring, sleep stage analysis, and even stress detection significantly enhances the value proposition. Furthermore, the market benefits from continuous innovation in materials, design, and functionality, leading to more comfortable, stylish, and feature-rich devices. Competition among established players like Fitbit (Google), Oura, and emerging brands is fostering price reductions and improvements in product quality, making fitness rings accessible to a broader consumer base.
However, challenges remain. Pricing remains a barrier for some consumers, particularly those seeking entry-level functionality. Concerns regarding data privacy and the potential for inaccurate readings from certain sensors could impact consumer trust. Maintaining consistent user engagement beyond the initial novelty phase presents an ongoing challenge for manufacturers. Future growth will hinge on addressing these issues through continued technological advancements, strategic marketing emphasizing data security and accuracy, and the development of engaging user interfaces that encourage long-term adoption. The market's success depends on striking a balance between sophisticated technology and ease of use, appealing to a wider demographic beyond early adopters and tech enthusiasts.
US Fitness Rings Market: A Comprehensive Report (2019-2033)
This in-depth report provides a comprehensive analysis of the US Fitness Rings Market, encompassing market dynamics, growth trends, competitive landscape, and future outlook. The report covers the period from 2019 to 2033, with 2025 as the base year and forecast extending to 2033. The analysis delves into various segments of the wearable technology market, focusing specifically on the rapidly evolving fitness ring sector. The parent market is the broader US Wearable Technology Market, while the child market is specifically Fitness Trackers within the Wearables sector. The market size is presented in Million Units.
US Fitness Rings Market Dynamics & Structure
The US fitness rings market is characterized by moderate concentration, with key players like Fitbit, Samsung, and Oura Health holding significant market share, estimated at xx%, xx%, and xx% respectively in 2025. However, emerging companies like RingConn and Ultrahuman are rapidly gaining traction. Technological innovation, particularly in AI-powered health monitoring and improved sensor technology, is a primary driver of market growth. Regulatory frameworks related to data privacy and device safety are increasingly influencing market dynamics. Competitive substitutes include traditional fitness trackers and smartwatches, presenting challenges to market penetration. The end-user demographic is predominantly young adults and health-conscious individuals, with expanding adoption among older age groups. M&A activity in the broader wearable technology sector is robust, with an estimated xx deals completed in the last five years, indicating potential consolidation within the fitness ring segment.
- Market Concentration: Moderately concentrated, with top players holding xx% of market share in 2025.
- Technological Innovation: AI-powered health monitoring, improved sensor accuracy, and miniaturization are key drivers.
- Regulatory Landscape: Data privacy regulations and device safety standards impact market growth.
- Competitive Substitutes: Smartwatches and traditional fitness trackers present competition.
- End-User Demographics: Primarily young adults and health-conscious individuals; expanding to older demographics.
- M&A Trends: Significant M&A activity in the broader wearable tech sector (xx deals in past 5 years).
US Fitness Rings Market Growth Trends & Insights
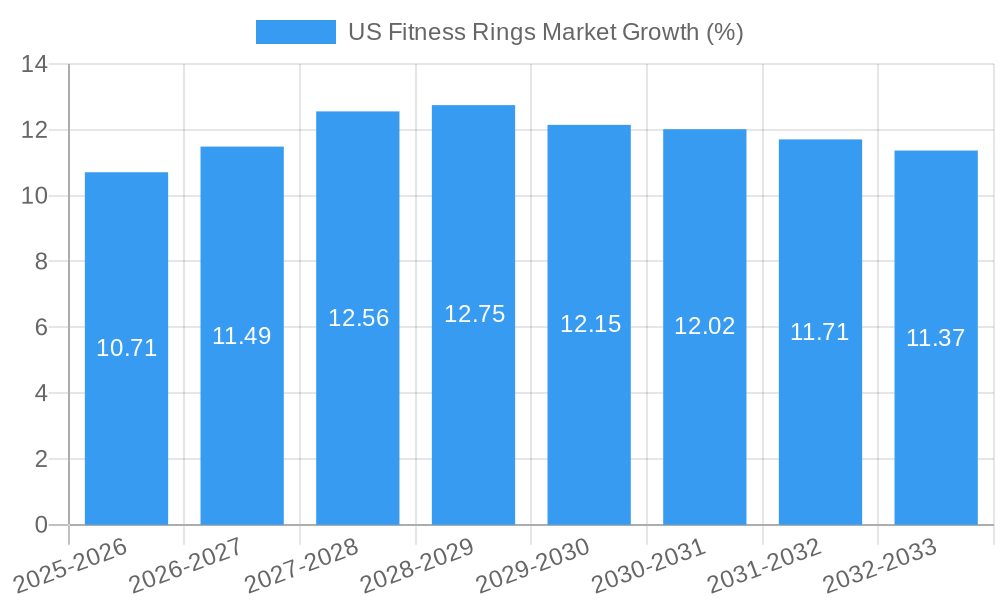
The US fitness rings market is experiencing robust growth, driven by increasing health awareness, technological advancements, and the rising adoption of wearable technology. The market size, estimated at xx million units in 2025, is projected to reach xx million units by 2033, exhibiting a CAGR of xx% during the forecast period. This growth is fueled by the continuous improvement of sensors and data analysis capabilities that allow for more accurate and insightful health data. Furthermore, increased consumer demand for personalized health information and convenient health monitoring contributes to the market’s expansion. Technological disruptions, such as the integration of AI and machine learning, are enhancing the functionality and appeal of fitness rings. Shifting consumer behavior, marked by an increasing preference for discreet and comfortable wearable devices, favors the adoption of fitness rings. Market penetration is expected to increase from xx% in 2025 to xx% by 2033, primarily driven by rising health consciousness and affordable pricing.
Dominant Regions, Countries, or Segments in US Fitness Rings Market
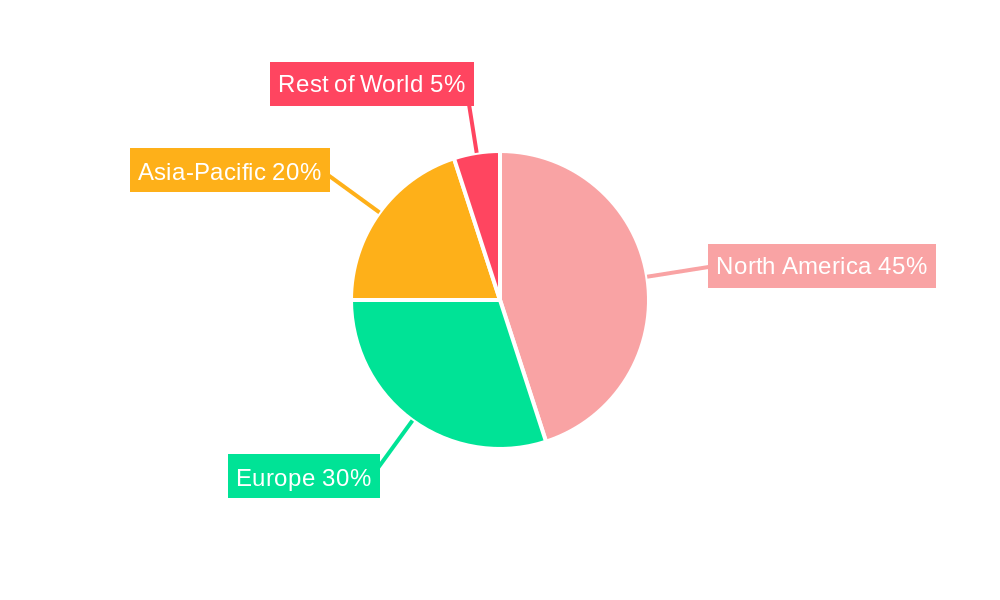
The dominant region within the US fitness rings market is the West Coast, particularly California, due to a high concentration of tech-savvy consumers and the presence of major technology companies driving innovation. This region boasts a high disposable income and a strong focus on wellness and health, fueling higher adoption rates. The strong technology infrastructure and early adoption of new technologies contribute to the region's dominance. Key drivers include:
- High Disposable Income: Higher purchasing power allows for greater investment in wearable technology.
- Tech-Savvy Population: Early adoption and understanding of fitness-related technology.
- Health-Conscious Culture: Strong emphasis on wellness and preventive health measures.
- Presence of Major Tech Companies: Increased R&D and product launches within the region.
The market share of the West Coast is projected to remain around xx% throughout the forecast period, with consistent growth, driven by factors such as higher disposable income and an increasing health-conscious culture among consumers.
US Fitness Rings Market Product Landscape
Fitness rings are evolving beyond simple activity tracking. Current offerings incorporate advanced sensors for continuous heart rate monitoring, sleep analysis, blood oxygen saturation, and even respiration rate. Many incorporate AI-powered analytics, providing personalized insights and actionable advice to users. Unique selling propositions include discreet design, continuous wear comfort, and the ability to track sleep, activity, and other health metrics without the bulk of a smartwatch. Technological advancements focus on improving sensor accuracy, reducing power consumption, and enhancing the user experience through intuitive apps and data visualization.
Key Drivers, Barriers & Challenges in US Fitness Rings Market
Key Drivers:
- Increasing health awareness among consumers.
- Advancements in sensor technology and AI-driven analytics.
- Growing demand for personalized health monitoring solutions.
- Convenience and discreet nature of fitness rings.
Challenges & Restraints:
- High initial cost of premium fitness rings can limit market penetration.
- Concerns regarding data privacy and security.
- Battery life limitations and charging frequency requirements.
- Potential accuracy issues with certain sensor technologies.
- Competitive pressure from established players in the wearables market. This is estimated to slow the CAGR by approximately xx% by 2030.
Emerging Opportunities in US Fitness Rings Market
- Integration with other health platforms: Connecting fitness ring data with existing health apps and services can enhance its value proposition.
- Expansion into niche markets: Targeting specific demographics like athletes or seniors with tailored features.
- Development of advanced health monitoring capabilities: Adding features like stress level detection, ECG, or early disease detection.
- Exploring novel materials and design: Improving comfort, durability, and aesthetics.
Growth Accelerators in the US Fitness Rings Market Industry
Technological breakthroughs in miniaturization and sensor technology, coupled with the development of advanced AI algorithms for data analysis, will significantly propel market growth. Strategic partnerships between fitness ring manufacturers and healthcare providers can create new revenue streams and expand the market reach. Aggressive marketing and education campaigns to raise consumer awareness of the benefits of fitness rings will be crucial in driving market adoption.
Key Players Shaping the US Fitness Rings Market Market
- Circular Ring
- Motiv ring
- Oura Health Oy
- Samsung Electronics
- Ultrahuman
- RingConn
- Amazfit
- Fitbit Inc (Google Inc)
- Sleepo
Notable Milestones in US Fitness Rings Market Sector
- April 2024: Ultrahuman announces the establishment of an UltraFactory in the US, signaling significant investment in production capacity and a commitment to market leadership.
- July 2024: Samsung launches an AI-powered smart ring with an "Energy Score" feature, emphasizing personalized insights and enhancing user experience.
- August 2024: RingConn releases its second-generation smart ring with improved AI-powered breathing and respiration monitoring capabilities, enhancing health monitoring features.
In-Depth US Fitness Rings Market Market Outlook
The US fitness rings market presents significant future potential, driven by continuous technological advancements, expanding consumer awareness of the health benefits, and increased integration with existing health ecosystems. Strategic partnerships and the development of innovative features will drive further growth. The market is expected to witness significant expansion in coming years, creating lucrative opportunities for both established and emerging players.
US Fitness Rings Market Segmentation
-
1. Product Type
- 1.1. Basic Fitness ring
- 1.2. Smart Fitness Rings
US Fitness Rings Market Segmentation By Geography
-
1. North America
- 1.1. United States
- 1.2. Canada
- 1.3. Mexico
-
2. South America
- 2.1. Brazil
- 2.2. Argentina
- 2.3. Rest of South America
-
3. Europe
- 3.1. United Kingdom
- 3.2. Germany
- 3.3. France
- 3.4. Italy
- 3.5. Spain
- 3.6. Russia
- 3.7. Benelux
- 3.8. Nordics
- 3.9. Rest of Europe
-
4. Middle East & Africa
- 4.1. Turkey
- 4.2. Israel
- 4.3. GCC
- 4.4. North Africa
- 4.5. South Africa
- 4.6. Rest of Middle East & Africa
-
5. Asia Pacific
- 5.1. China
- 5.2. India
- 5.3. Japan
- 5.4. South Korea
- 5.5. ASEAN
- 5.6. Oceania
- 5.7. Rest of Asia Pacific
US Fitness Rings Market REPORT HIGHLIGHTS
| Aspects | Details |
|---|---|
| Study Period | 2019-2033 |
| Base Year | 2024 |
| Estimated Year | 2025 |
| Forecast Period | 2025-2033 |
| Historical Period | 2019-2024 |
| Growth Rate | CAGR of 6.92% from 2019-2033 |
| Segmentation |
|
Table of Contents
- 1. Introduction
- 1.1. Research Scope
- 1.2. Market Segmentation
- 1.3. Research Methodology
- 1.4. Definitions and Assumptions
- 2. Executive Summary
- 2.1. Introduction
- 3. Market Dynamics
- 3.1. Introduction
- 3.2. Market Drivers
- 3.2.1. Growing Demand of Wearable Devices; Growth in demand for compact devices
- 3.3. Market Restrains
- 3.3.1. Growing Demand of Wearable Devices; Growth in demand for compact devices
- 3.4. Market Trends
- 3.4.1. Growing Demand of Wearable Devices
- 4. Market Factor Analysis
- 4.1. Porters Five Forces
- 4.2. Supply/Value Chain
- 4.3. PESTEL analysis
- 4.4. Market Entropy
- 4.5. Patent/Trademark Analysis
- 5. Global US Fitness Rings Market Analysis, Insights and Forecast, 2019-2031
- 5.1. Market Analysis, Insights and Forecast - by Product Type
- 5.1.1. Basic Fitness ring
- 5.1.2. Smart Fitness Rings
- 5.2. Market Analysis, Insights and Forecast - by Region
- 5.2.1. North America
- 5.2.2. South America
- 5.2.3. Europe
- 5.2.4. Middle East & Africa
- 5.2.5. Asia Pacific
- 5.1. Market Analysis, Insights and Forecast - by Product Type
- 6. North America US Fitness Rings Market Analysis, Insights and Forecast, 2019-2031
- 6.1. Market Analysis, Insights and Forecast - by Product Type
- 6.1.1. Basic Fitness ring
- 6.1.2. Smart Fitness Rings
- 6.1. Market Analysis, Insights and Forecast - by Product Type
- 7. South America US Fitness Rings Market Analysis, Insights and Forecast, 2019-2031
- 7.1. Market Analysis, Insights and Forecast - by Product Type
- 7.1.1. Basic Fitness ring
- 7.1.2. Smart Fitness Rings
- 7.1. Market Analysis, Insights and Forecast - by Product Type
- 8. Europe US Fitness Rings Market Analysis, Insights and Forecast, 2019-2031
- 8.1. Market Analysis, Insights and Forecast - by Product Type
- 8.1.1. Basic Fitness ring
- 8.1.2. Smart Fitness Rings
- 8.1. Market Analysis, Insights and Forecast - by Product Type
- 9. Middle East & Africa US Fitness Rings Market Analysis, Insights and Forecast, 2019-2031
- 9.1. Market Analysis, Insights and Forecast - by Product Type
- 9.1.1. Basic Fitness ring
- 9.1.2. Smart Fitness Rings
- 9.1. Market Analysis, Insights and Forecast - by Product Type
- 10. Asia Pacific US Fitness Rings Market Analysis, Insights and Forecast, 2019-2031
- 10.1. Market Analysis, Insights and Forecast - by Product Type
- 10.1.1. Basic Fitness ring
- 10.1.2. Smart Fitness Rings
- 10.1. Market Analysis, Insights and Forecast - by Product Type
- 11. Competitive Analysis
- 11.1. Global Market Share Analysis 2024
- 11.2. Company Profiles
- 11.2.1 Circular Ring
- 11.2.1.1. Overview
- 11.2.1.2. Products
- 11.2.1.3. SWOT Analysis
- 11.2.1.4. Recent Developments
- 11.2.1.5. Financials (Based on Availability)
- 11.2.2 Motiv ring
- 11.2.2.1. Overview
- 11.2.2.2. Products
- 11.2.2.3. SWOT Analysis
- 11.2.2.4. Recent Developments
- 11.2.2.5. Financials (Based on Availability)
- 11.2.3 Oura Health Oy
- 11.2.3.1. Overview
- 11.2.3.2. Products
- 11.2.3.3. SWOT Analysis
- 11.2.3.4. Recent Developments
- 11.2.3.5. Financials (Based on Availability)
- 11.2.4 Samsung Electronics
- 11.2.4.1. Overview
- 11.2.4.2. Products
- 11.2.4.3. SWOT Analysis
- 11.2.4.4. Recent Developments
- 11.2.4.5. Financials (Based on Availability)
- 11.2.5 Ultrahuman
- 11.2.5.1. Overview
- 11.2.5.2. Products
- 11.2.5.3. SWOT Analysis
- 11.2.5.4. Recent Developments
- 11.2.5.5. Financials (Based on Availability)
- 11.2.6 RingConn
- 11.2.6.1. Overview
- 11.2.6.2. Products
- 11.2.6.3. SWOT Analysis
- 11.2.6.4. Recent Developments
- 11.2.6.5. Financials (Based on Availability)
- 11.2.7 Amazfit
- 11.2.7.1. Overview
- 11.2.7.2. Products
- 11.2.7.3. SWOT Analysis
- 11.2.7.4. Recent Developments
- 11.2.7.5. Financials (Based on Availability)
- 11.2.8 Fitbit Inc (Google Inc )
- 11.2.8.1. Overview
- 11.2.8.2. Products
- 11.2.8.3. SWOT Analysis
- 11.2.8.4. Recent Developments
- 11.2.8.5. Financials (Based on Availability)
- 11.2.9 Sleepo
- 11.2.9.1. Overview
- 11.2.9.2. Products
- 11.2.9.3. SWOT Analysis
- 11.2.9.4. Recent Developments
- 11.2.9.5. Financials (Based on Availability)
- 11.2.1 Circular Ring
List of Figures
- Figure 1: Global US Fitness Rings Market Revenue Breakdown (Million, %) by Region 2024 & 2032
- Figure 2: Global US Fitness Rings Market Volume Breakdown (Million, %) by Region 2024 & 2032
- Figure 3: North America US Fitness Rings Market Revenue (Million), by Product Type 2024 & 2032
- Figure 4: North America US Fitness Rings Market Volume (Million), by Product Type 2024 & 2032
- Figure 5: North America US Fitness Rings Market Revenue Share (%), by Product Type 2024 & 2032
- Figure 6: North America US Fitness Rings Market Volume Share (%), by Product Type 2024 & 2032
- Figure 7: North America US Fitness Rings Market Revenue (Million), by Country 2024 & 2032
- Figure 8: North America US Fitness Rings Market Volume (Million), by Country 2024 & 2032
- Figure 9: North America US Fitness Rings Market Revenue Share (%), by Country 2024 & 2032
- Figure 10: North America US Fitness Rings Market Volume Share (%), by Country 2024 & 2032
- Figure 11: South America US Fitness Rings Market Revenue (Million), by Product Type 2024 & 2032
- Figure 12: South America US Fitness Rings Market Volume (Million), by Product Type 2024 & 2032
- Figure 13: South America US Fitness Rings Market Revenue Share (%), by Product Type 2024 & 2032
- Figure 14: South America US Fitness Rings Market Volume Share (%), by Product Type 2024 & 2032
- Figure 15: South America US Fitness Rings Market Revenue (Million), by Country 2024 & 2032
- Figure 16: South America US Fitness Rings Market Volume (Million), by Country 2024 & 2032
- Figure 17: South America US Fitness Rings Market Revenue Share (%), by Country 2024 & 2032
- Figure 18: South America US Fitness Rings Market Volume Share (%), by Country 2024 & 2032
- Figure 19: Europe US Fitness Rings Market Revenue (Million), by Product Type 2024 & 2032
- Figure 20: Europe US Fitness Rings Market Volume (Million), by Product Type 2024 & 2032
- Figure 21: Europe US Fitness Rings Market Revenue Share (%), by Product Type 2024 & 2032
- Figure 22: Europe US Fitness Rings Market Volume Share (%), by Product Type 2024 & 2032
- Figure 23: Europe US Fitness Rings Market Revenue (Million), by Country 2024 & 2032
- Figure 24: Europe US Fitness Rings Market Volume (Million), by Country 2024 & 2032
- Figure 25: Europe US Fitness Rings Market Revenue Share (%), by Country 2024 & 2032
- Figure 26: Europe US Fitness Rings Market Volume Share (%), by Country 2024 & 2032
- Figure 27: Middle East & Africa US Fitness Rings Market Revenue (Million), by Product Type 2024 & 2032
- Figure 28: Middle East & Africa US Fitness Rings Market Volume (Million), by Product Type 2024 & 2032
- Figure 29: Middle East & Africa US Fitness Rings Market Revenue Share (%), by Product Type 2024 & 2032
- Figure 30: Middle East & Africa US Fitness Rings Market Volume Share (%), by Product Type 2024 & 2032
- Figure 31: Middle East & Africa US Fitness Rings Market Revenue (Million), by Country 2024 & 2032
- Figure 32: Middle East & Africa US Fitness Rings Market Volume (Million), by Country 2024 & 2032
- Figure 33: Middle East & Africa US Fitness Rings Market Revenue Share (%), by Country 2024 & 2032
- Figure 34: Middle East & Africa US Fitness Rings Market Volume Share (%), by Country 2024 & 2032
- Figure 35: Asia Pacific US Fitness Rings Market Revenue (Million), by Product Type 2024 & 2032
- Figure 36: Asia Pacific US Fitness Rings Market Volume (Million), by Product Type 2024 & 2032
- Figure 37: Asia Pacific US Fitness Rings Market Revenue Share (%), by Product Type 2024 & 2032
- Figure 38: Asia Pacific US Fitness Rings Market Volume Share (%), by Product Type 2024 & 2032
- Figure 39: Asia Pacific US Fitness Rings Market Revenue (Million), by Country 2024 & 2032
- Figure 40: Asia Pacific US Fitness Rings Market Volume (Million), by Country 2024 & 2032
- Figure 41: Asia Pacific US Fitness Rings Market Revenue Share (%), by Country 2024 & 2032
- Figure 42: Asia Pacific US Fitness Rings Market Volume Share (%), by Country 2024 & 2032
List of Tables
- Table 1: Global US Fitness Rings Market Revenue Million Forecast, by Region 2019 & 2032
- Table 2: Global US Fitness Rings Market Volume Million Forecast, by Region 2019 & 2032
- Table 3: Global US Fitness Rings Market Revenue Million Forecast, by Product Type 2019 & 2032
- Table 4: Global US Fitness Rings Market Volume Million Forecast, by Product Type 2019 & 2032
- Table 5: Global US Fitness Rings Market Revenue Million Forecast, by Region 2019 & 2032
- Table 6: Global US Fitness Rings Market Volume Million Forecast, by Region 2019 & 2032
- Table 7: Global US Fitness Rings Market Revenue Million Forecast, by Product Type 2019 & 2032
- Table 8: Global US Fitness Rings Market Volume Million Forecast, by Product Type 2019 & 2032
- Table 9: Global US Fitness Rings Market Revenue Million Forecast, by Country 2019 & 2032
- Table 10: Global US Fitness Rings Market Volume Million Forecast, by Country 2019 & 2032
- Table 11: United States US Fitness Rings Market Revenue (Million) Forecast, by Application 2019 & 2032
- Table 12: United States US Fitness Rings Market Volume (Million) Forecast, by Application 2019 & 2032
- Table 13: Canada US Fitness Rings Market Revenue (Million) Forecast, by Application 2019 & 2032
- Table 14: Canada US Fitness Rings Market Volume (Million) Forecast, by Application 2019 & 2032
- Table 15: Mexico US Fitness Rings Market Revenue (Million) Forecast, by Application 2019 & 2032
- Table 16: Mexico US Fitness Rings Market Volume (Million) Forecast, by Application 2019 & 2032
- Table 17: Global US Fitness Rings Market Revenue Million Forecast, by Product Type 2019 & 2032
- Table 18: Global US Fitness Rings Market Volume Million Forecast, by Product Type 2019 & 2032
- Table 19: Global US Fitness Rings Market Revenue Million Forecast, by Country 2019 & 2032
- Table 20: Global US Fitness Rings Market Volume Million Forecast, by Country 2019 & 2032
- Table 21: Brazil US Fitness Rings Market Revenue (Million) Forecast, by Application 2019 & 2032
- Table 22: Brazil US Fitness Rings Market Volume (Million) Forecast, by Application 2019 & 2032
- Table 23: Argentina US Fitness Rings Market Revenue (Million) Forecast, by Application 2019 & 2032
- Table 24: Argentina US Fitness Rings Market Volume (Million) Forecast, by Application 2019 & 2032
- Table 25: Rest of South America US Fitness Rings Market Revenue (Million) Forecast, by Application 2019 & 2032
- Table 26: Rest of South America US Fitness Rings Market Volume (Million) Forecast, by Application 2019 & 2032
- Table 27: Global US Fitness Rings Market Revenue Million Forecast, by Product Type 2019 & 2032
- Table 28: Global US Fitness Rings Market Volume Million Forecast, by Product Type 2019 & 2032
- Table 29: Global US Fitness Rings Market Revenue Million Forecast, by Country 2019 & 2032
- Table 30: Global US Fitness Rings Market Volume Million Forecast, by Country 2019 & 2032
- Table 31: United Kingdom US Fitness Rings Market Revenue (Million) Forecast, by Application 2019 & 2032
- Table 32: United Kingdom US Fitness Rings Market Volume (Million) Forecast, by Application 2019 & 2032
- Table 33: Germany US Fitness Rings Market Revenue (Million) Forecast, by Application 2019 & 2032
- Table 34: Germany US Fitness Rings Market Volume (Million) Forecast, by Application 2019 & 2032
- Table 35: France US Fitness Rings Market Revenue (Million) Forecast, by Application 2019 & 2032
- Table 36: France US Fitness Rings Market Volume (Million) Forecast, by Application 2019 & 2032
- Table 37: Italy US Fitness Rings Market Revenue (Million) Forecast, by Application 2019 & 2032
- Table 38: Italy US Fitness Rings Market Volume (Million) Forecast, by Application 2019 & 2032
- Table 39: Spain US Fitness Rings Market Revenue (Million) Forecast, by Application 2019 & 2032
- Table 40: Spain US Fitness Rings Market Volume (Million) Forecast, by Application 2019 & 2032
- Table 41: Russia US Fitness Rings Market Revenue (Million) Forecast, by Application 2019 & 2032
- Table 42: Russia US Fitness Rings Market Volume (Million) Forecast, by Application 2019 & 2032
- Table 43: Benelux US Fitness Rings Market Revenue (Million) Forecast, by Application 2019 & 2032
- Table 44: Benelux US Fitness Rings Market Volume (Million) Forecast, by Application 2019 & 2032
- Table 45: Nordics US Fitness Rings Market Revenue (Million) Forecast, by Application 2019 & 2032
- Table 46: Nordics US Fitness Rings Market Volume (Million) Forecast, by Application 2019 & 2032
- Table 47: Rest of Europe US Fitness Rings Market Revenue (Million) Forecast, by Application 2019 & 2032
- Table 48: Rest of Europe US Fitness Rings Market Volume (Million) Forecast, by Application 2019 & 2032
- Table 49: Global US Fitness Rings Market Revenue Million Forecast, by Product Type 2019 & 2032
- Table 50: Global US Fitness Rings Market Volume Million Forecast, by Product Type 2019 & 2032
- Table 51: Global US Fitness Rings Market Revenue Million Forecast, by Country 2019 & 2032
- Table 52: Global US Fitness Rings Market Volume Million Forecast, by Country 2019 & 2032
- Table 53: Turkey US Fitness Rings Market Revenue (Million) Forecast, by Application 2019 & 2032
- Table 54: Turkey US Fitness Rings Market Volume (Million) Forecast, by Application 2019 & 2032
- Table 55: Israel US Fitness Rings Market Revenue (Million) Forecast, by Application 2019 & 2032
- Table 56: Israel US Fitness Rings Market Volume (Million) Forecast, by Application 2019 & 2032
- Table 57: GCC US Fitness Rings Market Revenue (Million) Forecast, by Application 2019 & 2032
- Table 58: GCC US Fitness Rings Market Volume (Million) Forecast, by Application 2019 & 2032
- Table 59: North Africa US Fitness Rings Market Revenue (Million) Forecast, by Application 2019 & 2032
- Table 60: North Africa US Fitness Rings Market Volume (Million) Forecast, by Application 2019 & 2032
- Table 61: South Africa US Fitness Rings Market Revenue (Million) Forecast, by Application 2019 & 2032
- Table 62: South Africa US Fitness Rings Market Volume (Million) Forecast, by Application 2019 & 2032
- Table 63: Rest of Middle East & Africa US Fitness Rings Market Revenue (Million) Forecast, by Application 2019 & 2032
- Table 64: Rest of Middle East & Africa US Fitness Rings Market Volume (Million) Forecast, by Application 2019 & 2032
- Table 65: Global US Fitness Rings Market Revenue Million Forecast, by Product Type 2019 & 2032
- Table 66: Global US Fitness Rings Market Volume Million Forecast, by Product Type 2019 & 2032
- Table 67: Global US Fitness Rings Market Revenue Million Forecast, by Country 2019 & 2032
- Table 68: Global US Fitness Rings Market Volume Million Forecast, by Country 2019 & 2032
- Table 69: China US Fitness Rings Market Revenue (Million) Forecast, by Application 2019 & 2032
- Table 70: China US Fitness Rings Market Volume (Million) Forecast, by Application 2019 & 2032
- Table 71: India US Fitness Rings Market Revenue (Million) Forecast, by Application 2019 & 2032
- Table 72: India US Fitness Rings Market Volume (Million) Forecast, by Application 2019 & 2032
- Table 73: Japan US Fitness Rings Market Revenue (Million) Forecast, by Application 2019 & 2032
- Table 74: Japan US Fitness Rings Market Volume (Million) Forecast, by Application 2019 & 2032
- Table 75: South Korea US Fitness Rings Market Revenue (Million) Forecast, by Application 2019 & 2032
- Table 76: South Korea US Fitness Rings Market Volume (Million) Forecast, by Application 2019 & 2032
- Table 77: ASEAN US Fitness Rings Market Revenue (Million) Forecast, by Application 2019 & 2032
- Table 78: ASEAN US Fitness Rings Market Volume (Million) Forecast, by Application 2019 & 2032
- Table 79: Oceania US Fitness Rings Market Revenue (Million) Forecast, by Application 2019 & 2032
- Table 80: Oceania US Fitness Rings Market Volume (Million) Forecast, by Application 2019 & 2032
- Table 81: Rest of Asia Pacific US Fitness Rings Market Revenue (Million) Forecast, by Application 2019 & 2032
- Table 82: Rest of Asia Pacific US Fitness Rings Market Volume (Million) Forecast, by Application 2019 & 2032
Frequently Asked Questions
1. What is the projected Compound Annual Growth Rate (CAGR) of the US Fitness Rings Market?
The projected CAGR is approximately 6.92%.
2. Which companies are prominent players in the US Fitness Rings Market?
Key companies in the market include Circular Ring, Motiv ring, Oura Health Oy, Samsung Electronics, Ultrahuman, RingConn, Amazfit, Fitbit Inc (Google Inc ), Sleepo.
3. What are the main segments of the US Fitness Rings Market?
The market segments include Product Type.
4. Can you provide details about the market size?
The market size is estimated to be USD 147.56 Million as of 2022.
5. What are some drivers contributing to market growth?
Growing Demand of Wearable Devices; Growth in demand for compact devices.
6. What are the notable trends driving market growth?
Growing Demand of Wearable Devices.
7. Are there any restraints impacting market growth?
Growing Demand of Wearable Devices; Growth in demand for compact devices.
8. Can you provide examples of recent developments in the market?
August 2024 - RingConn launched its second-generation smart ring wearable. This new version utilizes AI to monitor overnight breathing and respiration, claiming an accuracy of 90.7% in identifying risk events. Rated IP68 for water resistance, the device features photoplethysmography (PPG) sensors for heart rate and blood oxygen saturation, temperature sensors, and accelerometers for motion tracking. It is designed for continuous wear, supporting both health monitoring and exercise tracking.
9. What pricing options are available for accessing the report?
Pricing options include single-user, multi-user, and enterprise licenses priced at USD 3800, USD 4500, and USD 5800 respectively.
10. Is the market size provided in terms of value or volume?
The market size is provided in terms of value, measured in Million and volume, measured in Million.
11. Are there any specific market keywords associated with the report?
Yes, the market keyword associated with the report is "US Fitness Rings Market," which aids in identifying and referencing the specific market segment covered.
12. How do I determine which pricing option suits my needs best?
The pricing options vary based on user requirements and access needs. Individual users may opt for single-user licenses, while businesses requiring broader access may choose multi-user or enterprise licenses for cost-effective access to the report.
13. Are there any additional resources or data provided in the US Fitness Rings Market report?
While the report offers comprehensive insights, it's advisable to review the specific contents or supplementary materials provided to ascertain if additional resources or data are available.
14. How can I stay updated on further developments or reports in the US Fitness Rings Market?
To stay informed about further developments, trends, and reports in the US Fitness Rings Market, consider subscribing to industry newsletters, following relevant companies and organizations, or regularly checking reputable industry news sources and publications.
Methodology
Step 1 - Identification of Relevant Samples Size from Population Database


Step 2 - Approaches for Defining Global Market Size (Value, Volume* & Price*)

Note*: In applicable scenarios
Step 3 - Data Sources
Primary Research
- Web Analytics
- Survey Reports
- Research Institute
- Latest Research Reports
- Opinion Leaders
Secondary Research
- Annual Reports
- White Paper
- Latest Press Release
- Industry Association
- Paid Database
- Investor Presentations

Step 4 - Data Triangulation
Involves using different sources of information in order to increase the validity of a study
These sources are likely to be stakeholders in a program - participants, other researchers, program staff, other community members, and so on.
Then we put all data in single framework & apply various statistical tools to find out the dynamic on the market.
During the analysis stage, feedback from the stakeholder groups would be compared to determine areas of agreement as well as areas of divergence


