
Key Insights
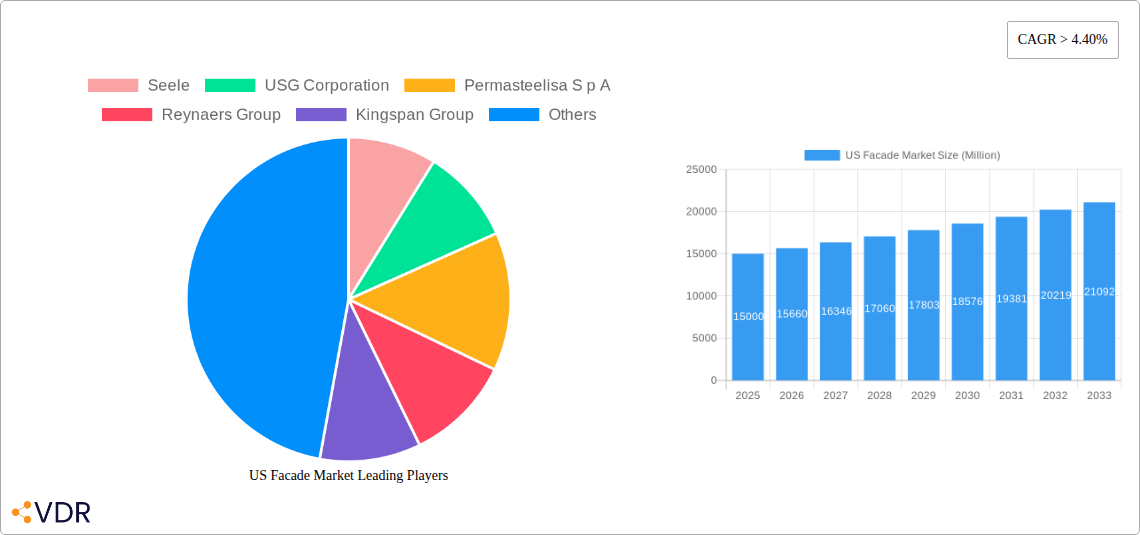
The US facade market, valued at approximately $15 billion in 2025, is experiencing robust growth, projected to expand at a Compound Annual Growth Rate (CAGR) exceeding 4.40% from 2025 to 2033. This expansion is driven by several key factors. Increased construction activity in both residential and commercial sectors, particularly in rapidly developing urban areas like the Northeast and West, fuels significant demand. Furthermore, a growing emphasis on energy efficiency and sustainable building practices is propelling adoption of high-performance ventilated facades and materials like glass and metal known for their thermal performance. Architectural trends favoring modern designs with expansive glazing further contribute to market growth. The market is segmented by type (ventilated, non-ventilated), material (glass, metal, plastic & fibers, stone), and end-user (commercial, residential). The commercial sector currently dominates, fueled by large-scale projects like office buildings and shopping malls. However, the residential segment is witnessing accelerating growth, driven by rising disposable incomes and preferences for aesthetically pleasing and energy-efficient homes.
Despite the positive outlook, certain restraints exist. Fluctuations in raw material prices, particularly for metals, can impact profitability and market growth. Supply chain disruptions, skilled labor shortages, and increasing regulatory compliance requirements also present challenges. However, the market's long-term prospects remain strong due to ongoing urbanization, advancements in facade technology, and the persistent demand for energy-efficient and aesthetically appealing buildings. Key players like Seele, USG Corporation, and Permasteelisa are actively investing in innovation and expansion to capitalize on these growth opportunities, leading to a competitive yet dynamic market landscape. The geographical spread across the United States, with regional variations in construction activity and preferences, indicates diverse market opportunities across regions like the Northeast, Southeast, Midwest, Southwest, and West.
US Facade Market: A Comprehensive Market Report (2019-2033)
This comprehensive report provides an in-depth analysis of the US facade market, encompassing market dynamics, growth trends, key players, and future outlook. The report covers the historical period (2019-2024), base year (2025), and forecast period (2025-2033), offering valuable insights for industry professionals, investors, and strategic decision-makers. The market is segmented by type (ventilated, non-ventilated, others), material (glass, metal, plastic & fibres, stone, others), and end-user (commercial, residential, others). The total market size is projected to reach xx Million by 2033.
US Facade Market Dynamics & Structure
The US facade market is characterized by a moderately concentrated landscape, with key players like Seele, USG Corporation, Permasteelisa S.p.A, and Reynaers Group holding significant market share. Technological innovation, particularly in sustainable and energy-efficient materials, is a major driver. Stringent building codes and regulations regarding energy efficiency and safety significantly impact market dynamics. Competition from substitute materials and increasing construction costs present challenges. The market has witnessed several M&A activities in recent years, with xx deals recorded between 2019 and 2024, consolidating market power among larger players.
- Market Concentration: Moderately concentrated, with top 5 players holding approximately xx% market share in 2024.
- Technological Innovation: Focus on sustainable materials (e.g., recycled content, low-carbon emissions), smart facades (integrated sensors, energy management), and prefabrication.
- Regulatory Framework: Stringent building codes and energy efficiency standards drive demand for high-performance facades.
- Competitive Substitutes: Traditional cladding materials like brick and concrete face competition from innovative facade systems.
- End-User Demographics: Significant growth driven by commercial construction, particularly in urban areas and large infrastructure projects. Residential segment shows steady growth.
- M&A Trends: Consolidation expected to continue, driven by economies of scale and access to new technologies.
US Facade Market Growth Trends & Insights
The US facade market has experienced steady growth over the past few years, driven by robust construction activity, increasing urbanization, and rising demand for aesthetically pleasing and energy-efficient buildings. The market size expanded from xx Million in 2019 to xx Million in 2024, exhibiting a CAGR of xx%. Technological disruptions, particularly the adoption of Building Information Modeling (BIM) and advanced materials, have significantly impacted market growth. Shifting consumer preferences towards sustainable and aesthetically appealing facades also contribute to market expansion. Market penetration of innovative facade systems is expected to increase, driven by growing awareness of environmental concerns and energy efficiency benefits. The forecast period (2025-2033) anticipates sustained growth, driven by ongoing infrastructure development, smart city initiatives, and increasing investment in commercial real estate. The market is projected to reach xx Million by 2033, with a CAGR of xx%.

Dominant Regions, Countries, or Segments in US Facade Market
The Northeast and West Coast regions are currently leading the US facade market, driven by robust construction activity, higher disposable income, and increasing adoption of sustainable building practices. Within the segments, the commercial sector dominates, driven by large-scale construction projects and renovations. The ventilated facade type holds the largest market share, owing to its superior energy efficiency and aesthetic appeal. Glass and metal remain the dominant materials due to their durability, aesthetic versatility, and performance characteristics.
- Key Drivers:
- Robust construction activity in major metropolitan areas.
- Government initiatives promoting energy efficiency and sustainable building practices.
- Increasing adoption of BIM and advanced design technologies.
- Dominance Factors:
- High concentration of commercial construction projects in major cities.
- Preference for energy-efficient ventilated facades in high-rise buildings.
- High demand for aesthetically appealing and durable facade materials.
- Growing demand for sustainable and environmentally friendly building materials
US Facade Market Product Landscape
The US facade market showcases a diverse range of products, including ventilated and non-ventilated systems, utilizing various materials like glass, metal, stone, and high-performance composites. Innovations focus on improved energy efficiency, durability, and aesthetic design. Products are differentiated by their thermal performance, acoustic properties, and ease of installation. Unique selling propositions include integrated solar panels, self-cleaning surfaces, and dynamic lighting features. Technological advancements include the use of smart materials, sensor integration, and advanced manufacturing techniques.
Key Drivers, Barriers & Challenges in US Facade Market
Key Drivers:
- Increased construction activity across various sectors.
- Growing demand for energy-efficient and sustainable buildings.
- Technological advancements in facade materials and systems.
- Government initiatives promoting green building and infrastructure development.
Challenges & Restraints:
- Fluctuating raw material prices impacting profitability.
- Supply chain disruptions impacting project timelines.
- Stringent regulatory compliance requirements.
- Competition from substitute materials. The impact of these challenges can be quantified by analyzing project delays and cost overruns, resulting in a xx% decrease in project profitability in some cases.
Emerging Opportunities in US Facade Market
- Growing demand for smart facades with integrated sensors and energy management systems.
- Increasing adoption of prefabricated facade modules to expedite construction.
- Expansion into niche markets such as historic preservation and retrofits.
- Development of sustainable and recyclable facade materials.
Growth Accelerators in the US Facade Market Industry
Long-term growth is projected to be fueled by strategic partnerships between facade manufacturers and construction companies, technological breakthroughs in sustainable materials and smart building technologies, and expanding markets in emerging economies within the US. Increased adoption of BIM and improved supply chain management are also anticipated to contribute to market growth.
Key Players Shaping the US Facade Market Market
- Seele
- USG Corporation
- Permasteelisa S.p.A
- Reynaers Group
- Kingspan Group
- Louisiana Pacific Corporation
- Guardian Industries
- New Hudson Facades
- Georgia-Pacific L.L.C
- Sky Facade Inc
- Elemex® Inc
- Alphacladding
- GAMCO CORPORATION
Notable Milestones in US Facade Market Sector
- November 2022: LP Building Solutions announces a second production line at its SmartSide® facility in Houlton, Maine, increasing annual capacity by 340 million square feet and creating over 100 jobs. This signifies increased production capacity and potential for lower material costs in the market.
- April 2022: Mocksville, NC launches a facade incentive grant program, offering up to USD 1,500 or 50% of project costs for commercial building renovations. This supports revitalization efforts and stimulates demand for facade upgrades.
In-Depth US Facade Market Market Outlook
The US facade market is poised for significant growth in the coming years, driven by ongoing investments in infrastructure, commercial construction, and a rising focus on sustainable building practices. Strategic partnerships and technological advancements will play a crucial role in shaping the market's future. Opportunities exist for companies to leverage innovative materials, sustainable solutions, and smart building technologies to capture a larger market share. The market's future potential is substantial, particularly in sustainable facade systems and smart building integrations.
US Facade Market Segmentation
-
1. Type
- 1.1. Ventilated
- 1.2. Non-Ventilated
- 1.3. Others
-
2. Material
- 2.1. Glass
- 2.2. Metal
- 2.3. Plastic and Fibres
- 2.4. Stones
- 2.5. Others
-
3. End Users
- 3.1. Commercial
- 3.2. Residential
- 3.3. Others
US Facade Market Segmentation By Geography
-
1. North America
- 1.1. United States
- 1.2. Canada
- 1.3. Mexico
-
2. South America
- 2.1. Brazil
- 2.2. Argentina
- 2.3. Rest of South America
-
3. Europe
- 3.1. United Kingdom
- 3.2. Germany
- 3.3. France
- 3.4. Italy
- 3.5. Spain
- 3.6. Russia
- 3.7. Benelux
- 3.8. Nordics
- 3.9. Rest of Europe
-
4. Middle East & Africa
- 4.1. Turkey
- 4.2. Israel
- 4.3. GCC
- 4.4. North Africa
- 4.5. South Africa
- 4.6. Rest of Middle East & Africa
-
5. Asia Pacific
- 5.1. China
- 5.2. India
- 5.3. Japan
- 5.4. South Korea
- 5.5. ASEAN
- 5.6. Oceania
- 5.7. Rest of Asia Pacific

US Facade Market REPORT HIGHLIGHTS
| Aspects | Details |
|---|---|
| Study Period | 2019-2033 |
| Base Year | 2024 |
| Estimated Year | 2025 |
| Forecast Period | 2025-2033 |
| Historical Period | 2019-2024 |
| Growth Rate | CAGR of > 4.40% from 2019-2033 |
| Segmentation |
|
Table of Contents
- 1. Introduction
- 1.1. Research Scope
- 1.2. Market Segmentation
- 1.3. Research Methodology
- 1.4. Definitions and Assumptions
- 2. Executive Summary
- 2.1. Introduction
- 3. Market Dynamics
- 3.1. Introduction
- 3.2. Market Drivers
- 3.2.1. Rising Commercial Property Development; Rapid Digitalization of Commercial Construction
- 3.3. Market Restrains
- 3.3.1. Emerging Safety and Labour Issues; Rise in Cost of Construction
- 3.4. Market Trends
- 3.4.1. Glass Facades are Witnessing a Rise in Adoption
- 4. Market Factor Analysis
- 4.1. Porters Five Forces
- 4.2. Supply/Value Chain
- 4.3. PESTEL analysis
- 4.4. Market Entropy
- 4.5. Patent/Trademark Analysis
- 5. Global US Facade Market Analysis, Insights and Forecast, 2019-2031
- 5.1. Market Analysis, Insights and Forecast - by Type
- 5.1.1. Ventilated
- 5.1.2. Non-Ventilated
- 5.1.3. Others
- 5.2. Market Analysis, Insights and Forecast - by Material
- 5.2.1. Glass
- 5.2.2. Metal
- 5.2.3. Plastic and Fibres
- 5.2.4. Stones
- 5.2.5. Others
- 5.3. Market Analysis, Insights and Forecast - by End Users
- 5.3.1. Commercial
- 5.3.2. Residential
- 5.3.3. Others
- 5.4. Market Analysis, Insights and Forecast - by Region
- 5.4.1. North America
- 5.4.2. South America
- 5.4.3. Europe
- 5.4.4. Middle East & Africa
- 5.4.5. Asia Pacific
- 5.1. Market Analysis, Insights and Forecast - by Type
- 6. North America US Facade Market Analysis, Insights and Forecast, 2019-2031
- 6.1. Market Analysis, Insights and Forecast - by Type
- 6.1.1. Ventilated
- 6.1.2. Non-Ventilated
- 6.1.3. Others
- 6.2. Market Analysis, Insights and Forecast - by Material
- 6.2.1. Glass
- 6.2.2. Metal
- 6.2.3. Plastic and Fibres
- 6.2.4. Stones
- 6.2.5. Others
- 6.3. Market Analysis, Insights and Forecast - by End Users
- 6.3.1. Commercial
- 6.3.2. Residential
- 6.3.3. Others
- 6.1. Market Analysis, Insights and Forecast - by Type
- 7. South America US Facade Market Analysis, Insights and Forecast, 2019-2031
- 7.1. Market Analysis, Insights and Forecast - by Type
- 7.1.1. Ventilated
- 7.1.2. Non-Ventilated
- 7.1.3. Others
- 7.2. Market Analysis, Insights and Forecast - by Material
- 7.2.1. Glass
- 7.2.2. Metal
- 7.2.3. Plastic and Fibres
- 7.2.4. Stones
- 7.2.5. Others
- 7.3. Market Analysis, Insights and Forecast - by End Users
- 7.3.1. Commercial
- 7.3.2. Residential
- 7.3.3. Others
- 7.1. Market Analysis, Insights and Forecast - by Type
- 8. Europe US Facade Market Analysis, Insights and Forecast, 2019-2031
- 8.1. Market Analysis, Insights and Forecast - by Type
- 8.1.1. Ventilated
- 8.1.2. Non-Ventilated
- 8.1.3. Others
- 8.2. Market Analysis, Insights and Forecast - by Material
- 8.2.1. Glass
- 8.2.2. Metal
- 8.2.3. Plastic and Fibres
- 8.2.4. Stones
- 8.2.5. Others
- 8.3. Market Analysis, Insights and Forecast - by End Users
- 8.3.1. Commercial
- 8.3.2. Residential
- 8.3.3. Others
- 8.1. Market Analysis, Insights and Forecast - by Type
- 9. Middle East & Africa US Facade Market Analysis, Insights and Forecast, 2019-2031
- 9.1. Market Analysis, Insights and Forecast - by Type
- 9.1.1. Ventilated
- 9.1.2. Non-Ventilated
- 9.1.3. Others
- 9.2. Market Analysis, Insights and Forecast - by Material
- 9.2.1. Glass
- 9.2.2. Metal
- 9.2.3. Plastic and Fibres
- 9.2.4. Stones
- 9.2.5. Others
- 9.3. Market Analysis, Insights and Forecast - by End Users
- 9.3.1. Commercial
- 9.3.2. Residential
- 9.3.3. Others
- 9.1. Market Analysis, Insights and Forecast - by Type
- 10. Asia Pacific US Facade Market Analysis, Insights and Forecast, 2019-2031
- 10.1. Market Analysis, Insights and Forecast - by Type
- 10.1.1. Ventilated
- 10.1.2. Non-Ventilated
- 10.1.3. Others
- 10.2. Market Analysis, Insights and Forecast - by Material
- 10.2.1. Glass
- 10.2.2. Metal
- 10.2.3. Plastic and Fibres
- 10.2.4. Stones
- 10.2.5. Others
- 10.3. Market Analysis, Insights and Forecast - by End Users
- 10.3.1. Commercial
- 10.3.2. Residential
- 10.3.3. Others
- 10.1. Market Analysis, Insights and Forecast - by Type
- 11. Northeast US Facade Market Analysis, Insights and Forecast, 2019-2031
- 12. Southeast US Facade Market Analysis, Insights and Forecast, 2019-2031
- 13. Midwest US Facade Market Analysis, Insights and Forecast, 2019-2031
- 14. Southwest US Facade Market Analysis, Insights and Forecast, 2019-2031
- 15. West US Facade Market Analysis, Insights and Forecast, 2019-2031
- 16. Competitive Analysis
- 16.1. Global Market Share Analysis 2024
- 16.2. Company Profiles
- 16.2.1 Seele
- 16.2.1.1. Overview
- 16.2.1.2. Products
- 16.2.1.3. SWOT Analysis
- 16.2.1.4. Recent Developments
- 16.2.1.5. Financials (Based on Availability)
- 16.2.2 USG Corporation
- 16.2.2.1. Overview
- 16.2.2.2. Products
- 16.2.2.3. SWOT Analysis
- 16.2.2.4. Recent Developments
- 16.2.2.5. Financials (Based on Availability)
- 16.2.3 Permasteelisa S p A
- 16.2.3.1. Overview
- 16.2.3.2. Products
- 16.2.3.3. SWOT Analysis
- 16.2.3.4. Recent Developments
- 16.2.3.5. Financials (Based on Availability)
- 16.2.4 Reynaers Group
- 16.2.4.1. Overview
- 16.2.4.2. Products
- 16.2.4.3. SWOT Analysis
- 16.2.4.4. Recent Developments
- 16.2.4.5. Financials (Based on Availability)
- 16.2.5 Kingspan Group
- 16.2.5.1. Overview
- 16.2.5.2. Products
- 16.2.5.3. SWOT Analysis
- 16.2.5.4. Recent Developments
- 16.2.5.5. Financials (Based on Availability)
- 16.2.6 Louisiana Pacific Corporation
- 16.2.6.1. Overview
- 16.2.6.2. Products
- 16.2.6.3. SWOT Analysis
- 16.2.6.4. Recent Developments
- 16.2.6.5. Financials (Based on Availability)
- 16.2.7 Guardian Industries
- 16.2.7.1. Overview
- 16.2.7.2. Products
- 16.2.7.3. SWOT Analysis
- 16.2.7.4. Recent Developments
- 16.2.7.5. Financials (Based on Availability)
- 16.2.8 New Hudson Facades
- 16.2.8.1. Overview
- 16.2.8.2. Products
- 16.2.8.3. SWOT Analysis
- 16.2.8.4. Recent Developments
- 16.2.8.5. Financials (Based on Availability)
- 16.2.9 Georgia-Pacific L L C
- 16.2.9.1. Overview
- 16.2.9.2. Products
- 16.2.9.3. SWOT Analysis
- 16.2.9.4. Recent Developments
- 16.2.9.5. Financials (Based on Availability)
- 16.2.10 Sky Facade Inc
- 16.2.10.1. Overview
- 16.2.10.2. Products
- 16.2.10.3. SWOT Analysis
- 16.2.10.4. Recent Developments
- 16.2.10.5. Financials (Based on Availability)
- 16.2.11 Elemex® Inc **List Not Exhaustive
- 16.2.11.1. Overview
- 16.2.11.2. Products
- 16.2.11.3. SWOT Analysis
- 16.2.11.4. Recent Developments
- 16.2.11.5. Financials (Based on Availability)
- 16.2.12 Alphacladding
- 16.2.12.1. Overview
- 16.2.12.2. Products
- 16.2.12.3. SWOT Analysis
- 16.2.12.4. Recent Developments
- 16.2.12.5. Financials (Based on Availability)
- 16.2.13 GAMCO CORPORATION
- 16.2.13.1. Overview
- 16.2.13.2. Products
- 16.2.13.3. SWOT Analysis
- 16.2.13.4. Recent Developments
- 16.2.13.5. Financials (Based on Availability)
- 16.2.1 Seele
List of Figures
- Figure 1: Global US Facade Market Revenue Breakdown (Million, %) by Region 2024 & 2032
- Figure 2: United states US Facade Market Revenue (Million), by Country 2024 & 2032
- Figure 3: United states US Facade Market Revenue Share (%), by Country 2024 & 2032
- Figure 4: North America US Facade Market Revenue (Million), by Type 2024 & 2032
- Figure 5: North America US Facade Market Revenue Share (%), by Type 2024 & 2032
- Figure 6: North America US Facade Market Revenue (Million), by Material 2024 & 2032
- Figure 7: North America US Facade Market Revenue Share (%), by Material 2024 & 2032
- Figure 8: North America US Facade Market Revenue (Million), by End Users 2024 & 2032
- Figure 9: North America US Facade Market Revenue Share (%), by End Users 2024 & 2032
- Figure 10: North America US Facade Market Revenue (Million), by Country 2024 & 2032
- Figure 11: North America US Facade Market Revenue Share (%), by Country 2024 & 2032
- Figure 12: South America US Facade Market Revenue (Million), by Type 2024 & 2032
- Figure 13: South America US Facade Market Revenue Share (%), by Type 2024 & 2032
- Figure 14: South America US Facade Market Revenue (Million), by Material 2024 & 2032
- Figure 15: South America US Facade Market Revenue Share (%), by Material 2024 & 2032
- Figure 16: South America US Facade Market Revenue (Million), by End Users 2024 & 2032
- Figure 17: South America US Facade Market Revenue Share (%), by End Users 2024 & 2032
- Figure 18: South America US Facade Market Revenue (Million), by Country 2024 & 2032
- Figure 19: South America US Facade Market Revenue Share (%), by Country 2024 & 2032
- Figure 20: Europe US Facade Market Revenue (Million), by Type 2024 & 2032
- Figure 21: Europe US Facade Market Revenue Share (%), by Type 2024 & 2032
- Figure 22: Europe US Facade Market Revenue (Million), by Material 2024 & 2032
- Figure 23: Europe US Facade Market Revenue Share (%), by Material 2024 & 2032
- Figure 24: Europe US Facade Market Revenue (Million), by End Users 2024 & 2032
- Figure 25: Europe US Facade Market Revenue Share (%), by End Users 2024 & 2032
- Figure 26: Europe US Facade Market Revenue (Million), by Country 2024 & 2032
- Figure 27: Europe US Facade Market Revenue Share (%), by Country 2024 & 2032
- Figure 28: Middle East & Africa US Facade Market Revenue (Million), by Type 2024 & 2032
- Figure 29: Middle East & Africa US Facade Market Revenue Share (%), by Type 2024 & 2032
- Figure 30: Middle East & Africa US Facade Market Revenue (Million), by Material 2024 & 2032
- Figure 31: Middle East & Africa US Facade Market Revenue Share (%), by Material 2024 & 2032
- Figure 32: Middle East & Africa US Facade Market Revenue (Million), by End Users 2024 & 2032
- Figure 33: Middle East & Africa US Facade Market Revenue Share (%), by End Users 2024 & 2032
- Figure 34: Middle East & Africa US Facade Market Revenue (Million), by Country 2024 & 2032
- Figure 35: Middle East & Africa US Facade Market Revenue Share (%), by Country 2024 & 2032
- Figure 36: Asia Pacific US Facade Market Revenue (Million), by Type 2024 & 2032
- Figure 37: Asia Pacific US Facade Market Revenue Share (%), by Type 2024 & 2032
- Figure 38: Asia Pacific US Facade Market Revenue (Million), by Material 2024 & 2032
- Figure 39: Asia Pacific US Facade Market Revenue Share (%), by Material 2024 & 2032
- Figure 40: Asia Pacific US Facade Market Revenue (Million), by End Users 2024 & 2032
- Figure 41: Asia Pacific US Facade Market Revenue Share (%), by End Users 2024 & 2032
- Figure 42: Asia Pacific US Facade Market Revenue (Million), by Country 2024 & 2032
- Figure 43: Asia Pacific US Facade Market Revenue Share (%), by Country 2024 & 2032
List of Tables
- Table 1: Global US Facade Market Revenue Million Forecast, by Region 2019 & 2032
- Table 2: Global US Facade Market Revenue Million Forecast, by Type 2019 & 2032
- Table 3: Global US Facade Market Revenue Million Forecast, by Material 2019 & 2032
- Table 4: Global US Facade Market Revenue Million Forecast, by End Users 2019 & 2032
- Table 5: Global US Facade Market Revenue Million Forecast, by Region 2019 & 2032
- Table 6: Global US Facade Market Revenue Million Forecast, by Country 2019 & 2032
- Table 7: Northeast US Facade Market Revenue (Million) Forecast, by Application 2019 & 2032
- Table 8: Southeast US Facade Market Revenue (Million) Forecast, by Application 2019 & 2032
- Table 9: Midwest US Facade Market Revenue (Million) Forecast, by Application 2019 & 2032
- Table 10: Southwest US Facade Market Revenue (Million) Forecast, by Application 2019 & 2032
- Table 11: West US Facade Market Revenue (Million) Forecast, by Application 2019 & 2032
- Table 12: Global US Facade Market Revenue Million Forecast, by Type 2019 & 2032
- Table 13: Global US Facade Market Revenue Million Forecast, by Material 2019 & 2032
- Table 14: Global US Facade Market Revenue Million Forecast, by End Users 2019 & 2032
- Table 15: Global US Facade Market Revenue Million Forecast, by Country 2019 & 2032
- Table 16: United States US Facade Market Revenue (Million) Forecast, by Application 2019 & 2032
- Table 17: Canada US Facade Market Revenue (Million) Forecast, by Application 2019 & 2032
- Table 18: Mexico US Facade Market Revenue (Million) Forecast, by Application 2019 & 2032
- Table 19: Global US Facade Market Revenue Million Forecast, by Type 2019 & 2032
- Table 20: Global US Facade Market Revenue Million Forecast, by Material 2019 & 2032
- Table 21: Global US Facade Market Revenue Million Forecast, by End Users 2019 & 2032
- Table 22: Global US Facade Market Revenue Million Forecast, by Country 2019 & 2032
- Table 23: Brazil US Facade Market Revenue (Million) Forecast, by Application 2019 & 2032
- Table 24: Argentina US Facade Market Revenue (Million) Forecast, by Application 2019 & 2032
- Table 25: Rest of South America US Facade Market Revenue (Million) Forecast, by Application 2019 & 2032
- Table 26: Global US Facade Market Revenue Million Forecast, by Type 2019 & 2032
- Table 27: Global US Facade Market Revenue Million Forecast, by Material 2019 & 2032
- Table 28: Global US Facade Market Revenue Million Forecast, by End Users 2019 & 2032
- Table 29: Global US Facade Market Revenue Million Forecast, by Country 2019 & 2032
- Table 30: United Kingdom US Facade Market Revenue (Million) Forecast, by Application 2019 & 2032
- Table 31: Germany US Facade Market Revenue (Million) Forecast, by Application 2019 & 2032
- Table 32: France US Facade Market Revenue (Million) Forecast, by Application 2019 & 2032
- Table 33: Italy US Facade Market Revenue (Million) Forecast, by Application 2019 & 2032
- Table 34: Spain US Facade Market Revenue (Million) Forecast, by Application 2019 & 2032
- Table 35: Russia US Facade Market Revenue (Million) Forecast, by Application 2019 & 2032
- Table 36: Benelux US Facade Market Revenue (Million) Forecast, by Application 2019 & 2032
- Table 37: Nordics US Facade Market Revenue (Million) Forecast, by Application 2019 & 2032
- Table 38: Rest of Europe US Facade Market Revenue (Million) Forecast, by Application 2019 & 2032
- Table 39: Global US Facade Market Revenue Million Forecast, by Type 2019 & 2032
- Table 40: Global US Facade Market Revenue Million Forecast, by Material 2019 & 2032
- Table 41: Global US Facade Market Revenue Million Forecast, by End Users 2019 & 2032
- Table 42: Global US Facade Market Revenue Million Forecast, by Country 2019 & 2032
- Table 43: Turkey US Facade Market Revenue (Million) Forecast, by Application 2019 & 2032
- Table 44: Israel US Facade Market Revenue (Million) Forecast, by Application 2019 & 2032
- Table 45: GCC US Facade Market Revenue (Million) Forecast, by Application 2019 & 2032
- Table 46: North Africa US Facade Market Revenue (Million) Forecast, by Application 2019 & 2032
- Table 47: South Africa US Facade Market Revenue (Million) Forecast, by Application 2019 & 2032
- Table 48: Rest of Middle East & Africa US Facade Market Revenue (Million) Forecast, by Application 2019 & 2032
- Table 49: Global US Facade Market Revenue Million Forecast, by Type 2019 & 2032
- Table 50: Global US Facade Market Revenue Million Forecast, by Material 2019 & 2032
- Table 51: Global US Facade Market Revenue Million Forecast, by End Users 2019 & 2032
- Table 52: Global US Facade Market Revenue Million Forecast, by Country 2019 & 2032
- Table 53: China US Facade Market Revenue (Million) Forecast, by Application 2019 & 2032
- Table 54: India US Facade Market Revenue (Million) Forecast, by Application 2019 & 2032
- Table 55: Japan US Facade Market Revenue (Million) Forecast, by Application 2019 & 2032
- Table 56: South Korea US Facade Market Revenue (Million) Forecast, by Application 2019 & 2032
- Table 57: ASEAN US Facade Market Revenue (Million) Forecast, by Application 2019 & 2032
- Table 58: Oceania US Facade Market Revenue (Million) Forecast, by Application 2019 & 2032
- Table 59: Rest of Asia Pacific US Facade Market Revenue (Million) Forecast, by Application 2019 & 2032
Frequently Asked Questions
1. What is the projected Compound Annual Growth Rate (CAGR) of the US Facade Market?
The projected CAGR is approximately > 4.40%.
2. Which companies are prominent players in the US Facade Market?
Key companies in the market include Seele, USG Corporation, Permasteelisa S p A, Reynaers Group, Kingspan Group, Louisiana Pacific Corporation, Guardian Industries, New Hudson Facades, Georgia-Pacific L L C, Sky Facade Inc, Elemex® Inc **List Not Exhaustive, Alphacladding, GAMCO CORPORATION.
3. What are the main segments of the US Facade Market?
The market segments include Type, Material, End Users.
4. Can you provide details about the market size?
The market size is estimated to be USD XX Million as of 2022.
5. What are some drivers contributing to market growth?
Rising Commercial Property Development; Rapid Digitalization of Commercial Construction.
6. What are the notable trends driving market growth?
Glass Facades are Witnessing a Rise in Adoption.
7. Are there any restraints impacting market growth?
Emerging Safety and Labour Issues; Rise in Cost of Construction.
8. Can you provide examples of recent developments in the market?
November 2022: The newly renovated SmartSide® facility in Houlton, Maine, will get a second line, according to plans revealed by LP Building Solutions (LP). Following ramp-up, the second line will generate 340 million square feet annually and create more than 100 new jobs in the neighborhood.
9. What pricing options are available for accessing the report?
Pricing options include single-user, multi-user, and enterprise licenses priced at USD 3800, USD 4500, and USD 5800 respectively.
10. Is the market size provided in terms of value or volume?
The market size is provided in terms of value, measured in Million.
11. Are there any specific market keywords associated with the report?
Yes, the market keyword associated with the report is "US Facade Market," which aids in identifying and referencing the specific market segment covered.
12. How do I determine which pricing option suits my needs best?
The pricing options vary based on user requirements and access needs. Individual users may opt for single-user licenses, while businesses requiring broader access may choose multi-user or enterprise licenses for cost-effective access to the report.
13. Are there any additional resources or data provided in the US Facade Market report?
While the report offers comprehensive insights, it's advisable to review the specific contents or supplementary materials provided to ascertain if additional resources or data are available.
14. How can I stay updated on further developments or reports in the US Facade Market?
To stay informed about further developments, trends, and reports in the US Facade Market, consider subscribing to industry newsletters, following relevant companies and organizations, or regularly checking reputable industry news sources and publications.
Methodology
Step 1 - Identification of Relevant Samples Size from Population Database


Step 2 - Approaches for Defining Global Market Size (Value, Volume* & Price*)

Note*: In applicable scenarios
Step 3 - Data Sources
Primary Research
- Web Analytics
- Survey Reports
- Research Institute
- Latest Research Reports
- Opinion Leaders
Secondary Research
- Annual Reports
- White Paper
- Latest Press Release
- Industry Association
- Paid Database
- Investor Presentations

Step 4 - Data Triangulation
Involves using different sources of information in order to increase the validity of a study
These sources are likely to be stakeholders in a program - participants, other researchers, program staff, other community members, and so on.
Then we put all data in single framework & apply various statistical tools to find out the dynamic on the market.
During the analysis stage, feedback from the stakeholder groups would be compared to determine areas of agreement as well as areas of divergence


