
Key Insights
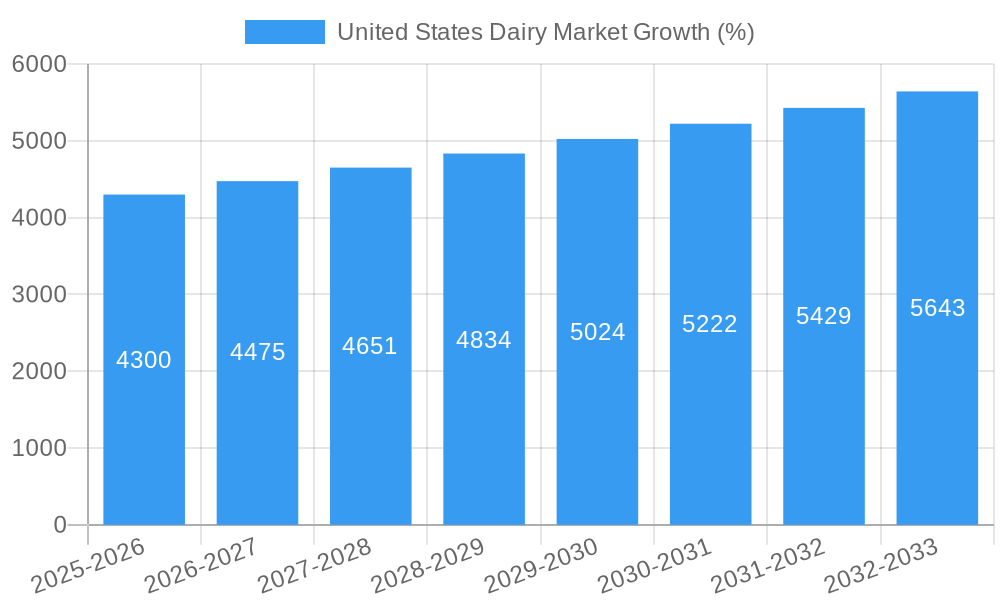
The United States dairy market, a significant segment of the global dairy industry, is experiencing steady growth, projected at a compound annual growth rate (CAGR) of 4.30% from 2025 to 2033. This growth is fueled by several key factors. Increased consumer demand for dairy products, driven by health and wellness trends emphasizing protein intake and calcium-rich diets, is a primary driver. The rising popularity of dairy-based functional foods and beverages, such as yogurt with added probiotics or fortified milk, further contributes to market expansion. Innovation within the dairy industry, encompassing the development of new product formats, flavors, and healthier options (e.g., reduced-fat or organic dairy), also plays a crucial role in market expansion. Furthermore, the increasing penetration of e-commerce and online grocery delivery services offers enhanced accessibility to dairy products, boosting sales across various distribution channels including off-trade retail (supermarkets, grocery stores) and on-trade (restaurants, cafes). While price fluctuations in milk production and potential supply chain disruptions present challenges, the overall market outlook remains positive, particularly within the butter segment which benefits from its versatile use in both household cooking and the food services sector. The competitive landscape, featuring established players such as Land O'Lakes Inc., Nestlé SA, and Kraft Heinz, alongside regional and specialty dairy producers, fosters continuous innovation and product diversification.
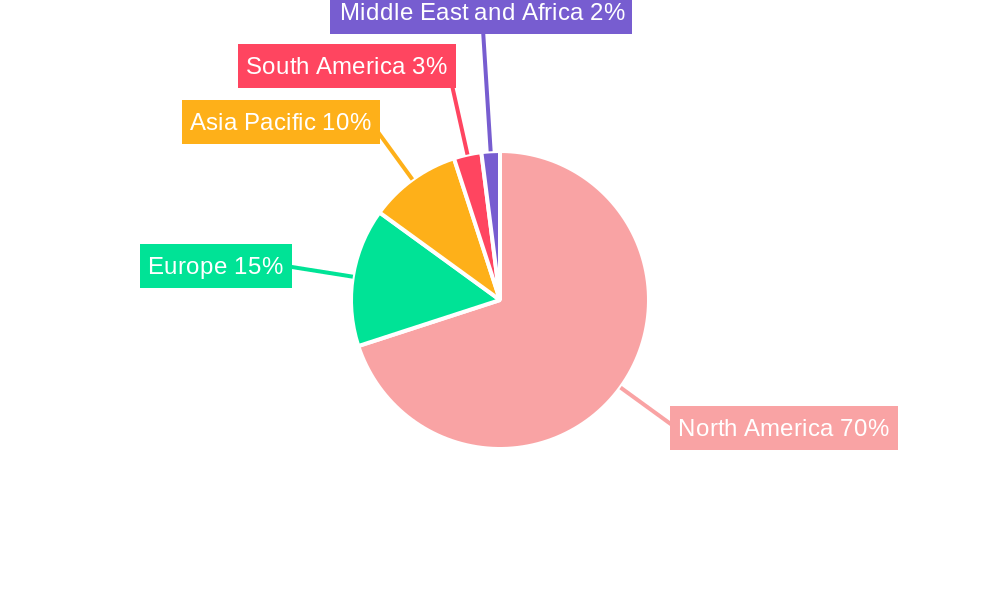
Growth within specific segments, such as butter, is likely outpacing the overall market average due to increased consumer preference for natural and high-quality ingredients in cooking and baking. The off-trade distribution channel, dominated by supermarkets and grocery stores, remains the largest segment, benefiting from consumers’ routine purchasing habits. However, the on-trade segment, representing restaurants and food service establishments, is anticipated to demonstrate considerable growth given the increasing demand for dairy-based ingredients in various culinary applications. Regional variations exist, with North America expected to retain a substantial market share due to the region's high per capita consumption of dairy products and robust domestic production. However, growth opportunities also exist in other regions, particularly in Asia Pacific, driven by rising disposable incomes and changing dietary preferences. The long-term forecast for the U.S. dairy market indicates sustained growth, driven by consumer demand, technological advancements, and diversification of product offerings.

United States Dairy Market: A Comprehensive Market Report (2019-2033)
This in-depth report provides a comprehensive analysis of the United States dairy market, encompassing market dynamics, growth trends, regional segmentation, product landscape, key players, and future outlook. The study period covers 2019-2033, with a base year of 2025 and a forecast period of 2025-2033. The report is an essential resource for industry professionals, investors, and stakeholders seeking actionable insights into this dynamic market. The report delves into parent markets (dairy products) and child markets (e.g., butter, cheese) to provide a granular understanding of market segments like Off-Trade distribution channels and the On-Trade segment encompassing warehouse clubs and gas stations.
United States Dairy Market Dynamics & Structure
The U.S. dairy market is characterized by a complex interplay of factors influencing its structure and growth. Market concentration is moderately high, with a few large players like Land O'Lakes Inc, Nestlé SA, and The Kraft Heinz Company holding significant market share (estimated at xx%). However, a large number of smaller regional players and cooperatives also contribute significantly to the overall market volume. Technological innovation, particularly in processing and packaging, is a key driver, enabling extended shelf life and enhanced product quality. Stringent regulatory frameworks governing food safety and labeling impact operational costs and product development. The market faces competition from plant-based alternatives, though dairy products still dominate due to established consumer preference and cultural significance. End-user demographics, with a focus on shifting consumer preferences towards healthier and more convenient options, are shaping product development strategies. M&A activity has been significant in recent years, with deal volumes estimated at xx million USD in the historical period, reflecting consolidation and strategic expansion within the sector.
- Market Concentration: Moderately high, with top players holding xx% market share.
- Technological Innovation: Focus on extended shelf-life products and enhanced processing.
- Regulatory Framework: Stringent food safety and labeling regulations.
- Competitive Substitutes: Growing plant-based alternatives pose a competitive challenge.
- End-User Demographics: Shifting consumer preferences towards healthier and convenient options.
- M&A Activity: Significant consolidation and expansion through mergers and acquisitions (xx million USD in 2019-2024).
United States Dairy Market Growth Trends & Insights
The U.S. dairy market experienced steady growth during the historical period (2019-2024), with a CAGR of xx%. Market size is projected to reach xx million USD in 2025 and further expand to xx million USD by 2033, exhibiting a CAGR of xx% during the forecast period. This growth is fueled by several factors including increasing consumer demand, particularly for value-added products like organic and specialty dairy items. Technological disruptions, such as advancements in precision farming and improved processing techniques, enhance efficiency and product quality. Consumer behavior is shifting towards healthier options, influencing product innovation and marketing strategies. Market penetration of value-added dairy products is steadily increasing, driven by rising disposable incomes and changing lifestyles. Further analysis reveals specific trends in butter consumption, which is showing a CAGR of xx% from 2019 to 2024, attributed to changing dietary habits and growing popularity in baking. Detailed market segment analysis, including butter's performance across different distribution channels (Off-Trade and On-Trade), provide a clear picture of evolving consumer preferences.
Dominant Regions, Countries, or Segments in United States Dairy Market
The Midwest region remains a dominant force in the U.S. dairy market, holding a substantial share ([Insert updated percentage here]%) of total production and consumption. This leadership stems from favorable climate conditions, a robust agricultural infrastructure, and a high concentration of dairy farms. California and Wisconsin continue to be significant contributors to the national market volume. Analyzing market segments reveals strong growth potential in several areas. For example, Butter within the Off-Trade distribution channel (grocery stores, supermarkets) exhibits exceptional growth driven by consumer demand for convenient, readily available products. Conversely, the On-Trade segment (including warehouse clubs, gas stations, and convenience stores) demonstrates a Compound Annual Growth Rate (CAGR) of [Insert updated CAGR here]% during 2019-2024, reflecting a clear trend towards dairy product consumption in non-traditional retail environments. Furthermore, the increasing popularity of [mention specific dairy product segments showing growth, e.g., organic dairy, lactose-free options, etc.] is reshaping the market landscape.
- Midwest Region: Maintains dominance due to favorable climate, established infrastructure, and a high concentration of dairy farms.
- California & Wisconsin: Continue to be key contributors to national dairy production and market share.
- Off-Trade Butter: Sustained growth fueled by consumer preference for readily accessible products in conventional retail outlets.
- On-Trade Segment: Displays strong growth, indicating increasing acceptance of dairy products in diverse retail settings.
- [Add new segment here, e.g., Organic Dairy/Specialty Dairy]: [Describe the growth and significance of this segment]
United States Dairy Market Product Landscape
The U.S. dairy market showcases a diverse range of products, from traditional staples like milk and cheese to a wide array of value-added options including yogurt, butter, ice cream, and an expanding selection of specialty cheeses. Innovation within the sector is heavily focused on extending shelf life, enhancing nutritional profiles, and catering to evolving consumer dietary needs and preferences. This includes a growing demand for organic, lactose-free, plant-based blends, and other specialized dairy products. Key performance indicators for dairy products encompass taste, texture, nutritional content, and shelf stability. Effective marketing strategies leverage unique selling propositions such as certifications (organic, grass-fed, sustainably sourced), functional benefits (probiotics, added vitamins), and convenient packaging (single-serving portions, family-sized options). Technological advancements in processing and packaging technologies are pivotal in extending shelf life, minimizing waste, and enhancing product quality.
Key Drivers, Barriers & Challenges in United States Dairy Market
Key Drivers: The market's growth is propelled by several factors, including rising consumer demand (especially for value-added and specialty dairy products), continuous technological advancements improving processing and packaging efficiency, and increases in disposable incomes. Furthermore, government support for dairy farmers through subsidies and various programs contributes to market stability and sustained production capacity. The growing awareness of the nutritional benefits of dairy is also a significant driver.
Challenges: The dairy industry faces considerable challenges, including volatile milk prices, escalating input costs (feed, labor, energy), stringent regulatory compliance requirements, and intensifying competition from plant-based alternatives. Supply chain disruptions, as highlighted by a [Insert updated percentage here]% increase in transportation costs in 2022, continue to impact profitability and product availability. Climate change and its effects on feed production also pose a significant concern.
Emerging Opportunities in United States Dairy Market
Emerging opportunities lie in expanding into niche markets, such as organic and specialty dairy products, catering to health-conscious consumers. Innovative applications of dairy ingredients in functional foods and beverages represent a significant growth area. Developing dairy products tailored to specific dietary restrictions (e.g., lactose-free, vegan blends) offers further market expansion potential.
Growth Accelerators in the United States Dairy Market Industry
Long-term growth will be fueled by strategic partnerships between dairy producers and food manufacturers to develop innovative products and expand market reach. Technological breakthroughs in precision farming and sustainable dairy practices will contribute to increased efficiency and reduced environmental impact. Expanding into international markets and tapping into emerging economies present further growth potential.
Key Players Shaping the United States Dairy Market Market
- Land O'Lakes Inc
- Nestlé SA
- The Kraft Heinz Company
- Schreiber Foods Inc
- Conagra Brands Inc
- Danone SA
- California Dairies Inc
- Dairy Farmers of America Inc
- Continental Dairy Facilities LLC
- Groupe Lactalis
- Froneri International Limited
- Prairie Farms Dairy Inc
Notable Milestones in United States Dairy Market Sector
- December 2022: Lactalis Canada acquired Kraft Heinz's Grated Cheese business in Canada, expanding its product portfolio and market reach in the ambient category.
- November 2022: The Kraft Heinz Company launched the Philly Handbag cheesecake kit, introducing a new product format into the market.
- August 2022: Dairy Farmers of America acquired two shelf-extended facilities of SmithFoods, aiming to capitalize on the growing demand for extended shelf-life products.
- [Add new milestone here]: [Describe a recent significant event in the US dairy market]
In-Depth United States Dairy Market Market Outlook
The U.S. dairy market possesses significant long-term growth potential, driven by ongoing innovation, evolving consumer preferences, and increasing global demand for high-quality dairy products. Strategic investments in advanced technologies and sustainable agricultural practices will be crucial for maintaining competitiveness and driving future growth. The market is well-positioned to capitalize on the rising demand for convenient, healthy, and value-added dairy options. Companies that successfully explore niche markets and develop innovative product offerings, emphasizing sustainability and transparency, are expected to capture significant market share and enhance profitability in the coming years. The focus on traceability and origin stories is also becoming increasingly important to consumers.
United States Dairy Market Segmentation
-
1. Category
-
1.1. Butter
-
1.1.1. By Product Type
- 1.1.1.1. Cultured Butter
- 1.1.1.2. Uncultured Butter
-
1.1.1. By Product Type
-
1.2. Cheese
- 1.2.1. Natural Cheese
- 1.2.2. Processed Cheese
-
1.3. Cream
- 1.3.1. Double Cream
- 1.3.2. Single Cream
- 1.3.3. Whipping Cream
- 1.3.4. Others
-
1.4. Dairy Desserts
- 1.4.1. Cheesecakes
- 1.4.2. Frozen Desserts
- 1.4.3. Ice Cream
- 1.4.4. Mousses
-
1.5. Milk
- 1.5.1. Condensed milk
- 1.5.2. Flavored Milk
- 1.5.3. Fresh Milk
- 1.5.4. Powdered Milk
- 1.5.5. UHT Milk
- 1.6. Sour Milk Drinks
-
1.7. Yogurt
- 1.7.1. Flavored Yogurt
- 1.7.2. Unflavored Yogurt
-
1.1. Butter
-
2. Distribution Channel
-
2.1. Off-Trade
- 2.1.1. Convenience Stores
- 2.1.2. Online Retail
- 2.1.3. Specialist Retailers
- 2.1.4. Supermarkets and Hypermarkets
- 2.1.5. Others (Warehouse clubs, gas stations, etc.)
- 2.2. On-Trade
-
2.1. Off-Trade
United States Dairy Market Segmentation By Geography
- 1. United States
United States Dairy Market REPORT HIGHLIGHTS
| Aspects | Details |
|---|---|
| Study Period | 2019-2033 |
| Base Year | 2024 |
| Estimated Year | 2025 |
| Forecast Period | 2025-2033 |
| Historical Period | 2019-2024 |
| Growth Rate | CAGR of 4.30% from 2019-2033 |
| Segmentation |
|
Table of Contents
- 1. Introduction
- 1.1. Research Scope
- 1.2. Market Segmentation
- 1.3. Research Methodology
- 1.4. Definitions and Assumptions
- 2. Executive Summary
- 2.1. Introduction
- 3. Market Dynamics
- 3.1. Introduction
- 3.2. Market Drivers
- 3.2.1. Growing Demand for Cocoa Butter Equivalents Among Food Manufacturers; Rising Application in Food Industry
- 3.3. Market Restrains
- 3.3.1. Health Concerns Pertaining to the Excessive Consumption of Fats and Oils
- 3.4. Market Trends
- 3.4.1. OTHER KEY INDUSTRY TRENDS COVERED IN THE REPORT
- 4. Market Factor Analysis
- 4.1. Porters Five Forces
- 4.2. Supply/Value Chain
- 4.3. PESTEL analysis
- 4.4. Market Entropy
- 4.5. Patent/Trademark Analysis
- 5. United States Dairy Market Analysis, Insights and Forecast, 2019-2031
- 5.1. Market Analysis, Insights and Forecast - by Category
- 5.1.1. Butter
- 5.1.1.1. By Product Type
- 5.1.1.1.1. Cultured Butter
- 5.1.1.1.2. Uncultured Butter
- 5.1.1.1. By Product Type
- 5.1.2. Cheese
- 5.1.2.1. Natural Cheese
- 5.1.2.2. Processed Cheese
- 5.1.3. Cream
- 5.1.3.1. Double Cream
- 5.1.3.2. Single Cream
- 5.1.3.3. Whipping Cream
- 5.1.3.4. Others
- 5.1.4. Dairy Desserts
- 5.1.4.1. Cheesecakes
- 5.1.4.2. Frozen Desserts
- 5.1.4.3. Ice Cream
- 5.1.4.4. Mousses
- 5.1.5. Milk
- 5.1.5.1. Condensed milk
- 5.1.5.2. Flavored Milk
- 5.1.5.3. Fresh Milk
- 5.1.5.4. Powdered Milk
- 5.1.5.5. UHT Milk
- 5.1.6. Sour Milk Drinks
- 5.1.7. Yogurt
- 5.1.7.1. Flavored Yogurt
- 5.1.7.2. Unflavored Yogurt
- 5.1.1. Butter
- 5.2. Market Analysis, Insights and Forecast - by Distribution Channel
- 5.2.1. Off-Trade
- 5.2.1.1. Convenience Stores
- 5.2.1.2. Online Retail
- 5.2.1.3. Specialist Retailers
- 5.2.1.4. Supermarkets and Hypermarkets
- 5.2.1.5. Others (Warehouse clubs, gas stations, etc.)
- 5.2.2. On-Trade
- 5.2.1. Off-Trade
- 5.3. Market Analysis, Insights and Forecast - by Region
- 5.3.1. United States
- 5.1. Market Analysis, Insights and Forecast - by Category
- 6. North America United States Dairy Market Analysis, Insights and Forecast, 2019-2031
- 6.1. Market Analysis, Insights and Forecast - By Country/Sub-region
- 6.1.1 United States
- 6.1.2 Canada
- 6.1.3 Mexico
- 6.1.4 Rest of North America
- 7. Europe United States Dairy Market Analysis, Insights and Forecast, 2019-2031
- 7.1. Market Analysis, Insights and Forecast - By Country/Sub-region
- 7.1.1 United Kingdom
- 7.1.2 Germany
- 7.1.3 France
- 7.1.4 Russia
- 7.1.5 Italy
- 7.1.6 Spain
- 7.1.7 Rest of Europe
- 8. Asia Pacific United States Dairy Market Analysis, Insights and Forecast, 2019-2031
- 8.1. Market Analysis, Insights and Forecast - By Country/Sub-region
- 8.1.1 India
- 8.1.2 China
- 8.1.3 Japan
- 8.1.4 Australia
- 8.1.5 Rest of Asia Pacific
- 9. South America United States Dairy Market Analysis, Insights and Forecast, 2019-2031
- 9.1. Market Analysis, Insights and Forecast - By Country/Sub-region
- 9.1.1 Brazil
- 9.1.2 Argentina
- 9.1.3 Rest of South America
- 10. Middle East and Africa United States Dairy Market Analysis, Insights and Forecast, 2019-2031
- 10.1. Market Analysis, Insights and Forecast - By Country/Sub-region
- 10.1.1 South Africa
- 10.1.2 Saudi Arabia
- 10.1.3 Rest of Middle East and Africa
- 11. Competitive Analysis
- 11.1. Market Share Analysis 2024
- 11.2. Company Profiles
- 11.2.1 Land O'Lakes Inc
- 11.2.1.1. Overview
- 11.2.1.2. Products
- 11.2.1.3. SWOT Analysis
- 11.2.1.4. Recent Developments
- 11.2.1.5. Financials (Based on Availability)
- 11.2.2 Nestlé SA
- 11.2.2.1. Overview
- 11.2.2.2. Products
- 11.2.2.3. SWOT Analysis
- 11.2.2.4. Recent Developments
- 11.2.2.5. Financials (Based on Availability)
- 11.2.3 The Kraft Heinz Compan
- 11.2.3.1. Overview
- 11.2.3.2. Products
- 11.2.3.3. SWOT Analysis
- 11.2.3.4. Recent Developments
- 11.2.3.5. Financials (Based on Availability)
- 11.2.4 Schreiber Foods Inc
- 11.2.4.1. Overview
- 11.2.4.2. Products
- 11.2.4.3. SWOT Analysis
- 11.2.4.4. Recent Developments
- 11.2.4.5. Financials (Based on Availability)
- 11.2.5 Conagra Brands Inc
- 11.2.5.1. Overview
- 11.2.5.2. Products
- 11.2.5.3. SWOT Analysis
- 11.2.5.4. Recent Developments
- 11.2.5.5. Financials (Based on Availability)
- 11.2.6 Danone SA
- 11.2.6.1. Overview
- 11.2.6.2. Products
- 11.2.6.3. SWOT Analysis
- 11.2.6.4. Recent Developments
- 11.2.6.5. Financials (Based on Availability)
- 11.2.7 California Dairies Inc
- 11.2.7.1. Overview
- 11.2.7.2. Products
- 11.2.7.3. SWOT Analysis
- 11.2.7.4. Recent Developments
- 11.2.7.5. Financials (Based on Availability)
- 11.2.8 Dairy Farmers of America Inc
- 11.2.8.1. Overview
- 11.2.8.2. Products
- 11.2.8.3. SWOT Analysis
- 11.2.8.4. Recent Developments
- 11.2.8.5. Financials (Based on Availability)
- 11.2.9 Continental Dairy Facilities LLC
- 11.2.9.1. Overview
- 11.2.9.2. Products
- 11.2.9.3. SWOT Analysis
- 11.2.9.4. Recent Developments
- 11.2.9.5. Financials (Based on Availability)
- 11.2.10 Groupe Lactalis
- 11.2.10.1. Overview
- 11.2.10.2. Products
- 11.2.10.3. SWOT Analysis
- 11.2.10.4. Recent Developments
- 11.2.10.5. Financials (Based on Availability)
- 11.2.11 Froneri International Limited
- 11.2.11.1. Overview
- 11.2.11.2. Products
- 11.2.11.3. SWOT Analysis
- 11.2.11.4. Recent Developments
- 11.2.11.5. Financials (Based on Availability)
- 11.2.12 Prairie Farms Dairy Inc
- 11.2.12.1. Overview
- 11.2.12.2. Products
- 11.2.12.3. SWOT Analysis
- 11.2.12.4. Recent Developments
- 11.2.12.5. Financials (Based on Availability)
- 11.2.1 Land O'Lakes Inc
List of Figures
- Figure 1: United States Dairy Market Revenue Breakdown (Million, %) by Product 2024 & 2032
- Figure 2: United States Dairy Market Share (%) by Company 2024
List of Tables
- Table 1: United States Dairy Market Revenue Million Forecast, by Region 2019 & 2032
- Table 2: United States Dairy Market Revenue Million Forecast, by Category 2019 & 2032
- Table 3: United States Dairy Market Revenue Million Forecast, by Distribution Channel 2019 & 2032
- Table 4: United States Dairy Market Revenue Million Forecast, by Region 2019 & 2032
- Table 5: United States Dairy Market Revenue Million Forecast, by Country 2019 & 2032
- Table 6: United States United States Dairy Market Revenue (Million) Forecast, by Application 2019 & 2032
- Table 7: Canada United States Dairy Market Revenue (Million) Forecast, by Application 2019 & 2032
- Table 8: Mexico United States Dairy Market Revenue (Million) Forecast, by Application 2019 & 2032
- Table 9: Rest of North America United States Dairy Market Revenue (Million) Forecast, by Application 2019 & 2032
- Table 10: United States Dairy Market Revenue Million Forecast, by Country 2019 & 2032
- Table 11: United Kingdom United States Dairy Market Revenue (Million) Forecast, by Application 2019 & 2032
- Table 12: Germany United States Dairy Market Revenue (Million) Forecast, by Application 2019 & 2032
- Table 13: France United States Dairy Market Revenue (Million) Forecast, by Application 2019 & 2032
- Table 14: Russia United States Dairy Market Revenue (Million) Forecast, by Application 2019 & 2032
- Table 15: Italy United States Dairy Market Revenue (Million) Forecast, by Application 2019 & 2032
- Table 16: Spain United States Dairy Market Revenue (Million) Forecast, by Application 2019 & 2032
- Table 17: Rest of Europe United States Dairy Market Revenue (Million) Forecast, by Application 2019 & 2032
- Table 18: United States Dairy Market Revenue Million Forecast, by Country 2019 & 2032
- Table 19: India United States Dairy Market Revenue (Million) Forecast, by Application 2019 & 2032
- Table 20: China United States Dairy Market Revenue (Million) Forecast, by Application 2019 & 2032
- Table 21: Japan United States Dairy Market Revenue (Million) Forecast, by Application 2019 & 2032
- Table 22: Australia United States Dairy Market Revenue (Million) Forecast, by Application 2019 & 2032
- Table 23: Rest of Asia Pacific United States Dairy Market Revenue (Million) Forecast, by Application 2019 & 2032
- Table 24: United States Dairy Market Revenue Million Forecast, by Country 2019 & 2032
- Table 25: Brazil United States Dairy Market Revenue (Million) Forecast, by Application 2019 & 2032
- Table 26: Argentina United States Dairy Market Revenue (Million) Forecast, by Application 2019 & 2032
- Table 27: Rest of South America United States Dairy Market Revenue (Million) Forecast, by Application 2019 & 2032
- Table 28: United States Dairy Market Revenue Million Forecast, by Country 2019 & 2032
- Table 29: South Africa United States Dairy Market Revenue (Million) Forecast, by Application 2019 & 2032
- Table 30: Saudi Arabia United States Dairy Market Revenue (Million) Forecast, by Application 2019 & 2032
- Table 31: Rest of Middle East and Africa United States Dairy Market Revenue (Million) Forecast, by Application 2019 & 2032
- Table 32: United States Dairy Market Revenue Million Forecast, by Category 2019 & 2032
- Table 33: United States Dairy Market Revenue Million Forecast, by Distribution Channel 2019 & 2032
- Table 34: United States Dairy Market Revenue Million Forecast, by Country 2019 & 2032
Frequently Asked Questions
1. What is the projected Compound Annual Growth Rate (CAGR) of the United States Dairy Market?
The projected CAGR is approximately 4.30%.
2. Which companies are prominent players in the United States Dairy Market?
Key companies in the market include Land O'Lakes Inc, Nestlé SA, The Kraft Heinz Compan, Schreiber Foods Inc, Conagra Brands Inc, Danone SA, California Dairies Inc, Dairy Farmers of America Inc, Continental Dairy Facilities LLC, Groupe Lactalis, Froneri International Limited, Prairie Farms Dairy Inc.
3. What are the main segments of the United States Dairy Market?
The market segments include Category, Distribution Channel.
4. Can you provide details about the market size?
The market size is estimated to be USD XX Million as of 2022.
5. What are some drivers contributing to market growth?
Growing Demand for Cocoa Butter Equivalents Among Food Manufacturers; Rising Application in Food Industry.
6. What are the notable trends driving market growth?
OTHER KEY INDUSTRY TRENDS COVERED IN THE REPORT.
7. Are there any restraints impacting market growth?
Health Concerns Pertaining to the Excessive Consumption of Fats and Oils.
8. Can you provide examples of recent developments in the market?
December 2022: Lactalis Canada acquired Kraft Heinz's Grated Cheese business in Canada, marking its entry into the ambient category.November 2022: The Kraft Heinz Company launched the cheesecake kit Philly Handbag.August 2022: Dairy Farmers of America acquired two shelf-extended facilities of SmithFoods. The strategy of this acquisition was to assist the corporation in capitalizing on the market's growing demand for products with extended shelf lives.
9. What pricing options are available for accessing the report?
Pricing options include single-user, multi-user, and enterprise licenses priced at USD 3800, USD 4500, and USD 5800 respectively.
10. Is the market size provided in terms of value or volume?
The market size is provided in terms of value, measured in Million.
11. Are there any specific market keywords associated with the report?
Yes, the market keyword associated with the report is "United States Dairy Market," which aids in identifying and referencing the specific market segment covered.
12. How do I determine which pricing option suits my needs best?
The pricing options vary based on user requirements and access needs. Individual users may opt for single-user licenses, while businesses requiring broader access may choose multi-user or enterprise licenses for cost-effective access to the report.
13. Are there any additional resources or data provided in the United States Dairy Market report?
While the report offers comprehensive insights, it's advisable to review the specific contents or supplementary materials provided to ascertain if additional resources or data are available.
14. How can I stay updated on further developments or reports in the United States Dairy Market?
To stay informed about further developments, trends, and reports in the United States Dairy Market, consider subscribing to industry newsletters, following relevant companies and organizations, or regularly checking reputable industry news sources and publications.
Methodology
Step 1 - Identification of Relevant Samples Size from Population Database


Step 2 - Approaches for Defining Global Market Size (Value, Volume* & Price*)

Note*: In applicable scenarios
Step 3 - Data Sources
Primary Research
- Web Analytics
- Survey Reports
- Research Institute
- Latest Research Reports
- Opinion Leaders
Secondary Research
- Annual Reports
- White Paper
- Latest Press Release
- Industry Association
- Paid Database
- Investor Presentations

Step 4 - Data Triangulation
Involves using different sources of information in order to increase the validity of a study
These sources are likely to be stakeholders in a program - participants, other researchers, program staff, other community members, and so on.
Then we put all data in single framework & apply various statistical tools to find out the dynamic on the market.
During the analysis stage, feedback from the stakeholder groups would be compared to determine areas of agreement as well as areas of divergence


