
Key Insights
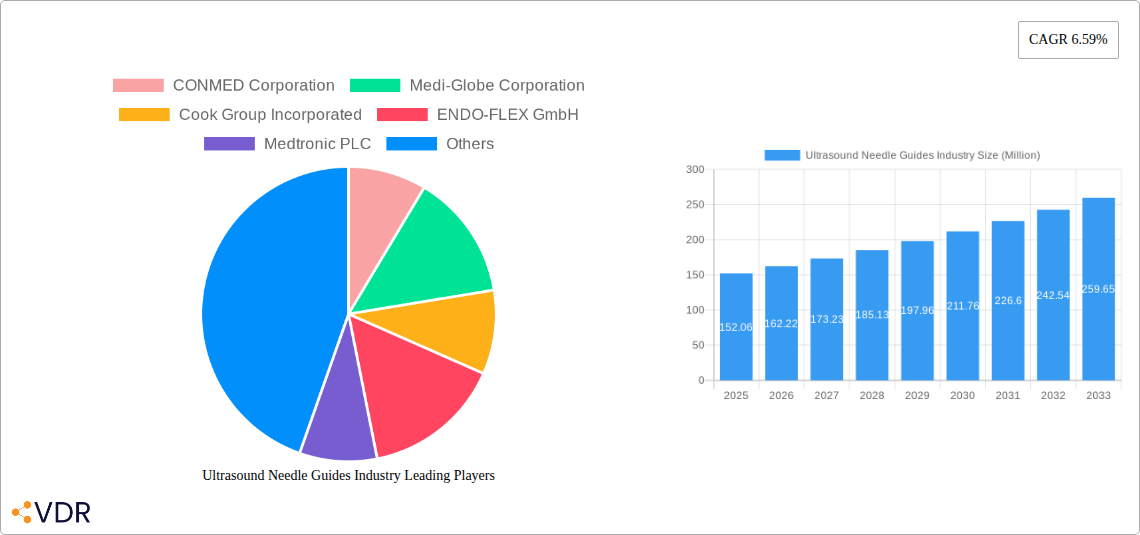
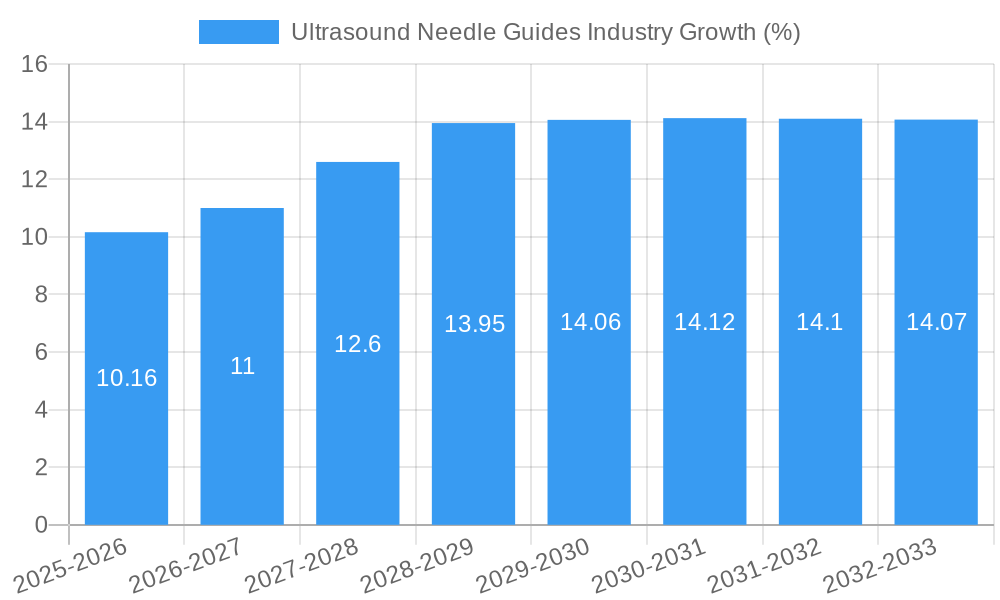
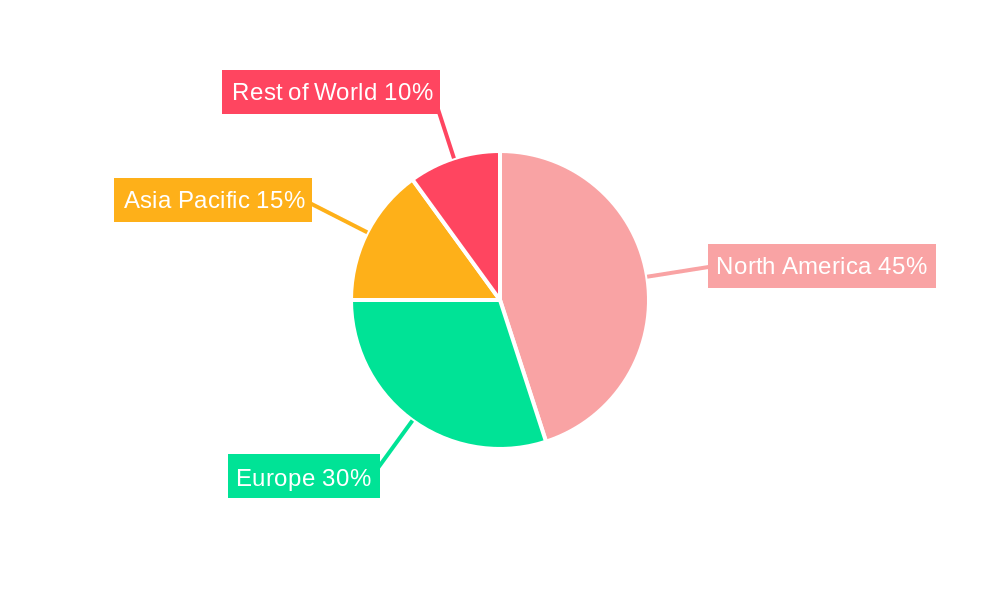
The global Ultrasound Needle Guides market, valued at $152.06 million in 2025, is projected to experience robust growth, driven by a compound annual growth rate (CAGR) of 6.59% from 2025 to 2033. This expansion is fueled by several key factors. The increasing prevalence of minimally invasive procedures, particularly in oncology and gastroenterology, significantly boosts demand for precise and efficient needle guidance systems. Technological advancements, such as improved imaging capabilities and the development of smaller, more versatile needles, further enhance the market's trajectory. The rising adoption of ultrasound-guided biopsies and aspirations, coupled with a growing aging population requiring more complex medical interventions, contributes to the market's upward trend. Furthermore, the expanding healthcare infrastructure in developing economies presents lucrative growth opportunities for manufacturers of ultrasound needle guides. However, factors like the high cost of advanced systems and the potential risk associated with minimally invasive procedures could act as market restraints. The segmentation of the market reveals strong demand across various product types, including aspiration and biopsy needles, and applications such as bronchial and enteral EUS procedures. Hospitals and ambulatory surgical centers constitute the primary end-users, driving the bulk of market revenue. North America currently holds a significant market share, owing to its advanced healthcare infrastructure and high adoption rates of minimally invasive techniques. However, Asia Pacific is expected to witness the fastest growth in the forecast period, fueled by increasing healthcare spending and rising awareness of minimally invasive procedures.
Competitive dynamics within the Ultrasound Needle Guides market are characterized by the presence of established players like CONMED Corporation, Medtronic PLC, and Boston Scientific Corporation, alongside smaller, specialized manufacturers. These companies are actively engaged in research and development to improve existing technologies and expand their product portfolios. Strategic partnerships, acquisitions, and technological innovations are anticipated to shape the competitive landscape in the coming years. The market is witnessing a shift towards technologically superior systems with enhanced features such as real-time imaging and improved ergonomics. This ongoing innovation, coupled with a focus on improved patient outcomes, will further drive market growth in the years to come. The projected market size for 2033 can be estimated by applying the CAGR to the 2025 value; however, this would require complex calculations and is beyond the scope of this analysis.
Ultrasound Needle Guides Industry Market Report: 2019-2033
This comprehensive report provides a detailed analysis of the Ultrasound Needle Guides market, encompassing market dynamics, growth trends, regional dominance, product landscape, key players, and future outlook. The study period covers 2019-2033, with 2025 as the base and estimated year. The market is segmented by product (Aspiration Needles, Biopsy Needles), application (Bronchial EUS Needles, Enteral EUS Needles), and end-user (Hospitals, Ambulatory Surgical Centers, Other End Users). The report values are presented in million units.
Ultrasound Needle Guides Industry Market Dynamics & Structure
The Ultrasound Needle Guides market, a sub-segment of the larger Medical Devices market, is characterized by moderate concentration with key players holding significant market share. Technological innovation, particularly in needle design and materials, is a primary growth driver. Stringent regulatory frameworks, including FDA approvals in the US and CE markings in Europe, significantly influence market entry and product development. Competitive substitutes, such as traditional biopsy techniques, exert pressure on market growth. The end-user demographic skews towards hospitals and ambulatory surgical centers, reflecting the specialized nature of the procedures. M&A activity within the sector has been relatively low in recent years, with xx deals recorded between 2019 and 2024, representing a xx% market share consolidation.
- Market Concentration: Moderately concentrated, with top 5 players holding approximately xx% market share in 2024.
- Technological Innovation: Focus on improved precision, reduced trauma, and enhanced sample quality.
- Regulatory Landscape: Stringent regulatory approvals needed for market entry.
- Competitive Substitutes: Traditional biopsy techniques pose a competitive threat.
- End-User Demographics: Hospitals and ASCs represent the primary end-users.
- M&A Trends: Relatively low M&A activity observed recently (xx deals between 2019-2024).
Ultrasound Needle Guides Industry Growth Trends & Insights
The Ultrasound Needle Guides market experienced steady growth during the historical period (2019-2024), expanding from xx million units in 2019 to xx million units in 2024, at a CAGR of xx%. This growth is attributed to factors such as the rising prevalence of diseases requiring minimally invasive procedures, increasing adoption of advanced imaging technologies, and growing demand for improved diagnostic accuracy. Technological disruptions, such as the introduction of automated and robotic-assisted needle guidance systems, are expected to further propel market expansion. Consumer behavior shifts towards minimally invasive procedures and preference for advanced diagnostic tools are also key drivers. The market is projected to reach xx million units by 2033, with a forecasted CAGR of xx% during 2025-2033. Market penetration in key regions remains relatively low, indicating significant future growth potential.
Dominant Regions, Countries, or Segments in Ultrasound Needle Guides Industry
North America currently holds the largest market share in the Ultrasound Needle Guides industry, driven by high healthcare expenditure, advanced medical infrastructure, and early adoption of new technologies. Within product segments, Biopsy Needles represent a larger market than Aspiration Needles, reflecting the broader applications of biopsy procedures. Hospitals dominate the end-user segment due to their advanced facilities and expertise.
- Key Drivers in North America: High healthcare expenditure, robust healthcare infrastructure, and early adoption of advanced technologies.
- Product Segment Dominance: Biopsy Needles hold a larger market share than Aspiration Needles.
- End-User Segment Dominance: Hospitals represent the largest end-user segment.
- Growth Potential: Significant untapped potential exists in emerging economies like Asia-Pacific and Latin America, driven by rising healthcare infrastructure and increasing affordability of minimally invasive procedures.
Ultrasound Needle Guides Industry Product Landscape
The Ultrasound Needle Guides market offers a diverse range of products, including aspiration needles and biopsy needles, each designed for specific applications and procedures. Recent advancements include the development of smaller, more precise needles with improved control and reduced trauma. Technological advancements such as automated needle guidance systems, improved materials, and enhanced visualization capabilities are constantly shaping the product landscape. Unique selling propositions often focus on ease of use, enhanced precision, and reduced procedure time.
Key Drivers, Barriers & Challenges in Ultrasound Needle Guides Industry
Key Drivers:
- Increasing prevalence of diseases requiring minimally invasive procedures.
- Growing demand for improved diagnostic accuracy.
- Technological advancements leading to better precision and reduced trauma.
- Rising healthcare expenditure in developed and developing countries.
Key Challenges & Restraints:
- High cost of advanced needle guidance systems can limit market penetration in certain regions.
- Stringent regulatory approvals can delay product launches and market entry.
- Potential complications and risks associated with minimally invasive procedures pose a challenge.
- Intense competition among established and emerging players.
Emerging Opportunities in Ultrasound Needle Guides Industry
Emerging opportunities exist in the development of innovative needle designs and materials, integration with advanced imaging technologies, and expansion into untapped markets in developing economies. Miniaturization of needles, improved visualization techniques, and the development of disposable needles offer further growth prospects. The growing demand for personalized medicine and point-of-care diagnostics presents new avenues for innovation.
Growth Accelerators in the Ultrasound Needle Guides Industry
Technological breakthroughs, strategic collaborations between device manufacturers and healthcare providers, and expansion into new geographic markets will be critical in driving long-term growth. Focus on improving the ease of use of the equipment and training medical professionals on the improved technologies will assist in enhancing market penetration.
Key Players Shaping the Ultrasound Needle Guides Industry Market
- CONMED Corporation
- Medi-Globe Corporation
- Cook Group Incorporated
- ENDO-FLEX GmbH
- Medtronic PLC
- ACE Medical Devices Pvt Ltd
- Boston Scientific Corporation
- Micro-Tech Endoscopy
- Olympus Corporation
Notable Milestones in Ultrasound Needle Guides Industry Sector
- October 2021: Micro-Tech Endoscopy launched enhanced endoscopic ultrasound needles (Areus FNA Needle and Trident FNB Needle).
- November 2021: SonoScape Medical launched the linear echoendoscope EG-UC5T.
- May 2022: Limaca Medical received FDA breakthrough device designation for its Precision-GI endoscopic ultrasound biopsy needle.
In-Depth Ultrasound Needle Guides Industry Market Outlook
The Ultrasound Needle Guides market exhibits significant growth potential driven by continued technological advancements, rising demand for minimally invasive procedures, and expanding healthcare infrastructure globally. Strategic partnerships, focused R&D investments, and successful market entry strategies in emerging economies will further propel market expansion. The long-term outlook remains positive, with significant opportunities for companies to capitalize on unmet clinical needs and improve patient outcomes.
Ultrasound Needle Guides Industry Segmentation
-
1. Product
- 1.1. Aspiration Needles
- 1.2. Biopsy Needles
-
2. Application
- 2.1. Bronchial EUS Needles
- 2.2. Enteral EUS Needles
-
3. End User
- 3.1. Hospitals
- 3.2. Ambulatory Surgical Centers
- 3.3. Other End Users
Ultrasound Needle Guides Industry Segmentation By Geography
-
1. North America
- 1.1. United States
- 1.2. Canada
- 1.3. Mexico
-
2. Europe
- 2.1. United Kingdom
- 2.2. France
- 2.3. Germany
- 2.4. Italy
- 2.5. Spain
- 2.6. Rest of Europe
-
3. Asia Pacific
- 3.1. India
- 3.2. China
- 3.3. Japan
- 3.4. Australia
- 3.5. South Korea
- 3.6. Rest of Asia Pacific
-
4. Middle East and Africa
- 4.1. GCC
- 4.2. South Africa
- 4.3. Rest of Middle East and Africa
-
5. South America
- 5.1. Brazil
- 5.2. Argentina
- 5.3. Rest of South America
Ultrasound Needle Guides Industry REPORT HIGHLIGHTS
| Aspects | Details |
|---|---|
| Study Period | 2019-2033 |
| Base Year | 2024 |
| Estimated Year | 2025 |
| Forecast Period | 2025-2033 |
| Historical Period | 2019-2024 |
| Growth Rate | CAGR of 6.59% from 2019-2033 |
| Segmentation |
|
Table of Contents
- 1. Introduction
- 1.1. Research Scope
- 1.2. Market Segmentation
- 1.3. Research Methodology
- 1.4. Definitions and Assumptions
- 2. Executive Summary
- 2.1. Introduction
- 3. Market Dynamics
- 3.1. Introduction
- 3.2. Market Drivers
- 3.2.1. Rising Geriatric Population; High Prevalence of Gastrointestinal Tract-related Cancers; Increasing Demand for Minimally Invasive Procedures
- 3.3. Market Restrains
- 3.3.1. Lack of Expertise in Handling Endoscopic Ultrasound Needles
- 3.4. Market Trends
- 3.4.1. Biopsy Needles Expected to Hold a Significant Share in the Market Over the Forecast Period
- 4. Market Factor Analysis
- 4.1. Porters Five Forces
- 4.2. Supply/Value Chain
- 4.3. PESTEL analysis
- 4.4. Market Entropy
- 4.5. Patent/Trademark Analysis
- 5. Global Ultrasound Needle Guides Industry Analysis, Insights and Forecast, 2019-2031
- 5.1. Market Analysis, Insights and Forecast - by Product
- 5.1.1. Aspiration Needles
- 5.1.2. Biopsy Needles
- 5.2. Market Analysis, Insights and Forecast - by Application
- 5.2.1. Bronchial EUS Needles
- 5.2.2. Enteral EUS Needles
- 5.3. Market Analysis, Insights and Forecast - by End User
- 5.3.1. Hospitals
- 5.3.2. Ambulatory Surgical Centers
- 5.3.3. Other End Users
- 5.4. Market Analysis, Insights and Forecast - by Region
- 5.4.1. North America
- 5.4.2. Europe
- 5.4.3. Asia Pacific
- 5.4.4. Middle East and Africa
- 5.4.5. South America
- 5.1. Market Analysis, Insights and Forecast - by Product
- 6. North America Ultrasound Needle Guides Industry Analysis, Insights and Forecast, 2019-2031
- 6.1. Market Analysis, Insights and Forecast - by Product
- 6.1.1. Aspiration Needles
- 6.1.2. Biopsy Needles
- 6.2. Market Analysis, Insights and Forecast - by Application
- 6.2.1. Bronchial EUS Needles
- 6.2.2. Enteral EUS Needles
- 6.3. Market Analysis, Insights and Forecast - by End User
- 6.3.1. Hospitals
- 6.3.2. Ambulatory Surgical Centers
- 6.3.3. Other End Users
- 6.1. Market Analysis, Insights and Forecast - by Product
- 7. Europe Ultrasound Needle Guides Industry Analysis, Insights and Forecast, 2019-2031
- 7.1. Market Analysis, Insights and Forecast - by Product
- 7.1.1. Aspiration Needles
- 7.1.2. Biopsy Needles
- 7.2. Market Analysis, Insights and Forecast - by Application
- 7.2.1. Bronchial EUS Needles
- 7.2.2. Enteral EUS Needles
- 7.3. Market Analysis, Insights and Forecast - by End User
- 7.3.1. Hospitals
- 7.3.2. Ambulatory Surgical Centers
- 7.3.3. Other End Users
- 7.1. Market Analysis, Insights and Forecast - by Product
- 8. Asia Pacific Ultrasound Needle Guides Industry Analysis, Insights and Forecast, 2019-2031
- 8.1. Market Analysis, Insights and Forecast - by Product
- 8.1.1. Aspiration Needles
- 8.1.2. Biopsy Needles
- 8.2. Market Analysis, Insights and Forecast - by Application
- 8.2.1. Bronchial EUS Needles
- 8.2.2. Enteral EUS Needles
- 8.3. Market Analysis, Insights and Forecast - by End User
- 8.3.1. Hospitals
- 8.3.2. Ambulatory Surgical Centers
- 8.3.3. Other End Users
- 8.1. Market Analysis, Insights and Forecast - by Product
- 9. Middle East and Africa Ultrasound Needle Guides Industry Analysis, Insights and Forecast, 2019-2031
- 9.1. Market Analysis, Insights and Forecast - by Product
- 9.1.1. Aspiration Needles
- 9.1.2. Biopsy Needles
- 9.2. Market Analysis, Insights and Forecast - by Application
- 9.2.1. Bronchial EUS Needles
- 9.2.2. Enteral EUS Needles
- 9.3. Market Analysis, Insights and Forecast - by End User
- 9.3.1. Hospitals
- 9.3.2. Ambulatory Surgical Centers
- 9.3.3. Other End Users
- 9.1. Market Analysis, Insights and Forecast - by Product
- 10. South America Ultrasound Needle Guides Industry Analysis, Insights and Forecast, 2019-2031
- 10.1. Market Analysis, Insights and Forecast - by Product
- 10.1.1. Aspiration Needles
- 10.1.2. Biopsy Needles
- 10.2. Market Analysis, Insights and Forecast - by Application
- 10.2.1. Bronchial EUS Needles
- 10.2.2. Enteral EUS Needles
- 10.3. Market Analysis, Insights and Forecast - by End User
- 10.3.1. Hospitals
- 10.3.2. Ambulatory Surgical Centers
- 10.3.3. Other End Users
- 10.1. Market Analysis, Insights and Forecast - by Product
- 11. North America Ultrasound Needle Guides Industry Analysis, Insights and Forecast, 2019-2031
- 11.1. Market Analysis, Insights and Forecast - By Country/Sub-region
- 11.1.1 United States
- 11.1.2 Canada
- 11.1.3 Mexico
- 12. South America Ultrasound Needle Guides Industry Analysis, Insights and Forecast, 2019-2031
- 12.1. Market Analysis, Insights and Forecast - By Country/Sub-region
- 12.1.1 Brazil
- 12.1.2 Mexico
- 12.1.3 Rest of South America
- 13. Europe Ultrasound Needle Guides Industry Analysis, Insights and Forecast, 2019-2031
- 13.1. Market Analysis, Insights and Forecast - By Country/Sub-region
- 13.1.1 Germany
- 13.1.2 United Kingdom
- 13.1.3 France
- 13.1.4 Italy
- 13.1.5 Spain
- 13.1.6 Rest of Europe
- 14. Asia Pacific Ultrasound Needle Guides Industry Analysis, Insights and Forecast, 2019-2031
- 14.1. Market Analysis, Insights and Forecast - By Country/Sub-region
- 14.1.1 China
- 14.1.2 Japan
- 14.1.3 India
- 14.1.4 South Korea
- 14.1.5 Taiwan
- 14.1.6 Australia
- 14.1.7 Rest of Asia-Pacific
- 15. MEA Ultrasound Needle Guides Industry Analysis, Insights and Forecast, 2019-2031
- 15.1. Market Analysis, Insights and Forecast - By Country/Sub-region
- 15.1.1 Middle East
- 15.1.2 Africa
- 16. Competitive Analysis
- 16.1. Global Market Share Analysis 2024
- 16.2. Company Profiles
- 16.2.1 CONMED Corporation
- 16.2.1.1. Overview
- 16.2.1.2. Products
- 16.2.1.3. SWOT Analysis
- 16.2.1.4. Recent Developments
- 16.2.1.5. Financials (Based on Availability)
- 16.2.2 Medi-Globe Corporation
- 16.2.2.1. Overview
- 16.2.2.2. Products
- 16.2.2.3. SWOT Analysis
- 16.2.2.4. Recent Developments
- 16.2.2.5. Financials (Based on Availability)
- 16.2.3 Cook Group Incorporated
- 16.2.3.1. Overview
- 16.2.3.2. Products
- 16.2.3.3. SWOT Analysis
- 16.2.3.4. Recent Developments
- 16.2.3.5. Financials (Based on Availability)
- 16.2.4 ENDO-FLEX GmbH
- 16.2.4.1. Overview
- 16.2.4.2. Products
- 16.2.4.3. SWOT Analysis
- 16.2.4.4. Recent Developments
- 16.2.4.5. Financials (Based on Availability)
- 16.2.5 Medtronic PLC
- 16.2.5.1. Overview
- 16.2.5.2. Products
- 16.2.5.3. SWOT Analysis
- 16.2.5.4. Recent Developments
- 16.2.5.5. Financials (Based on Availability)
- 16.2.6 ACE Medical Devices Pvt Ltd
- 16.2.6.1. Overview
- 16.2.6.2. Products
- 16.2.6.3. SWOT Analysis
- 16.2.6.4. Recent Developments
- 16.2.6.5. Financials (Based on Availability)
- 16.2.7 Boston Scientific Corporation
- 16.2.7.1. Overview
- 16.2.7.2. Products
- 16.2.7.3. SWOT Analysis
- 16.2.7.4. Recent Developments
- 16.2.7.5. Financials (Based on Availability)
- 16.2.8 Micro-Tech Endoscopy
- 16.2.8.1. Overview
- 16.2.8.2. Products
- 16.2.8.3. SWOT Analysis
- 16.2.8.4. Recent Developments
- 16.2.8.5. Financials (Based on Availability)
- 16.2.9 Olympus Corporation
- 16.2.9.1. Overview
- 16.2.9.2. Products
- 16.2.9.3. SWOT Analysis
- 16.2.9.4. Recent Developments
- 16.2.9.5. Financials (Based on Availability)
- 16.2.1 CONMED Corporation
List of Figures
- Figure 1: Global Ultrasound Needle Guides Industry Revenue Breakdown (Million, %) by Region 2024 & 2032
- Figure 2: Global Ultrasound Needle Guides Industry Volume Breakdown (K Units, %) by Region 2024 & 2032
- Figure 3: North America Ultrasound Needle Guides Industry Revenue (Million), by Country 2024 & 2032
- Figure 4: North America Ultrasound Needle Guides Industry Volume (K Units), by Country 2024 & 2032
- Figure 5: North America Ultrasound Needle Guides Industry Revenue Share (%), by Country 2024 & 2032
- Figure 6: North America Ultrasound Needle Guides Industry Volume Share (%), by Country 2024 & 2032
- Figure 7: South America Ultrasound Needle Guides Industry Revenue (Million), by Country 2024 & 2032
- Figure 8: South America Ultrasound Needle Guides Industry Volume (K Units), by Country 2024 & 2032
- Figure 9: South America Ultrasound Needle Guides Industry Revenue Share (%), by Country 2024 & 2032
- Figure 10: South America Ultrasound Needle Guides Industry Volume Share (%), by Country 2024 & 2032
- Figure 11: Europe Ultrasound Needle Guides Industry Revenue (Million), by Country 2024 & 2032
- Figure 12: Europe Ultrasound Needle Guides Industry Volume (K Units), by Country 2024 & 2032
- Figure 13: Europe Ultrasound Needle Guides Industry Revenue Share (%), by Country 2024 & 2032
- Figure 14: Europe Ultrasound Needle Guides Industry Volume Share (%), by Country 2024 & 2032
- Figure 15: Asia Pacific Ultrasound Needle Guides Industry Revenue (Million), by Country 2024 & 2032
- Figure 16: Asia Pacific Ultrasound Needle Guides Industry Volume (K Units), by Country 2024 & 2032
- Figure 17: Asia Pacific Ultrasound Needle Guides Industry Revenue Share (%), by Country 2024 & 2032
- Figure 18: Asia Pacific Ultrasound Needle Guides Industry Volume Share (%), by Country 2024 & 2032
- Figure 19: MEA Ultrasound Needle Guides Industry Revenue (Million), by Country 2024 & 2032
- Figure 20: MEA Ultrasound Needle Guides Industry Volume (K Units), by Country 2024 & 2032
- Figure 21: MEA Ultrasound Needle Guides Industry Revenue Share (%), by Country 2024 & 2032
- Figure 22: MEA Ultrasound Needle Guides Industry Volume Share (%), by Country 2024 & 2032
- Figure 23: North America Ultrasound Needle Guides Industry Revenue (Million), by Product 2024 & 2032
- Figure 24: North America Ultrasound Needle Guides Industry Volume (K Units), by Product 2024 & 2032
- Figure 25: North America Ultrasound Needle Guides Industry Revenue Share (%), by Product 2024 & 2032
- Figure 26: North America Ultrasound Needle Guides Industry Volume Share (%), by Product 2024 & 2032
- Figure 27: North America Ultrasound Needle Guides Industry Revenue (Million), by Application 2024 & 2032
- Figure 28: North America Ultrasound Needle Guides Industry Volume (K Units), by Application 2024 & 2032
- Figure 29: North America Ultrasound Needle Guides Industry Revenue Share (%), by Application 2024 & 2032
- Figure 30: North America Ultrasound Needle Guides Industry Volume Share (%), by Application 2024 & 2032
- Figure 31: North America Ultrasound Needle Guides Industry Revenue (Million), by End User 2024 & 2032
- Figure 32: North America Ultrasound Needle Guides Industry Volume (K Units), by End User 2024 & 2032
- Figure 33: North America Ultrasound Needle Guides Industry Revenue Share (%), by End User 2024 & 2032
- Figure 34: North America Ultrasound Needle Guides Industry Volume Share (%), by End User 2024 & 2032
- Figure 35: North America Ultrasound Needle Guides Industry Revenue (Million), by Country 2024 & 2032
- Figure 36: North America Ultrasound Needle Guides Industry Volume (K Units), by Country 2024 & 2032
- Figure 37: North America Ultrasound Needle Guides Industry Revenue Share (%), by Country 2024 & 2032
- Figure 38: North America Ultrasound Needle Guides Industry Volume Share (%), by Country 2024 & 2032
- Figure 39: Europe Ultrasound Needle Guides Industry Revenue (Million), by Product 2024 & 2032
- Figure 40: Europe Ultrasound Needle Guides Industry Volume (K Units), by Product 2024 & 2032
- Figure 41: Europe Ultrasound Needle Guides Industry Revenue Share (%), by Product 2024 & 2032
- Figure 42: Europe Ultrasound Needle Guides Industry Volume Share (%), by Product 2024 & 2032
- Figure 43: Europe Ultrasound Needle Guides Industry Revenue (Million), by Application 2024 & 2032
- Figure 44: Europe Ultrasound Needle Guides Industry Volume (K Units), by Application 2024 & 2032
- Figure 45: Europe Ultrasound Needle Guides Industry Revenue Share (%), by Application 2024 & 2032
- Figure 46: Europe Ultrasound Needle Guides Industry Volume Share (%), by Application 2024 & 2032
- Figure 47: Europe Ultrasound Needle Guides Industry Revenue (Million), by End User 2024 & 2032
- Figure 48: Europe Ultrasound Needle Guides Industry Volume (K Units), by End User 2024 & 2032
- Figure 49: Europe Ultrasound Needle Guides Industry Revenue Share (%), by End User 2024 & 2032
- Figure 50: Europe Ultrasound Needle Guides Industry Volume Share (%), by End User 2024 & 2032
- Figure 51: Europe Ultrasound Needle Guides Industry Revenue (Million), by Country 2024 & 2032
- Figure 52: Europe Ultrasound Needle Guides Industry Volume (K Units), by Country 2024 & 2032
- Figure 53: Europe Ultrasound Needle Guides Industry Revenue Share (%), by Country 2024 & 2032
- Figure 54: Europe Ultrasound Needle Guides Industry Volume Share (%), by Country 2024 & 2032
- Figure 55: Asia Pacific Ultrasound Needle Guides Industry Revenue (Million), by Product 2024 & 2032
- Figure 56: Asia Pacific Ultrasound Needle Guides Industry Volume (K Units), by Product 2024 & 2032
- Figure 57: Asia Pacific Ultrasound Needle Guides Industry Revenue Share (%), by Product 2024 & 2032
- Figure 58: Asia Pacific Ultrasound Needle Guides Industry Volume Share (%), by Product 2024 & 2032
- Figure 59: Asia Pacific Ultrasound Needle Guides Industry Revenue (Million), by Application 2024 & 2032
- Figure 60: Asia Pacific Ultrasound Needle Guides Industry Volume (K Units), by Application 2024 & 2032
- Figure 61: Asia Pacific Ultrasound Needle Guides Industry Revenue Share (%), by Application 2024 & 2032
- Figure 62: Asia Pacific Ultrasound Needle Guides Industry Volume Share (%), by Application 2024 & 2032
- Figure 63: Asia Pacific Ultrasound Needle Guides Industry Revenue (Million), by End User 2024 & 2032
- Figure 64: Asia Pacific Ultrasound Needle Guides Industry Volume (K Units), by End User 2024 & 2032
- Figure 65: Asia Pacific Ultrasound Needle Guides Industry Revenue Share (%), by End User 2024 & 2032
- Figure 66: Asia Pacific Ultrasound Needle Guides Industry Volume Share (%), by End User 2024 & 2032
- Figure 67: Asia Pacific Ultrasound Needle Guides Industry Revenue (Million), by Country 2024 & 2032
- Figure 68: Asia Pacific Ultrasound Needle Guides Industry Volume (K Units), by Country 2024 & 2032
- Figure 69: Asia Pacific Ultrasound Needle Guides Industry Revenue Share (%), by Country 2024 & 2032
- Figure 70: Asia Pacific Ultrasound Needle Guides Industry Volume Share (%), by Country 2024 & 2032
- Figure 71: Middle East and Africa Ultrasound Needle Guides Industry Revenue (Million), by Product 2024 & 2032
- Figure 72: Middle East and Africa Ultrasound Needle Guides Industry Volume (K Units), by Product 2024 & 2032
- Figure 73: Middle East and Africa Ultrasound Needle Guides Industry Revenue Share (%), by Product 2024 & 2032
- Figure 74: Middle East and Africa Ultrasound Needle Guides Industry Volume Share (%), by Product 2024 & 2032
- Figure 75: Middle East and Africa Ultrasound Needle Guides Industry Revenue (Million), by Application 2024 & 2032
- Figure 76: Middle East and Africa Ultrasound Needle Guides Industry Volume (K Units), by Application 2024 & 2032
- Figure 77: Middle East and Africa Ultrasound Needle Guides Industry Revenue Share (%), by Application 2024 & 2032
- Figure 78: Middle East and Africa Ultrasound Needle Guides Industry Volume Share (%), by Application 2024 & 2032
- Figure 79: Middle East and Africa Ultrasound Needle Guides Industry Revenue (Million), by End User 2024 & 2032
- Figure 80: Middle East and Africa Ultrasound Needle Guides Industry Volume (K Units), by End User 2024 & 2032
- Figure 81: Middle East and Africa Ultrasound Needle Guides Industry Revenue Share (%), by End User 2024 & 2032
- Figure 82: Middle East and Africa Ultrasound Needle Guides Industry Volume Share (%), by End User 2024 & 2032
- Figure 83: Middle East and Africa Ultrasound Needle Guides Industry Revenue (Million), by Country 2024 & 2032
- Figure 84: Middle East and Africa Ultrasound Needle Guides Industry Volume (K Units), by Country 2024 & 2032
- Figure 85: Middle East and Africa Ultrasound Needle Guides Industry Revenue Share (%), by Country 2024 & 2032
- Figure 86: Middle East and Africa Ultrasound Needle Guides Industry Volume Share (%), by Country 2024 & 2032
- Figure 87: South America Ultrasound Needle Guides Industry Revenue (Million), by Product 2024 & 2032
- Figure 88: South America Ultrasound Needle Guides Industry Volume (K Units), by Product 2024 & 2032
- Figure 89: South America Ultrasound Needle Guides Industry Revenue Share (%), by Product 2024 & 2032
- Figure 90: South America Ultrasound Needle Guides Industry Volume Share (%), by Product 2024 & 2032
- Figure 91: South America Ultrasound Needle Guides Industry Revenue (Million), by Application 2024 & 2032
- Figure 92: South America Ultrasound Needle Guides Industry Volume (K Units), by Application 2024 & 2032
- Figure 93: South America Ultrasound Needle Guides Industry Revenue Share (%), by Application 2024 & 2032
- Figure 94: South America Ultrasound Needle Guides Industry Volume Share (%), by Application 2024 & 2032
- Figure 95: South America Ultrasound Needle Guides Industry Revenue (Million), by End User 2024 & 2032
- Figure 96: South America Ultrasound Needle Guides Industry Volume (K Units), by End User 2024 & 2032
- Figure 97: South America Ultrasound Needle Guides Industry Revenue Share (%), by End User 2024 & 2032
- Figure 98: South America Ultrasound Needle Guides Industry Volume Share (%), by End User 2024 & 2032
- Figure 99: South America Ultrasound Needle Guides Industry Revenue (Million), by Country 2024 & 2032
- Figure 100: South America Ultrasound Needle Guides Industry Volume (K Units), by Country 2024 & 2032
- Figure 101: South America Ultrasound Needle Guides Industry Revenue Share (%), by Country 2024 & 2032
- Figure 102: South America Ultrasound Needle Guides Industry Volume Share (%), by Country 2024 & 2032
List of Tables
- Table 1: Global Ultrasound Needle Guides Industry Revenue Million Forecast, by Region 2019 & 2032
- Table 2: Global Ultrasound Needle Guides Industry Volume K Units Forecast, by Region 2019 & 2032
- Table 3: Global Ultrasound Needle Guides Industry Revenue Million Forecast, by Product 2019 & 2032
- Table 4: Global Ultrasound Needle Guides Industry Volume K Units Forecast, by Product 2019 & 2032
- Table 5: Global Ultrasound Needle Guides Industry Revenue Million Forecast, by Application 2019 & 2032
- Table 6: Global Ultrasound Needle Guides Industry Volume K Units Forecast, by Application 2019 & 2032
- Table 7: Global Ultrasound Needle Guides Industry Revenue Million Forecast, by End User 2019 & 2032
- Table 8: Global Ultrasound Needle Guides Industry Volume K Units Forecast, by End User 2019 & 2032
- Table 9: Global Ultrasound Needle Guides Industry Revenue Million Forecast, by Region 2019 & 2032
- Table 10: Global Ultrasound Needle Guides Industry Volume K Units Forecast, by Region 2019 & 2032
- Table 11: Global Ultrasound Needle Guides Industry Revenue Million Forecast, by Country 2019 & 2032
- Table 12: Global Ultrasound Needle Guides Industry Volume K Units Forecast, by Country 2019 & 2032
- Table 13: United States Ultrasound Needle Guides Industry Revenue (Million) Forecast, by Application 2019 & 2032
- Table 14: United States Ultrasound Needle Guides Industry Volume (K Units) Forecast, by Application 2019 & 2032
- Table 15: Canada Ultrasound Needle Guides Industry Revenue (Million) Forecast, by Application 2019 & 2032
- Table 16: Canada Ultrasound Needle Guides Industry Volume (K Units) Forecast, by Application 2019 & 2032
- Table 17: Mexico Ultrasound Needle Guides Industry Revenue (Million) Forecast, by Application 2019 & 2032
- Table 18: Mexico Ultrasound Needle Guides Industry Volume (K Units) Forecast, by Application 2019 & 2032
- Table 19: Global Ultrasound Needle Guides Industry Revenue Million Forecast, by Country 2019 & 2032
- Table 20: Global Ultrasound Needle Guides Industry Volume K Units Forecast, by Country 2019 & 2032
- Table 21: Brazil Ultrasound Needle Guides Industry Revenue (Million) Forecast, by Application 2019 & 2032
- Table 22: Brazil Ultrasound Needle Guides Industry Volume (K Units) Forecast, by Application 2019 & 2032
- Table 23: Mexico Ultrasound Needle Guides Industry Revenue (Million) Forecast, by Application 2019 & 2032
- Table 24: Mexico Ultrasound Needle Guides Industry Volume (K Units) Forecast, by Application 2019 & 2032
- Table 25: Rest of South America Ultrasound Needle Guides Industry Revenue (Million) Forecast, by Application 2019 & 2032
- Table 26: Rest of South America Ultrasound Needle Guides Industry Volume (K Units) Forecast, by Application 2019 & 2032
- Table 27: Global Ultrasound Needle Guides Industry Revenue Million Forecast, by Country 2019 & 2032
- Table 28: Global Ultrasound Needle Guides Industry Volume K Units Forecast, by Country 2019 & 2032
- Table 29: Germany Ultrasound Needle Guides Industry Revenue (Million) Forecast, by Application 2019 & 2032
- Table 30: Germany Ultrasound Needle Guides Industry Volume (K Units) Forecast, by Application 2019 & 2032
- Table 31: United Kingdom Ultrasound Needle Guides Industry Revenue (Million) Forecast, by Application 2019 & 2032
- Table 32: United Kingdom Ultrasound Needle Guides Industry Volume (K Units) Forecast, by Application 2019 & 2032
- Table 33: France Ultrasound Needle Guides Industry Revenue (Million) Forecast, by Application 2019 & 2032
- Table 34: France Ultrasound Needle Guides Industry Volume (K Units) Forecast, by Application 2019 & 2032
- Table 35: Italy Ultrasound Needle Guides Industry Revenue (Million) Forecast, by Application 2019 & 2032
- Table 36: Italy Ultrasound Needle Guides Industry Volume (K Units) Forecast, by Application 2019 & 2032
- Table 37: Spain Ultrasound Needle Guides Industry Revenue (Million) Forecast, by Application 2019 & 2032
- Table 38: Spain Ultrasound Needle Guides Industry Volume (K Units) Forecast, by Application 2019 & 2032
- Table 39: Rest of Europe Ultrasound Needle Guides Industry Revenue (Million) Forecast, by Application 2019 & 2032
- Table 40: Rest of Europe Ultrasound Needle Guides Industry Volume (K Units) Forecast, by Application 2019 & 2032
- Table 41: Global Ultrasound Needle Guides Industry Revenue Million Forecast, by Country 2019 & 2032
- Table 42: Global Ultrasound Needle Guides Industry Volume K Units Forecast, by Country 2019 & 2032
- Table 43: China Ultrasound Needle Guides Industry Revenue (Million) Forecast, by Application 2019 & 2032
- Table 44: China Ultrasound Needle Guides Industry Volume (K Units) Forecast, by Application 2019 & 2032
- Table 45: Japan Ultrasound Needle Guides Industry Revenue (Million) Forecast, by Application 2019 & 2032
- Table 46: Japan Ultrasound Needle Guides Industry Volume (K Units) Forecast, by Application 2019 & 2032
- Table 47: India Ultrasound Needle Guides Industry Revenue (Million) Forecast, by Application 2019 & 2032
- Table 48: India Ultrasound Needle Guides Industry Volume (K Units) Forecast, by Application 2019 & 2032
- Table 49: South Korea Ultrasound Needle Guides Industry Revenue (Million) Forecast, by Application 2019 & 2032
- Table 50: South Korea Ultrasound Needle Guides Industry Volume (K Units) Forecast, by Application 2019 & 2032
- Table 51: Taiwan Ultrasound Needle Guides Industry Revenue (Million) Forecast, by Application 2019 & 2032
- Table 52: Taiwan Ultrasound Needle Guides Industry Volume (K Units) Forecast, by Application 2019 & 2032
- Table 53: Australia Ultrasound Needle Guides Industry Revenue (Million) Forecast, by Application 2019 & 2032
- Table 54: Australia Ultrasound Needle Guides Industry Volume (K Units) Forecast, by Application 2019 & 2032
- Table 55: Rest of Asia-Pacific Ultrasound Needle Guides Industry Revenue (Million) Forecast, by Application 2019 & 2032
- Table 56: Rest of Asia-Pacific Ultrasound Needle Guides Industry Volume (K Units) Forecast, by Application 2019 & 2032
- Table 57: Global Ultrasound Needle Guides Industry Revenue Million Forecast, by Country 2019 & 2032
- Table 58: Global Ultrasound Needle Guides Industry Volume K Units Forecast, by Country 2019 & 2032
- Table 59: Middle East Ultrasound Needle Guides Industry Revenue (Million) Forecast, by Application 2019 & 2032
- Table 60: Middle East Ultrasound Needle Guides Industry Volume (K Units) Forecast, by Application 2019 & 2032
- Table 61: Africa Ultrasound Needle Guides Industry Revenue (Million) Forecast, by Application 2019 & 2032
- Table 62: Africa Ultrasound Needle Guides Industry Volume (K Units) Forecast, by Application 2019 & 2032
- Table 63: Global Ultrasound Needle Guides Industry Revenue Million Forecast, by Product 2019 & 2032
- Table 64: Global Ultrasound Needle Guides Industry Volume K Units Forecast, by Product 2019 & 2032
- Table 65: Global Ultrasound Needle Guides Industry Revenue Million Forecast, by Application 2019 & 2032
- Table 66: Global Ultrasound Needle Guides Industry Volume K Units Forecast, by Application 2019 & 2032
- Table 67: Global Ultrasound Needle Guides Industry Revenue Million Forecast, by End User 2019 & 2032
- Table 68: Global Ultrasound Needle Guides Industry Volume K Units Forecast, by End User 2019 & 2032
- Table 69: Global Ultrasound Needle Guides Industry Revenue Million Forecast, by Country 2019 & 2032
- Table 70: Global Ultrasound Needle Guides Industry Volume K Units Forecast, by Country 2019 & 2032
- Table 71: United States Ultrasound Needle Guides Industry Revenue (Million) Forecast, by Application 2019 & 2032
- Table 72: United States Ultrasound Needle Guides Industry Volume (K Units) Forecast, by Application 2019 & 2032
- Table 73: Canada Ultrasound Needle Guides Industry Revenue (Million) Forecast, by Application 2019 & 2032
- Table 74: Canada Ultrasound Needle Guides Industry Volume (K Units) Forecast, by Application 2019 & 2032
- Table 75: Mexico Ultrasound Needle Guides Industry Revenue (Million) Forecast, by Application 2019 & 2032
- Table 76: Mexico Ultrasound Needle Guides Industry Volume (K Units) Forecast, by Application 2019 & 2032
- Table 77: Global Ultrasound Needle Guides Industry Revenue Million Forecast, by Product 2019 & 2032
- Table 78: Global Ultrasound Needle Guides Industry Volume K Units Forecast, by Product 2019 & 2032
- Table 79: Global Ultrasound Needle Guides Industry Revenue Million Forecast, by Application 2019 & 2032
- Table 80: Global Ultrasound Needle Guides Industry Volume K Units Forecast, by Application 2019 & 2032
- Table 81: Global Ultrasound Needle Guides Industry Revenue Million Forecast, by End User 2019 & 2032
- Table 82: Global Ultrasound Needle Guides Industry Volume K Units Forecast, by End User 2019 & 2032
- Table 83: Global Ultrasound Needle Guides Industry Revenue Million Forecast, by Country 2019 & 2032
- Table 84: Global Ultrasound Needle Guides Industry Volume K Units Forecast, by Country 2019 & 2032
- Table 85: United Kingdom Ultrasound Needle Guides Industry Revenue (Million) Forecast, by Application 2019 & 2032
- Table 86: United Kingdom Ultrasound Needle Guides Industry Volume (K Units) Forecast, by Application 2019 & 2032
- Table 87: France Ultrasound Needle Guides Industry Revenue (Million) Forecast, by Application 2019 & 2032
- Table 88: France Ultrasound Needle Guides Industry Volume (K Units) Forecast, by Application 2019 & 2032
- Table 89: Germany Ultrasound Needle Guides Industry Revenue (Million) Forecast, by Application 2019 & 2032
- Table 90: Germany Ultrasound Needle Guides Industry Volume (K Units) Forecast, by Application 2019 & 2032
- Table 91: Italy Ultrasound Needle Guides Industry Revenue (Million) Forecast, by Application 2019 & 2032
- Table 92: Italy Ultrasound Needle Guides Industry Volume (K Units) Forecast, by Application 2019 & 2032
- Table 93: Spain Ultrasound Needle Guides Industry Revenue (Million) Forecast, by Application 2019 & 2032
- Table 94: Spain Ultrasound Needle Guides Industry Volume (K Units) Forecast, by Application 2019 & 2032
- Table 95: Rest of Europe Ultrasound Needle Guides Industry Revenue (Million) Forecast, by Application 2019 & 2032
- Table 96: Rest of Europe Ultrasound Needle Guides Industry Volume (K Units) Forecast, by Application 2019 & 2032
- Table 97: Global Ultrasound Needle Guides Industry Revenue Million Forecast, by Product 2019 & 2032
- Table 98: Global Ultrasound Needle Guides Industry Volume K Units Forecast, by Product 2019 & 2032
- Table 99: Global Ultrasound Needle Guides Industry Revenue Million Forecast, by Application 2019 & 2032
- Table 100: Global Ultrasound Needle Guides Industry Volume K Units Forecast, by Application 2019 & 2032
- Table 101: Global Ultrasound Needle Guides Industry Revenue Million Forecast, by End User 2019 & 2032
- Table 102: Global Ultrasound Needle Guides Industry Volume K Units Forecast, by End User 2019 & 2032
- Table 103: Global Ultrasound Needle Guides Industry Revenue Million Forecast, by Country 2019 & 2032
- Table 104: Global Ultrasound Needle Guides Industry Volume K Units Forecast, by Country 2019 & 2032
- Table 105: India Ultrasound Needle Guides Industry Revenue (Million) Forecast, by Application 2019 & 2032
- Table 106: India Ultrasound Needle Guides Industry Volume (K Units) Forecast, by Application 2019 & 2032
- Table 107: China Ultrasound Needle Guides Industry Revenue (Million) Forecast, by Application 2019 & 2032
- Table 108: China Ultrasound Needle Guides Industry Volume (K Units) Forecast, by Application 2019 & 2032
- Table 109: Japan Ultrasound Needle Guides Industry Revenue (Million) Forecast, by Application 2019 & 2032
- Table 110: Japan Ultrasound Needle Guides Industry Volume (K Units) Forecast, by Application 2019 & 2032
- Table 111: Australia Ultrasound Needle Guides Industry Revenue (Million) Forecast, by Application 2019 & 2032
- Table 112: Australia Ultrasound Needle Guides Industry Volume (K Units) Forecast, by Application 2019 & 2032
- Table 113: South Korea Ultrasound Needle Guides Industry Revenue (Million) Forecast, by Application 2019 & 2032
- Table 114: South Korea Ultrasound Needle Guides Industry Volume (K Units) Forecast, by Application 2019 & 2032
- Table 115: Rest of Asia Pacific Ultrasound Needle Guides Industry Revenue (Million) Forecast, by Application 2019 & 2032
- Table 116: Rest of Asia Pacific Ultrasound Needle Guides Industry Volume (K Units) Forecast, by Application 2019 & 2032
- Table 117: Global Ultrasound Needle Guides Industry Revenue Million Forecast, by Product 2019 & 2032
- Table 118: Global Ultrasound Needle Guides Industry Volume K Units Forecast, by Product 2019 & 2032
- Table 119: Global Ultrasound Needle Guides Industry Revenue Million Forecast, by Application 2019 & 2032
- Table 120: Global Ultrasound Needle Guides Industry Volume K Units Forecast, by Application 2019 & 2032
- Table 121: Global Ultrasound Needle Guides Industry Revenue Million Forecast, by End User 2019 & 2032
- Table 122: Global Ultrasound Needle Guides Industry Volume K Units Forecast, by End User 2019 & 2032
- Table 123: Global Ultrasound Needle Guides Industry Revenue Million Forecast, by Country 2019 & 2032
- Table 124: Global Ultrasound Needle Guides Industry Volume K Units Forecast, by Country 2019 & 2032
- Table 125: GCC Ultrasound Needle Guides Industry Revenue (Million) Forecast, by Application 2019 & 2032
- Table 126: GCC Ultrasound Needle Guides Industry Volume (K Units) Forecast, by Application 2019 & 2032
- Table 127: South Africa Ultrasound Needle Guides Industry Revenue (Million) Forecast, by Application 2019 & 2032
- Table 128: South Africa Ultrasound Needle Guides Industry Volume (K Units) Forecast, by Application 2019 & 2032
- Table 129: Rest of Middle East and Africa Ultrasound Needle Guides Industry Revenue (Million) Forecast, by Application 2019 & 2032
- Table 130: Rest of Middle East and Africa Ultrasound Needle Guides Industry Volume (K Units) Forecast, by Application 2019 & 2032
- Table 131: Global Ultrasound Needle Guides Industry Revenue Million Forecast, by Product 2019 & 2032
- Table 132: Global Ultrasound Needle Guides Industry Volume K Units Forecast, by Product 2019 & 2032
- Table 133: Global Ultrasound Needle Guides Industry Revenue Million Forecast, by Application 2019 & 2032
- Table 134: Global Ultrasound Needle Guides Industry Volume K Units Forecast, by Application 2019 & 2032
- Table 135: Global Ultrasound Needle Guides Industry Revenue Million Forecast, by End User 2019 & 2032
- Table 136: Global Ultrasound Needle Guides Industry Volume K Units Forecast, by End User 2019 & 2032
- Table 137: Global Ultrasound Needle Guides Industry Revenue Million Forecast, by Country 2019 & 2032
- Table 138: Global Ultrasound Needle Guides Industry Volume K Units Forecast, by Country 2019 & 2032
- Table 139: Brazil Ultrasound Needle Guides Industry Revenue (Million) Forecast, by Application 2019 & 2032
- Table 140: Brazil Ultrasound Needle Guides Industry Volume (K Units) Forecast, by Application 2019 & 2032
- Table 141: Argentina Ultrasound Needle Guides Industry Revenue (Million) Forecast, by Application 2019 & 2032
- Table 142: Argentina Ultrasound Needle Guides Industry Volume (K Units) Forecast, by Application 2019 & 2032
- Table 143: Rest of South America Ultrasound Needle Guides Industry Revenue (Million) Forecast, by Application 2019 & 2032
- Table 144: Rest of South America Ultrasound Needle Guides Industry Volume (K Units) Forecast, by Application 2019 & 2032
Frequently Asked Questions
1. What is the projected Compound Annual Growth Rate (CAGR) of the Ultrasound Needle Guides Industry?
The projected CAGR is approximately 6.59%.
2. Which companies are prominent players in the Ultrasound Needle Guides Industry?
Key companies in the market include CONMED Corporation, Medi-Globe Corporation, Cook Group Incorporated, ENDO-FLEX GmbH, Medtronic PLC, ACE Medical Devices Pvt Ltd, Boston Scientific Corporation, Micro-Tech Endoscopy, Olympus Corporation.
3. What are the main segments of the Ultrasound Needle Guides Industry?
The market segments include Product, Application, End User.
4. Can you provide details about the market size?
The market size is estimated to be USD 152.06 Million as of 2022.
5. What are some drivers contributing to market growth?
Rising Geriatric Population; High Prevalence of Gastrointestinal Tract-related Cancers; Increasing Demand for Minimally Invasive Procedures.
6. What are the notable trends driving market growth?
Biopsy Needles Expected to Hold a Significant Share in the Market Over the Forecast Period.
7. Are there any restraints impacting market growth?
Lack of Expertise in Handling Endoscopic Ultrasound Needles.
8. Can you provide examples of recent developments in the market?
May 2022: Limaca Medical announced that they had received breakthrough device designation from the FDA for its Precision-GI endoscopic ultrasound biopsy needle. It is an automated, rotational cutting needle aiming to decrease sample tissue fragmentation, inadequate sample amount, and blood contamination.
9. What pricing options are available for accessing the report?
Pricing options include single-user, multi-user, and enterprise licenses priced at USD 4750, USD 5250, and USD 8750 respectively.
10. Is the market size provided in terms of value or volume?
The market size is provided in terms of value, measured in Million and volume, measured in K Units.
11. Are there any specific market keywords associated with the report?
Yes, the market keyword associated with the report is "Ultrasound Needle Guides Industry," which aids in identifying and referencing the specific market segment covered.
12. How do I determine which pricing option suits my needs best?
The pricing options vary based on user requirements and access needs. Individual users may opt for single-user licenses, while businesses requiring broader access may choose multi-user or enterprise licenses for cost-effective access to the report.
13. Are there any additional resources or data provided in the Ultrasound Needle Guides Industry report?
While the report offers comprehensive insights, it's advisable to review the specific contents or supplementary materials provided to ascertain if additional resources or data are available.
14. How can I stay updated on further developments or reports in the Ultrasound Needle Guides Industry?
To stay informed about further developments, trends, and reports in the Ultrasound Needle Guides Industry, consider subscribing to industry newsletters, following relevant companies and organizations, or regularly checking reputable industry news sources and publications.
Methodology
Step 1 - Identification of Relevant Samples Size from Population Database


Step 2 - Approaches for Defining Global Market Size (Value, Volume* & Price*)

Note*: In applicable scenarios
Step 3 - Data Sources
Primary Research
- Web Analytics
- Survey Reports
- Research Institute
- Latest Research Reports
- Opinion Leaders
Secondary Research
- Annual Reports
- White Paper
- Latest Press Release
- Industry Association
- Paid Database
- Investor Presentations

Step 4 - Data Triangulation
Involves using different sources of information in order to increase the validity of a study
These sources are likely to be stakeholders in a program - participants, other researchers, program staff, other community members, and so on.
Then we put all data in single framework & apply various statistical tools to find out the dynamic on the market.
During the analysis stage, feedback from the stakeholder groups would be compared to determine areas of agreement as well as areas of divergence


