
Key Insights
The ultra-thin ambient light sensor market is experiencing robust growth, driven by increasing demand for advanced features in smartphones, wearables, and automotive applications. Miniaturization is a key trend, with manufacturers focusing on reducing sensor thickness and power consumption to meet the design constraints of increasingly slim and energy-efficient devices. The market is segmented by sensor type (photodiodes, phototransistors), application (consumer electronics, automotive, industrial), and technology (CMOS, MEMS). Key players such as Texas Instruments, ams AG, and ON Semiconductor are investing heavily in research and development to improve sensor performance, accuracy, and integration capabilities. The market's expansion is further fueled by the growing adoption of sophisticated user interfaces, augmented reality (AR) and virtual reality (VR) technologies, and the need for improved human-machine interfaces in various sectors. We project a Compound Annual Growth Rate (CAGR) of 12% for the period 2025-2033, with the market value expected to reach approximately $2.5 billion by 2033. This growth is tempered slightly by the relatively high cost of advanced sensors and the potential for market saturation in certain segments.
Despite the challenges, significant opportunities exist for market expansion. The development of innovative sensor technologies, including those with improved spectral sensitivity and wider dynamic range, will unlock new applications in diverse industries. The integration of ambient light sensors with other sensors, such as proximity sensors and gesture recognition sensors, is also expected to drive growth. Furthermore, increasing demand for energy-efficient and environmentally friendly electronics is pushing the development of low-power, high-performance sensors. The adoption of ultra-thin ambient light sensors in the Internet of Things (IoT) and smart home devices is likely to contribute to substantial market expansion in the coming years. Regional variations will likely see robust growth in Asia-Pacific, driven by the high concentration of electronics manufacturing and consumer electronics markets.
Ultra Thin Ambient Light Sensors Market Report: 2019-2033
This comprehensive report provides a detailed analysis of the ultra-thin ambient light sensor market, encompassing market dynamics, growth trends, regional insights, product landscape, and key player strategies. The study period spans from 2019 to 2033, with 2025 serving as the base and estimated year. The forecast period covers 2025-2033, and the historical period encompasses 2019-2024. The report is invaluable for industry professionals, investors, and strategic decision-makers seeking a thorough understanding of this rapidly evolving market segment. The parent market is the broader sensor market, while the child market focuses specifically on ultra-thin ambient light sensors used in consumer electronics, automotive, and industrial applications.
Ultra Thin Ambient Light Sensors Market Dynamics & Structure
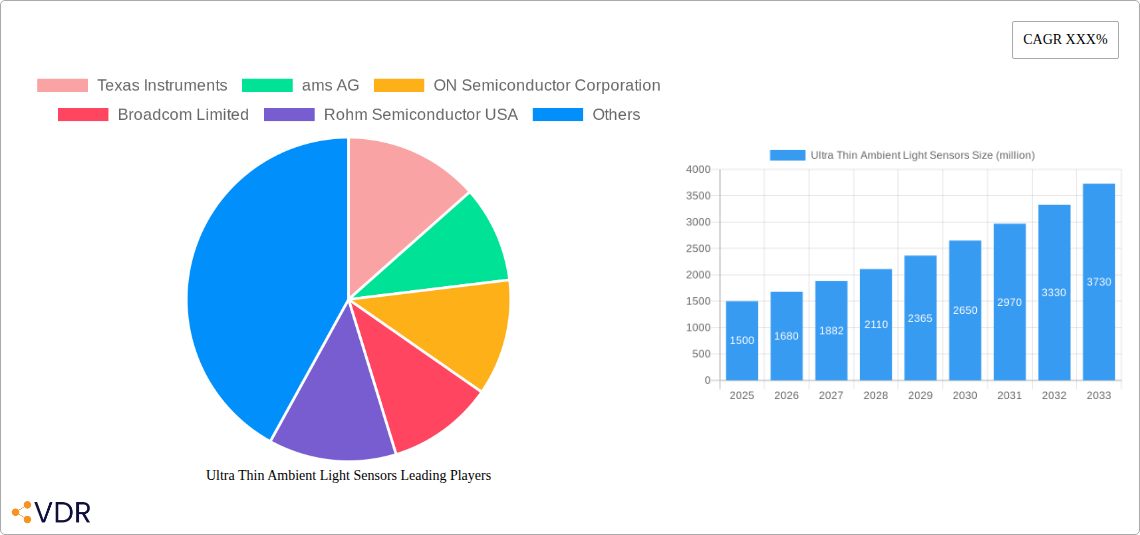
The ultra-thin ambient light sensor market is characterized by a moderately concentrated landscape, with key players such as Texas Instruments, ams AG, and ON Semiconductor holding significant market share. The market size in 2025 is estimated at xx million units. Technological innovation, particularly in miniaturization and power efficiency, is a key driver, alongside increasing demand from the consumer electronics and automotive sectors. Stringent regulatory frameworks regarding energy efficiency are also impacting market growth. Competitive substitutes include alternative sensing technologies, but the advantages of ultra-thin sensors in terms of form factor and cost are maintaining their dominance. M&A activity in the sensor industry has been moderate, with xx deals recorded between 2019 and 2024, leading to some consolidation.
- Market Concentration: Moderately concentrated, with top 5 players holding approximately 60% market share in 2025.
- Technological Innovation: Miniaturization, improved power efficiency, and enhanced accuracy are key drivers.
- Regulatory Frameworks: Energy efficiency regulations are influencing demand, especially in automotive and consumer electronics.
- Competitive Substitutes: Alternative sensing technologies pose a moderate threat.
- End-User Demographics: Strong growth is driven by increasing adoption in smartphones, wearables, and automotive applications.
- M&A Trends: Moderate M&A activity with xx deals between 2019-2024 leading to some market consolidation.
Ultra Thin Ambient Light Sensors Growth Trends & Insights
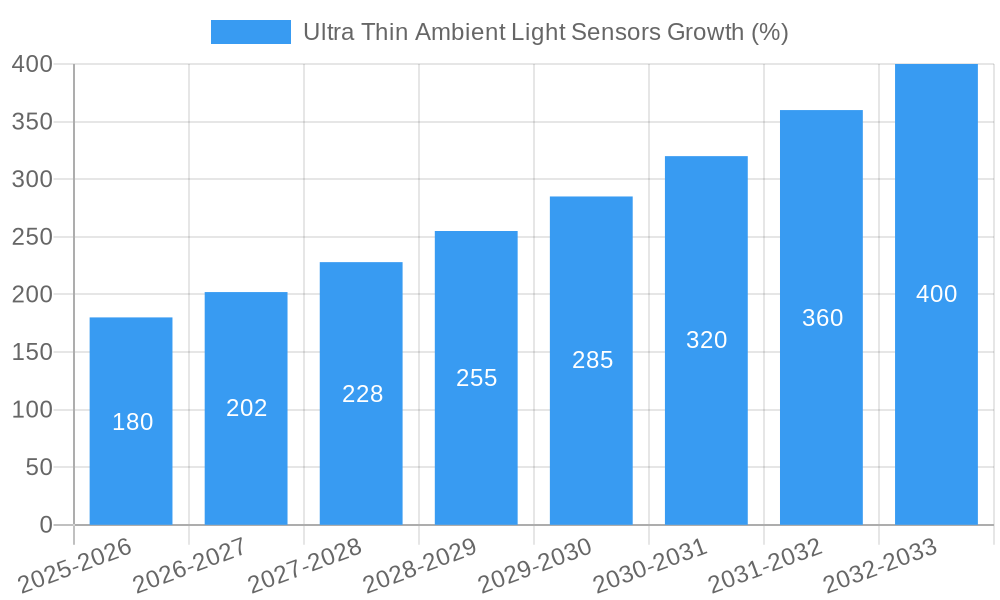
The ultra-thin ambient light sensor market experienced significant growth during the historical period (2019-2024), driven by the booming consumer electronics market and increasing demand for advanced automotive features. The market size grew from xx million units in 2019 to xx million units in 2024, registering a CAGR of xx%. This growth is projected to continue during the forecast period (2025-2033), with a projected CAGR of xx%, reaching xx million units by 2033. Technological advancements, such as the integration of AI and improved power management, are further accelerating market expansion. Consumer demand for thinner, more energy-efficient devices is driving adoption rates. Market penetration in key segments, such as smartphones, is approaching saturation in mature markets but significant growth potential remains in developing regions and emerging applications.
Dominant Regions, Countries, or Segments in Ultra Thin Ambient Light Sensors
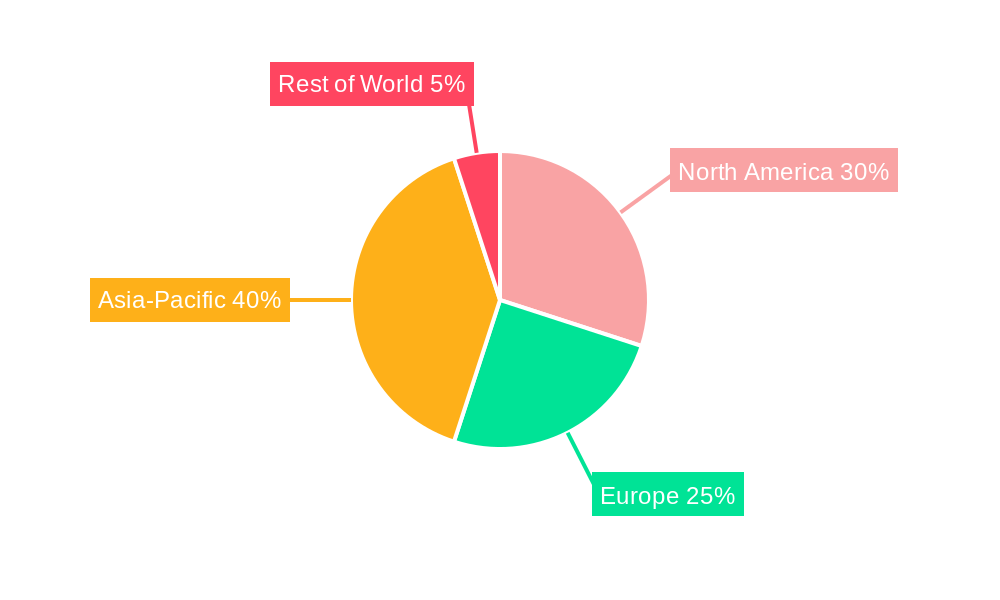
North America and Asia-Pacific currently dominate the ultra-thin ambient light sensor market, with Asia-Pacific demonstrating faster growth due to a large and rapidly expanding consumer electronics market. Within Asia-Pacific, China and South Korea are leading contributors.
- Key Drivers in Asia-Pacific: Rapid growth of the consumer electronics industry, significant investments in manufacturing, and supportive government policies.
- Dominance Factors: High demand for smartphones and wearables, presence of major electronics manufacturers, and cost-effective manufacturing capabilities.
- Market Share: Asia-Pacific holds approximately xx% of the global market share in 2025.
- Growth Potential: Continued strong growth projected for Asia-Pacific, driven by increasing adoption in automotive applications and the rise of IoT devices.
Ultra Thin Ambient Light Sensors Product Landscape
Ultra-thin ambient light sensors are characterized by their compact size, low power consumption, and high accuracy. Recent innovations include the integration of advanced signal processing capabilities and improved spectral sensitivity. Key applications include smartphones, tablets, laptops, automotive dashboards, and smart lighting systems. Unique selling propositions center around their small form factor, enabling seamless integration into increasingly compact devices and offering superior performance compared to traditional ambient light sensors.
Key Drivers, Barriers & Challenges in Ultra Thin Ambient Light Sensors
Key Drivers: The miniaturization trend in electronics, increasing demand for energy-efficient devices, and the growth of IoT applications are key drivers. Technological advancements in sensor technology, such as improved sensitivity and lower power consumption, further accelerate market expansion.
Challenges: Competition from alternative sensing technologies, supply chain disruptions (e.g., semiconductor shortages), and fluctuating raw material prices are major challenges. Stricter regulatory requirements regarding sensor accuracy and reliability also pose challenges for manufacturers. The high upfront investment required for research and development can be a barrier for smaller companies. These challenges, if not addressed, could slow down the projected growth rate by approximately xx% by 2033.
Emerging Opportunities in Ultra Thin Ambient Light Sensors
Emerging opportunities lie in the growing adoption of ultra-thin ambient light sensors in augmented reality (AR) and virtual reality (VR) devices, smart home applications, and advanced driver-assistance systems (ADAS). The expansion into emerging markets and the development of specialized sensors for niche applications also present significant opportunities. The integration of ultra-thin ambient light sensors with other sensors to create multi-sensor solutions is an area of potential growth.
Growth Accelerators in the Ultra Thin Ambient Light Sensors Industry
Technological breakthroughs in sensor materials and manufacturing processes, coupled with strategic partnerships and mergers & acquisitions, are key accelerators. Expanding into new markets and developing innovative applications, such as integration into wearable health monitors, will further boost growth. Increased investment in R&D and the development of more sophisticated sensor functionalities are also expected to fuel market expansion.
Key Players Shaping the Ultra Thin Ambient Light Sensors Market
- Texas Instruments
- ams AG
- ON Semiconductor Corporation
- Broadcom Limited
- Rohm Semiconductor USA
- OSRAM Opto Semiconductor
- Intersil
- ADI (Maxim Integrated)
- Panasonic Corporation
- Vishay Semiconductor
- Elan Microelectronics Corp
Notable Milestones in Ultra Thin Ambient Light Sensors Sector
- 2020: Texas Instruments launched its new ultra-low-power ambient light sensor.
- 2021: ams AG acquired a smaller sensor company, expanding its product portfolio.
- 2022: Significant advancements in miniaturization technology led to the development of even thinner sensors.
- 2023: Increased adoption of ultra-thin sensors in automotive applications.
- 2024: New regulations regarding energy efficiency in consumer electronics boosted demand.
In-Depth Ultra Thin Ambient Light Sensors Market Outlook
The ultra-thin ambient light sensor market is poised for sustained growth, driven by continuous technological advancements, expanding applications, and increasing demand across diverse end-use sectors. Strategic partnerships and investments in R&D will further fuel market expansion. The increasing integration of these sensors into diverse IoT and consumer electronics applications presents significant opportunities for manufacturers and investors, promising a positive outlook for the coming decade.
Ultra Thin Ambient Light Sensors Segmentation
-
1. Application
- 1.1. Consumer Electronics
- 1.2. Automotive
- 1.3. Robotics
- 1.4. Medical Devices
- 1.5. Security Lighting
- 1.6. Others
-
2. Type
- 2.1. By Sensor Type
- 2.2. By Mounting Style
Ultra Thin Ambient Light Sensors Segmentation By Geography
-
1. North America
- 1.1. United States
- 1.2. Canada
- 1.3. Mexico
-
2. South America
- 2.1. Brazil
- 2.2. Argentina
- 2.3. Rest of South America
-
3. Europe
- 3.1. United Kingdom
- 3.2. Germany
- 3.3. France
- 3.4. Italy
- 3.5. Spain
- 3.6. Russia
- 3.7. Benelux
- 3.8. Nordics
- 3.9. Rest of Europe
-
4. Middle East & Africa
- 4.1. Turkey
- 4.2. Israel
- 4.3. GCC
- 4.4. North Africa
- 4.5. South Africa
- 4.6. Rest of Middle East & Africa
-
5. Asia Pacific
- 5.1. China
- 5.2. India
- 5.3. Japan
- 5.4. South Korea
- 5.5. ASEAN
- 5.6. Oceania
- 5.7. Rest of Asia Pacific
Ultra Thin Ambient Light Sensors REPORT HIGHLIGHTS
| Aspects | Details |
|---|---|
| Study Period | 2019-2033 |
| Base Year | 2024 |
| Estimated Year | 2025 |
| Forecast Period | 2025-2033 |
| Historical Period | 2019-2024 |
| Growth Rate | CAGR of XXX% from 2019-2033 |
| Segmentation |
|
Table of Contents
- 1. Introduction
- 1.1. Research Scope
- 1.2. Market Segmentation
- 1.3. Research Methodology
- 1.4. Definitions and Assumptions
- 2. Executive Summary
- 2.1. Introduction
- 3. Market Dynamics
- 3.1. Introduction
- 3.2. Market Drivers
- 3.3. Market Restrains
- 3.4. Market Trends
- 4. Market Factor Analysis
- 4.1. Porters Five Forces
- 4.2. Supply/Value Chain
- 4.3. PESTEL analysis
- 4.4. Market Entropy
- 4.5. Patent/Trademark Analysis
- 5. Global Ultra Thin Ambient Light Sensors Analysis, Insights and Forecast, 2019-2031
- 5.1. Market Analysis, Insights and Forecast - by Application
- 5.1.1. Consumer Electronics
- 5.1.2. Automotive
- 5.1.3. Robotics
- 5.1.4. Medical Devices
- 5.1.5. Security Lighting
- 5.1.6. Others
- 5.2. Market Analysis, Insights and Forecast - by Type
- 5.2.1. By Sensor Type
- 5.2.2. By Mounting Style
- 5.3. Market Analysis, Insights and Forecast - by Region
- 5.3.1. North America
- 5.3.2. South America
- 5.3.3. Europe
- 5.3.4. Middle East & Africa
- 5.3.5. Asia Pacific
- 5.1. Market Analysis, Insights and Forecast - by Application
- 6. North America Ultra Thin Ambient Light Sensors Analysis, Insights and Forecast, 2019-2031
- 6.1. Market Analysis, Insights and Forecast - by Application
- 6.1.1. Consumer Electronics
- 6.1.2. Automotive
- 6.1.3. Robotics
- 6.1.4. Medical Devices
- 6.1.5. Security Lighting
- 6.1.6. Others
- 6.2. Market Analysis, Insights and Forecast - by Type
- 6.2.1. By Sensor Type
- 6.2.2. By Mounting Style
- 6.1. Market Analysis, Insights and Forecast - by Application
- 7. South America Ultra Thin Ambient Light Sensors Analysis, Insights and Forecast, 2019-2031
- 7.1. Market Analysis, Insights and Forecast - by Application
- 7.1.1. Consumer Electronics
- 7.1.2. Automotive
- 7.1.3. Robotics
- 7.1.4. Medical Devices
- 7.1.5. Security Lighting
- 7.1.6. Others
- 7.2. Market Analysis, Insights and Forecast - by Type
- 7.2.1. By Sensor Type
- 7.2.2. By Mounting Style
- 7.1. Market Analysis, Insights and Forecast - by Application
- 8. Europe Ultra Thin Ambient Light Sensors Analysis, Insights and Forecast, 2019-2031
- 8.1. Market Analysis, Insights and Forecast - by Application
- 8.1.1. Consumer Electronics
- 8.1.2. Automotive
- 8.1.3. Robotics
- 8.1.4. Medical Devices
- 8.1.5. Security Lighting
- 8.1.6. Others
- 8.2. Market Analysis, Insights and Forecast - by Type
- 8.2.1. By Sensor Type
- 8.2.2. By Mounting Style
- 8.1. Market Analysis, Insights and Forecast - by Application
- 9. Middle East & Africa Ultra Thin Ambient Light Sensors Analysis, Insights and Forecast, 2019-2031
- 9.1. Market Analysis, Insights and Forecast - by Application
- 9.1.1. Consumer Electronics
- 9.1.2. Automotive
- 9.1.3. Robotics
- 9.1.4. Medical Devices
- 9.1.5. Security Lighting
- 9.1.6. Others
- 9.2. Market Analysis, Insights and Forecast - by Type
- 9.2.1. By Sensor Type
- 9.2.2. By Mounting Style
- 9.1. Market Analysis, Insights and Forecast - by Application
- 10. Asia Pacific Ultra Thin Ambient Light Sensors Analysis, Insights and Forecast, 2019-2031
- 10.1. Market Analysis, Insights and Forecast - by Application
- 10.1.1. Consumer Electronics
- 10.1.2. Automotive
- 10.1.3. Robotics
- 10.1.4. Medical Devices
- 10.1.5. Security Lighting
- 10.1.6. Others
- 10.2. Market Analysis, Insights and Forecast - by Type
- 10.2.1. By Sensor Type
- 10.2.2. By Mounting Style
- 10.1. Market Analysis, Insights and Forecast - by Application
- 11. Competitive Analysis
- 11.1. Global Market Share Analysis 2024
- 11.2. Company Profiles
- 11.2.1 Texas Instruments
- 11.2.1.1. Overview
- 11.2.1.2. Products
- 11.2.1.3. SWOT Analysis
- 11.2.1.4. Recent Developments
- 11.2.1.5. Financials (Based on Availability)
- 11.2.2 ams AG
- 11.2.2.1. Overview
- 11.2.2.2. Products
- 11.2.2.3. SWOT Analysis
- 11.2.2.4. Recent Developments
- 11.2.2.5. Financials (Based on Availability)
- 11.2.3 ON Semiconductor Corporation
- 11.2.3.1. Overview
- 11.2.3.2. Products
- 11.2.3.3. SWOT Analysis
- 11.2.3.4. Recent Developments
- 11.2.3.5. Financials (Based on Availability)
- 11.2.4 Broadcom Limited
- 11.2.4.1. Overview
- 11.2.4.2. Products
- 11.2.4.3. SWOT Analysis
- 11.2.4.4. Recent Developments
- 11.2.4.5. Financials (Based on Availability)
- 11.2.5 Rohm Semiconductor USA
- 11.2.5.1. Overview
- 11.2.5.2. Products
- 11.2.5.3. SWOT Analysis
- 11.2.5.4. Recent Developments
- 11.2.5.5. Financials (Based on Availability)
- 11.2.6 OSRAM Opto Semiconductor
- 11.2.6.1. Overview
- 11.2.6.2. Products
- 11.2.6.3. SWOT Analysis
- 11.2.6.4. Recent Developments
- 11.2.6.5. Financials (Based on Availability)
- 11.2.7 Intersil
- 11.2.7.1. Overview
- 11.2.7.2. Products
- 11.2.7.3. SWOT Analysis
- 11.2.7.4. Recent Developments
- 11.2.7.5. Financials (Based on Availability)
- 11.2.8 ADI(Maxim Integrated)
- 11.2.8.1. Overview
- 11.2.8.2. Products
- 11.2.8.3. SWOT Analysis
- 11.2.8.4. Recent Developments
- 11.2.8.5. Financials (Based on Availability)
- 11.2.9 Panasonic Corporation
- 11.2.9.1. Overview
- 11.2.9.2. Products
- 11.2.9.3. SWOT Analysis
- 11.2.9.4. Recent Developments
- 11.2.9.5. Financials (Based on Availability)
- 11.2.10 Vishay Semiconductor
- 11.2.10.1. Overview
- 11.2.10.2. Products
- 11.2.10.3. SWOT Analysis
- 11.2.10.4. Recent Developments
- 11.2.10.5. Financials (Based on Availability)
- 11.2.11 Elan Microelectronics Corp
- 11.2.11.1. Overview
- 11.2.11.2. Products
- 11.2.11.3. SWOT Analysis
- 11.2.11.4. Recent Developments
- 11.2.11.5. Financials (Based on Availability)
- 11.2.1 Texas Instruments
List of Figures
- Figure 1: Global Ultra Thin Ambient Light Sensors Revenue Breakdown (million, %) by Region 2024 & 2032
- Figure 2: North America Ultra Thin Ambient Light Sensors Revenue (million), by Application 2024 & 2032
- Figure 3: North America Ultra Thin Ambient Light Sensors Revenue Share (%), by Application 2024 & 2032
- Figure 4: North America Ultra Thin Ambient Light Sensors Revenue (million), by Type 2024 & 2032
- Figure 5: North America Ultra Thin Ambient Light Sensors Revenue Share (%), by Type 2024 & 2032
- Figure 6: North America Ultra Thin Ambient Light Sensors Revenue (million), by Country 2024 & 2032
- Figure 7: North America Ultra Thin Ambient Light Sensors Revenue Share (%), by Country 2024 & 2032
- Figure 8: South America Ultra Thin Ambient Light Sensors Revenue (million), by Application 2024 & 2032
- Figure 9: South America Ultra Thin Ambient Light Sensors Revenue Share (%), by Application 2024 & 2032
- Figure 10: South America Ultra Thin Ambient Light Sensors Revenue (million), by Type 2024 & 2032
- Figure 11: South America Ultra Thin Ambient Light Sensors Revenue Share (%), by Type 2024 & 2032
- Figure 12: South America Ultra Thin Ambient Light Sensors Revenue (million), by Country 2024 & 2032
- Figure 13: South America Ultra Thin Ambient Light Sensors Revenue Share (%), by Country 2024 & 2032
- Figure 14: Europe Ultra Thin Ambient Light Sensors Revenue (million), by Application 2024 & 2032
- Figure 15: Europe Ultra Thin Ambient Light Sensors Revenue Share (%), by Application 2024 & 2032
- Figure 16: Europe Ultra Thin Ambient Light Sensors Revenue (million), by Type 2024 & 2032
- Figure 17: Europe Ultra Thin Ambient Light Sensors Revenue Share (%), by Type 2024 & 2032
- Figure 18: Europe Ultra Thin Ambient Light Sensors Revenue (million), by Country 2024 & 2032
- Figure 19: Europe Ultra Thin Ambient Light Sensors Revenue Share (%), by Country 2024 & 2032
- Figure 20: Middle East & Africa Ultra Thin Ambient Light Sensors Revenue (million), by Application 2024 & 2032
- Figure 21: Middle East & Africa Ultra Thin Ambient Light Sensors Revenue Share (%), by Application 2024 & 2032
- Figure 22: Middle East & Africa Ultra Thin Ambient Light Sensors Revenue (million), by Type 2024 & 2032
- Figure 23: Middle East & Africa Ultra Thin Ambient Light Sensors Revenue Share (%), by Type 2024 & 2032
- Figure 24: Middle East & Africa Ultra Thin Ambient Light Sensors Revenue (million), by Country 2024 & 2032
- Figure 25: Middle East & Africa Ultra Thin Ambient Light Sensors Revenue Share (%), by Country 2024 & 2032
- Figure 26: Asia Pacific Ultra Thin Ambient Light Sensors Revenue (million), by Application 2024 & 2032
- Figure 27: Asia Pacific Ultra Thin Ambient Light Sensors Revenue Share (%), by Application 2024 & 2032
- Figure 28: Asia Pacific Ultra Thin Ambient Light Sensors Revenue (million), by Type 2024 & 2032
- Figure 29: Asia Pacific Ultra Thin Ambient Light Sensors Revenue Share (%), by Type 2024 & 2032
- Figure 30: Asia Pacific Ultra Thin Ambient Light Sensors Revenue (million), by Country 2024 & 2032
- Figure 31: Asia Pacific Ultra Thin Ambient Light Sensors Revenue Share (%), by Country 2024 & 2032
List of Tables
- Table 1: Global Ultra Thin Ambient Light Sensors Revenue million Forecast, by Region 2019 & 2032
- Table 2: Global Ultra Thin Ambient Light Sensors Revenue million Forecast, by Application 2019 & 2032
- Table 3: Global Ultra Thin Ambient Light Sensors Revenue million Forecast, by Type 2019 & 2032
- Table 4: Global Ultra Thin Ambient Light Sensors Revenue million Forecast, by Region 2019 & 2032
- Table 5: Global Ultra Thin Ambient Light Sensors Revenue million Forecast, by Application 2019 & 2032
- Table 6: Global Ultra Thin Ambient Light Sensors Revenue million Forecast, by Type 2019 & 2032
- Table 7: Global Ultra Thin Ambient Light Sensors Revenue million Forecast, by Country 2019 & 2032
- Table 8: United States Ultra Thin Ambient Light Sensors Revenue (million) Forecast, by Application 2019 & 2032
- Table 9: Canada Ultra Thin Ambient Light Sensors Revenue (million) Forecast, by Application 2019 & 2032
- Table 10: Mexico Ultra Thin Ambient Light Sensors Revenue (million) Forecast, by Application 2019 & 2032
- Table 11: Global Ultra Thin Ambient Light Sensors Revenue million Forecast, by Application 2019 & 2032
- Table 12: Global Ultra Thin Ambient Light Sensors Revenue million Forecast, by Type 2019 & 2032
- Table 13: Global Ultra Thin Ambient Light Sensors Revenue million Forecast, by Country 2019 & 2032
- Table 14: Brazil Ultra Thin Ambient Light Sensors Revenue (million) Forecast, by Application 2019 & 2032
- Table 15: Argentina Ultra Thin Ambient Light Sensors Revenue (million) Forecast, by Application 2019 & 2032
- Table 16: Rest of South America Ultra Thin Ambient Light Sensors Revenue (million) Forecast, by Application 2019 & 2032
- Table 17: Global Ultra Thin Ambient Light Sensors Revenue million Forecast, by Application 2019 & 2032
- Table 18: Global Ultra Thin Ambient Light Sensors Revenue million Forecast, by Type 2019 & 2032
- Table 19: Global Ultra Thin Ambient Light Sensors Revenue million Forecast, by Country 2019 & 2032
- Table 20: United Kingdom Ultra Thin Ambient Light Sensors Revenue (million) Forecast, by Application 2019 & 2032
- Table 21: Germany Ultra Thin Ambient Light Sensors Revenue (million) Forecast, by Application 2019 & 2032
- Table 22: France Ultra Thin Ambient Light Sensors Revenue (million) Forecast, by Application 2019 & 2032
- Table 23: Italy Ultra Thin Ambient Light Sensors Revenue (million) Forecast, by Application 2019 & 2032
- Table 24: Spain Ultra Thin Ambient Light Sensors Revenue (million) Forecast, by Application 2019 & 2032
- Table 25: Russia Ultra Thin Ambient Light Sensors Revenue (million) Forecast, by Application 2019 & 2032
- Table 26: Benelux Ultra Thin Ambient Light Sensors Revenue (million) Forecast, by Application 2019 & 2032
- Table 27: Nordics Ultra Thin Ambient Light Sensors Revenue (million) Forecast, by Application 2019 & 2032
- Table 28: Rest of Europe Ultra Thin Ambient Light Sensors Revenue (million) Forecast, by Application 2019 & 2032
- Table 29: Global Ultra Thin Ambient Light Sensors Revenue million Forecast, by Application 2019 & 2032
- Table 30: Global Ultra Thin Ambient Light Sensors Revenue million Forecast, by Type 2019 & 2032
- Table 31: Global Ultra Thin Ambient Light Sensors Revenue million Forecast, by Country 2019 & 2032
- Table 32: Turkey Ultra Thin Ambient Light Sensors Revenue (million) Forecast, by Application 2019 & 2032
- Table 33: Israel Ultra Thin Ambient Light Sensors Revenue (million) Forecast, by Application 2019 & 2032
- Table 34: GCC Ultra Thin Ambient Light Sensors Revenue (million) Forecast, by Application 2019 & 2032
- Table 35: North Africa Ultra Thin Ambient Light Sensors Revenue (million) Forecast, by Application 2019 & 2032
- Table 36: South Africa Ultra Thin Ambient Light Sensors Revenue (million) Forecast, by Application 2019 & 2032
- Table 37: Rest of Middle East & Africa Ultra Thin Ambient Light Sensors Revenue (million) Forecast, by Application 2019 & 2032
- Table 38: Global Ultra Thin Ambient Light Sensors Revenue million Forecast, by Application 2019 & 2032
- Table 39: Global Ultra Thin Ambient Light Sensors Revenue million Forecast, by Type 2019 & 2032
- Table 40: Global Ultra Thin Ambient Light Sensors Revenue million Forecast, by Country 2019 & 2032
- Table 41: China Ultra Thin Ambient Light Sensors Revenue (million) Forecast, by Application 2019 & 2032
- Table 42: India Ultra Thin Ambient Light Sensors Revenue (million) Forecast, by Application 2019 & 2032
- Table 43: Japan Ultra Thin Ambient Light Sensors Revenue (million) Forecast, by Application 2019 & 2032
- Table 44: South Korea Ultra Thin Ambient Light Sensors Revenue (million) Forecast, by Application 2019 & 2032
- Table 45: ASEAN Ultra Thin Ambient Light Sensors Revenue (million) Forecast, by Application 2019 & 2032
- Table 46: Oceania Ultra Thin Ambient Light Sensors Revenue (million) Forecast, by Application 2019 & 2032
- Table 47: Rest of Asia Pacific Ultra Thin Ambient Light Sensors Revenue (million) Forecast, by Application 2019 & 2032
Frequently Asked Questions
1. What is the projected Compound Annual Growth Rate (CAGR) of the Ultra Thin Ambient Light Sensors?
The projected CAGR is approximately XXX%.
2. Which companies are prominent players in the Ultra Thin Ambient Light Sensors?
Key companies in the market include Texas Instruments, ams AG, ON Semiconductor Corporation, Broadcom Limited, Rohm Semiconductor USA, OSRAM Opto Semiconductor, Intersil, ADI(Maxim Integrated), Panasonic Corporation, Vishay Semiconductor, Elan Microelectronics Corp.
3. What are the main segments of the Ultra Thin Ambient Light Sensors?
The market segments include Application, Type.
4. Can you provide details about the market size?
The market size is estimated to be USD XXX million as of 2022.
5. What are some drivers contributing to market growth?
N/A
6. What are the notable trends driving market growth?
N/A
7. Are there any restraints impacting market growth?
N/A
8. Can you provide examples of recent developments in the market?
N/A
9. What pricing options are available for accessing the report?
Pricing options include single-user, multi-user, and enterprise licenses priced at USD 2900.00, USD 4350.00, and USD 5800.00 respectively.
10. Is the market size provided in terms of value or volume?
The market size is provided in terms of value, measured in million.
11. Are there any specific market keywords associated with the report?
Yes, the market keyword associated with the report is "Ultra Thin Ambient Light Sensors," which aids in identifying and referencing the specific market segment covered.
12. How do I determine which pricing option suits my needs best?
The pricing options vary based on user requirements and access needs. Individual users may opt for single-user licenses, while businesses requiring broader access may choose multi-user or enterprise licenses for cost-effective access to the report.
13. Are there any additional resources or data provided in the Ultra Thin Ambient Light Sensors report?
While the report offers comprehensive insights, it's advisable to review the specific contents or supplementary materials provided to ascertain if additional resources or data are available.
14. How can I stay updated on further developments or reports in the Ultra Thin Ambient Light Sensors?
To stay informed about further developments, trends, and reports in the Ultra Thin Ambient Light Sensors, consider subscribing to industry newsletters, following relevant companies and organizations, or regularly checking reputable industry news sources and publications.
Methodology
Step 1 - Identification of Relevant Samples Size from Population Database


Step 2 - Approaches for Defining Global Market Size (Value, Volume* & Price*)

Note*: In applicable scenarios
Step 3 - Data Sources
Primary Research
- Web Analytics
- Survey Reports
- Research Institute
- Latest Research Reports
- Opinion Leaders
Secondary Research
- Annual Reports
- White Paper
- Latest Press Release
- Industry Association
- Paid Database
- Investor Presentations

Step 4 - Data Triangulation
Involves using different sources of information in order to increase the validity of a study
These sources are likely to be stakeholders in a program - participants, other researchers, program staff, other community members, and so on.
Then we put all data in single framework & apply various statistical tools to find out the dynamic on the market.
During the analysis stage, feedback from the stakeholder groups would be compared to determine areas of agreement as well as areas of divergence


