
Key Insights
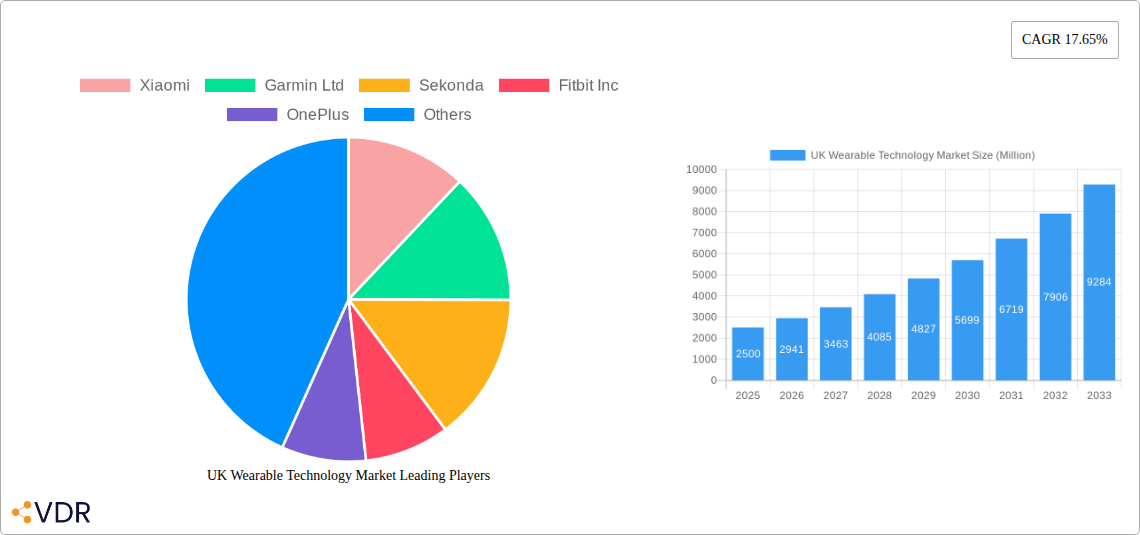
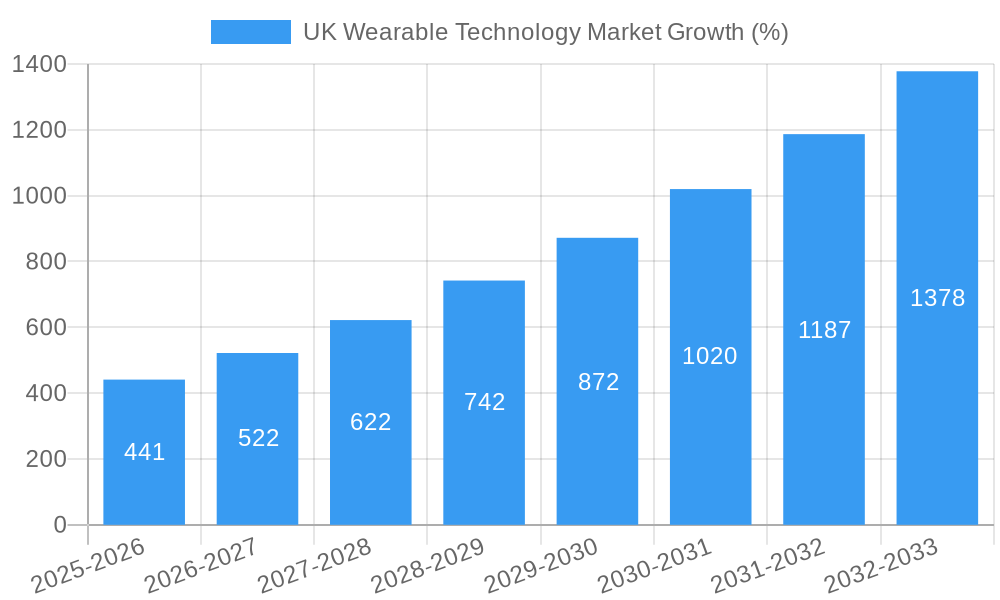
The UK wearable technology market, currently experiencing robust growth, is projected to maintain a significant Compound Annual Growth Rate (CAGR) of 17.65% from 2025 to 2033. This expansion is driven by several key factors. Increased consumer awareness of health and fitness, coupled with the affordability and accessibility of advanced wearable devices like smartwatches, fitness trackers, and hearables, are primary catalysts. The market's segmentation, encompassing smartwatches, head-mounted displays, wristbands, earwearables, and smart clothing, reflects the diverse applications of wearable technology. Technological advancements leading to enhanced features such as improved battery life, more accurate health monitoring capabilities (sleep tracking, heart rate monitoring, ECG), and seamless smartphone integration further fuel market growth. The rising adoption of smartwatches and fitness trackers amongst various demographics, from young adults to older generations, contributes to the market's expansion. Competition among major players like Apple, Samsung, Fitbit, and Garmin, driving innovation and price competitiveness, also benefits consumers.
However, challenges remain. Concerns about data privacy and security related to the collection of personal health data are significant. Furthermore, the relatively high cost of premium wearable devices can limit market penetration, particularly among price-sensitive consumers. The market also faces the constant pressure to innovate and offer new features that justify the cost and enhance user experience. Nevertheless, the overall trajectory for the UK wearable technology market remains positive, with strong potential for growth throughout the forecast period. The market's evolution is expected to see further integration of Artificial Intelligence (AI) and Machine Learning (ML) for personalized health insights and a broadening of the range of applications, extending beyond fitness into areas like healthcare monitoring and augmented reality.
UK Wearable Technology Market: A Comprehensive Report (2019-2033)
This comprehensive report provides an in-depth analysis of the UK wearable technology market, encompassing market dynamics, growth trends, dominant segments, and key players. With a study period spanning 2019-2033, a base year of 2025, and a forecast period of 2025-2033, this report is an invaluable resource for industry professionals, investors, and strategists seeking to understand and capitalize on this rapidly evolving market. The report utilizes data from the historical period (2019-2024) to provide a robust foundation for future projections. The market is segmented by device type: Smart Watches, Head-mounted Displays, Wristbands, Ear-wearables, and Other Device Types (Smart Clothing). Key players analyzed include Xiaomi, Garmin Ltd, Sekonda, Fitbit Inc, OnePlus, Honor Device Co Ltd, Huawei Technologies Co Ltd, Fossil Group Inc, Apple Inc, and Samsung. The total UK Wearable Technology market size in 2025 is estimated at xx Million units.
UK Wearable Technology Market Dynamics & Structure
The UK wearable technology market exhibits a moderately concentrated structure, with a few major players holding significant market share, but also featuring a growing number of smaller, specialized companies. Technological innovation, particularly in areas like health monitoring, augmented reality, and improved battery life, are key growth drivers. Regulatory frameworks concerning data privacy and product safety are shaping market practices, while competitive product substitutes (e.g., traditional fitness trackers) impact market penetration. End-user demographics show a strong correlation between adoption and age, with younger generations showing higher rates of adoption. Mergers and acquisitions (M&A) activity is moderately high, with larger companies seeking to expand their product portfolios and market reach through acquisitions of smaller, innovative firms.
- Market Concentration: Moderately concentrated, with top 5 players holding approximately xx% market share in 2025.
- Technological Innovation: Focus on improved sensors, longer battery life, and AI-powered features.
- Regulatory Framework: Stringent data privacy regulations influence product development and data handling.
- Competitive Substitutes: Traditional fitness trackers and other health monitoring devices offer some level of competition.
- End-User Demographics: High adoption rates among young adults (18-35 years), and increasing adoption among older demographics.
- M&A Trends: Increased M&A activity, primarily focused on acquiring smaller specialized companies with innovative technologies.
UK Wearable Technology Market Growth Trends & Insights
The UK wearable technology market has experienced significant growth over the past few years, driven by factors such as increasing health consciousness, technological advancements, and falling prices. The market is projected to maintain a strong CAGR (Compound Annual Growth Rate) of xx% during the forecast period (2025-2033), reaching an estimated xx Million units by 2033. Adoption rates are highest for smartwatches and wristbands, with significant growth potential observed in ear-wearables and smart clothing segments. Technological disruptions, particularly in areas such as miniaturization, improved sensor technology, and AI-powered health analysis, are key factors driving market expansion. Consumer behavior is shifting toward preference for multi-functional devices with seamless integration with smartphones and other smart devices.
Dominant Regions, Countries, or Segments in UK Wearable Technology Market
The South East of England is the leading region for wearable technology adoption and market growth in the UK, driven by higher disposable incomes, strong tech infrastructure, and early adoption of new technologies. Among device types, smartwatches represent the dominant segment, capturing the highest market share (xx%) in 2025. This is fueled by factors such as their multi-functionality and increased sophistication.
- Key Drivers for South East England: High disposable income, advanced tech infrastructure, early adopter population.
- Smartwatch Dominance: High functionality (fitness tracking, notifications, payments), fashion appeal, and brand recognition drive smartwatch adoption.
- Growth Potential: Ear-wearables and smart clothing segments show significant growth potential due to innovation and rising consumer interest.
UK Wearable Technology Market Product Landscape
The UK wearable technology market showcases a diverse range of products, spanning basic fitness trackers to sophisticated smartwatches offering comprehensive health monitoring and advanced communication features. Product innovations include improved accuracy in health sensors (e.g., heart rate, sleep tracking), longer battery life, enhanced water resistance, and sleek, stylish designs. Key technological advancements include the integration of AI for personalized health insights, and the incorporation of advanced materials for increased comfort and durability. Unique selling propositions often centre around features like seamless smartphone integration, user-friendly interfaces, and sophisticated health monitoring functionalities.
Key Drivers, Barriers & Challenges in UK Wearable Technology Market
Key Drivers: Increased health awareness, technological advancements leading to improved functionality and affordability, growing smartphone penetration facilitating seamless integration.
Key Challenges: Concerns regarding data privacy and security, battery life limitations, high initial investment costs for advanced devices, and intense competition among established brands and new entrants, creating pricing pressures. These factors could impede market growth by xx% by 2030 if not properly addressed.
Emerging Opportunities in UK Wearable Technology Market
Emerging opportunities lie in the development of specialized wearables for specific sectors like healthcare (remote patient monitoring), industrial applications (worker safety), and the elderly care sector. Innovative applications such as augmented reality overlays for navigation and fitness training present exciting possibilities. The increasing demand for personalized experiences is creating opportunities for customized wearable solutions tailored to individual needs and preferences.
Growth Accelerators in the UK Wearable Technology Market Industry
Technological breakthroughs in areas like flexible displays, advanced bio-sensors, and energy-efficient chipsets are key catalysts for long-term growth. Strategic partnerships between technology companies and healthcare providers are accelerating the development and adoption of medical-grade wearables. Market expansion strategies focused on reaching niche markets and underserved populations will further drive growth.
Key Players Shaping the UK Wearable Technology Market Market
- Xiaomi
- Garmin Ltd
- Sekonda
- Fitbit Inc
- OnePlus
- Honor Device Co Ltd
- Huawei Technologies Co Ltd
- Fossil Group Inc
- Apple Inc
- Samsung
Notable Milestones in UK Wearable Technology Market Sector
- September 2021: Swansea University's development of wearable technology with printed carbon ink heaters for British athletes in Tokyo Olympics showcases innovation in sports technology.
- July 2021: Magic Leap 2 mixed reality headset launch in the UK signifies the growing importance of advanced wearables in professional settings.
In-Depth UK Wearable Technology Market Market Outlook
The UK wearable technology market is poised for sustained growth, driven by continuous technological innovation, increasing consumer demand, and the expansion into new application areas. Strategic partnerships and investments in research and development will be key to unlocking the full potential of this market. The focus on data privacy and security will also shape future product development and market dynamics, presenting both challenges and opportunities for growth. The market's future hinges on addressing user concerns regarding battery life and data privacy while simultaneously driving down costs and enhancing device functionalities.
UK Wearable Technology Market Segmentation
-
1. Type of Device
- 1.1. Smart Watches
- 1.2. Head-mounted Displays
- 1.3. Wristbands
- 1.4. Ear-wearables
- 1.5. Other Device Types (Smart Clothing)
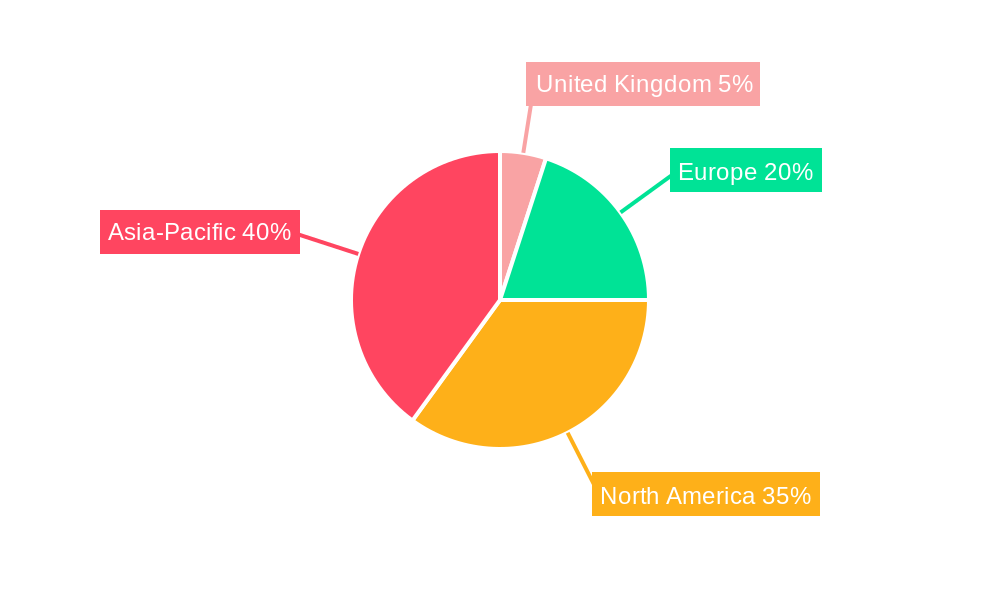
UK Wearable Technology Market Segmentation By Geography
-
1. North America
- 1.1. United States
- 1.2. Canada
- 1.3. Mexico
-
2. South America
- 2.1. Brazil
- 2.2. Argentina
- 2.3. Rest of South America
-
3. Europe
- 3.1. United Kingdom
- 3.2. Germany
- 3.3. France
- 3.4. Italy
- 3.5. Spain
- 3.6. Russia
- 3.7. Benelux
- 3.8. Nordics
- 3.9. Rest of Europe
-
4. Middle East & Africa
- 4.1. Turkey
- 4.2. Israel
- 4.3. GCC
- 4.4. North Africa
- 4.5. South Africa
- 4.6. Rest of Middle East & Africa
-
5. Asia Pacific
- 5.1. China
- 5.2. India
- 5.3. Japan
- 5.4. South Korea
- 5.5. ASEAN
- 5.6. Oceania
- 5.7. Rest of Asia Pacific
UK Wearable Technology Market REPORT HIGHLIGHTS
| Aspects | Details |
|---|---|
| Study Period | 2019-2033 |
| Base Year | 2024 |
| Estimated Year | 2025 |
| Forecast Period | 2025-2033 |
| Historical Period | 2019-2024 |
| Growth Rate | CAGR of 17.65% from 2019-2033 |
| Segmentation |
|
Table of Contents
- 1. Introduction
- 1.1. Research Scope
- 1.2. Market Segmentation
- 1.3. Research Methodology
- 1.4. Definitions and Assumptions
- 2. Executive Summary
- 2.1. Introduction
- 3. Market Dynamics
- 3.1. Introduction
- 3.2. Market Drivers
- 3.2.1. Increasing Technological Advancements in the Wearables Market; Increase in Health Awareness among the Consumers
- 3.3. Market Restrains
- 3.3.1. Fragmented Nature of the Market and the Growing Incidence of Data Breaches
- 3.4. Market Trends
- 3.4.1. Smartwatches to Witness Significant Growth
- 4. Market Factor Analysis
- 4.1. Porters Five Forces
- 4.2. Supply/Value Chain
- 4.3. PESTEL analysis
- 4.4. Market Entropy
- 4.5. Patent/Trademark Analysis
- 5. Global UK Wearable Technology Market Analysis, Insights and Forecast, 2019-2031
- 5.1. Market Analysis, Insights and Forecast - by Type of Device
- 5.1.1. Smart Watches
- 5.1.2. Head-mounted Displays
- 5.1.3. Wristbands
- 5.1.4. Ear-wearables
- 5.1.5. Other Device Types (Smart Clothing)
- 5.2. Market Analysis, Insights and Forecast - by Region
- 5.2.1. North America
- 5.2.2. South America
- 5.2.3. Europe
- 5.2.4. Middle East & Africa
- 5.2.5. Asia Pacific
- 5.1. Market Analysis, Insights and Forecast - by Type of Device
- 6. North America UK Wearable Technology Market Analysis, Insights and Forecast, 2019-2031
- 6.1. Market Analysis, Insights and Forecast - by Type of Device
- 6.1.1. Smart Watches
- 6.1.2. Head-mounted Displays
- 6.1.3. Wristbands
- 6.1.4. Ear-wearables
- 6.1.5. Other Device Types (Smart Clothing)
- 6.1. Market Analysis, Insights and Forecast - by Type of Device
- 7. South America UK Wearable Technology Market Analysis, Insights and Forecast, 2019-2031
- 7.1. Market Analysis, Insights and Forecast - by Type of Device
- 7.1.1. Smart Watches
- 7.1.2. Head-mounted Displays
- 7.1.3. Wristbands
- 7.1.4. Ear-wearables
- 7.1.5. Other Device Types (Smart Clothing)
- 7.1. Market Analysis, Insights and Forecast - by Type of Device
- 8. Europe UK Wearable Technology Market Analysis, Insights and Forecast, 2019-2031
- 8.1. Market Analysis, Insights and Forecast - by Type of Device
- 8.1.1. Smart Watches
- 8.1.2. Head-mounted Displays
- 8.1.3. Wristbands
- 8.1.4. Ear-wearables
- 8.1.5. Other Device Types (Smart Clothing)
- 8.1. Market Analysis, Insights and Forecast - by Type of Device
- 9. Middle East & Africa UK Wearable Technology Market Analysis, Insights and Forecast, 2019-2031
- 9.1. Market Analysis, Insights and Forecast - by Type of Device
- 9.1.1. Smart Watches
- 9.1.2. Head-mounted Displays
- 9.1.3. Wristbands
- 9.1.4. Ear-wearables
- 9.1.5. Other Device Types (Smart Clothing)
- 9.1. Market Analysis, Insights and Forecast - by Type of Device
- 10. Asia Pacific UK Wearable Technology Market Analysis, Insights and Forecast, 2019-2031
- 10.1. Market Analysis, Insights and Forecast - by Type of Device
- 10.1.1. Smart Watches
- 10.1.2. Head-mounted Displays
- 10.1.3. Wristbands
- 10.1.4. Ear-wearables
- 10.1.5. Other Device Types (Smart Clothing)
- 10.1. Market Analysis, Insights and Forecast - by Type of Device
- 11. England UK Wearable Technology Market Analysis, Insights and Forecast, 2019-2031
- 12. Wales UK Wearable Technology Market Analysis, Insights and Forecast, 2019-2031
- 13. Scotland UK Wearable Technology Market Analysis, Insights and Forecast, 2019-2031
- 14. Northern UK Wearable Technology Market Analysis, Insights and Forecast, 2019-2031
- 15. Ireland UK Wearable Technology Market Analysis, Insights and Forecast, 2019-2031
- 16. Competitive Analysis
- 16.1. Global Market Share Analysis 2024
- 16.2. Company Profiles
- 16.2.1 Xiaomi
- 16.2.1.1. Overview
- 16.2.1.2. Products
- 16.2.1.3. SWOT Analysis
- 16.2.1.4. Recent Developments
- 16.2.1.5. Financials (Based on Availability)
- 16.2.2 Garmin Ltd
- 16.2.2.1. Overview
- 16.2.2.2. Products
- 16.2.2.3. SWOT Analysis
- 16.2.2.4. Recent Developments
- 16.2.2.5. Financials (Based on Availability)
- 16.2.3 Sekonda
- 16.2.3.1. Overview
- 16.2.3.2. Products
- 16.2.3.3. SWOT Analysis
- 16.2.3.4. Recent Developments
- 16.2.3.5. Financials (Based on Availability)
- 16.2.4 Fitbit Inc
- 16.2.4.1. Overview
- 16.2.4.2. Products
- 16.2.4.3. SWOT Analysis
- 16.2.4.4. Recent Developments
- 16.2.4.5. Financials (Based on Availability)
- 16.2.5 OnePlus
- 16.2.5.1. Overview
- 16.2.5.2. Products
- 16.2.5.3. SWOT Analysis
- 16.2.5.4. Recent Developments
- 16.2.5.5. Financials (Based on Availability)
- 16.2.6 Honor Device Co Ltd
- 16.2.6.1. Overview
- 16.2.6.2. Products
- 16.2.6.3. SWOT Analysis
- 16.2.6.4. Recent Developments
- 16.2.6.5. Financials (Based on Availability)
- 16.2.7 Huawei Technologies Co Ltd
- 16.2.7.1. Overview
- 16.2.7.2. Products
- 16.2.7.3. SWOT Analysis
- 16.2.7.4. Recent Developments
- 16.2.7.5. Financials (Based on Availability)
- 16.2.8 Fossil Group Inc
- 16.2.8.1. Overview
- 16.2.8.2. Products
- 16.2.8.3. SWOT Analysis
- 16.2.8.4. Recent Developments
- 16.2.8.5. Financials (Based on Availability)
- 16.2.9 Apple Inc
- 16.2.9.1. Overview
- 16.2.9.2. Products
- 16.2.9.3. SWOT Analysis
- 16.2.9.4. Recent Developments
- 16.2.9.5. Financials (Based on Availability)
- 16.2.10 Samsung
- 16.2.10.1. Overview
- 16.2.10.2. Products
- 16.2.10.3. SWOT Analysis
- 16.2.10.4. Recent Developments
- 16.2.10.5. Financials (Based on Availability)
- 16.2.1 Xiaomi
List of Figures
- Figure 1: Global UK Wearable Technology Market Revenue Breakdown (Million, %) by Region 2024 & 2032
- Figure 2: United kingdom Region UK Wearable Technology Market Revenue (Million), by Country 2024 & 2032
- Figure 3: United kingdom Region UK Wearable Technology Market Revenue Share (%), by Country 2024 & 2032
- Figure 4: North America UK Wearable Technology Market Revenue (Million), by Type of Device 2024 & 2032
- Figure 5: North America UK Wearable Technology Market Revenue Share (%), by Type of Device 2024 & 2032
- Figure 6: North America UK Wearable Technology Market Revenue (Million), by Country 2024 & 2032
- Figure 7: North America UK Wearable Technology Market Revenue Share (%), by Country 2024 & 2032
- Figure 8: South America UK Wearable Technology Market Revenue (Million), by Type of Device 2024 & 2032
- Figure 9: South America UK Wearable Technology Market Revenue Share (%), by Type of Device 2024 & 2032
- Figure 10: South America UK Wearable Technology Market Revenue (Million), by Country 2024 & 2032
- Figure 11: South America UK Wearable Technology Market Revenue Share (%), by Country 2024 & 2032
- Figure 12: Europe UK Wearable Technology Market Revenue (Million), by Type of Device 2024 & 2032
- Figure 13: Europe UK Wearable Technology Market Revenue Share (%), by Type of Device 2024 & 2032
- Figure 14: Europe UK Wearable Technology Market Revenue (Million), by Country 2024 & 2032
- Figure 15: Europe UK Wearable Technology Market Revenue Share (%), by Country 2024 & 2032
- Figure 16: Middle East & Africa UK Wearable Technology Market Revenue (Million), by Type of Device 2024 & 2032
- Figure 17: Middle East & Africa UK Wearable Technology Market Revenue Share (%), by Type of Device 2024 & 2032
- Figure 18: Middle East & Africa UK Wearable Technology Market Revenue (Million), by Country 2024 & 2032
- Figure 19: Middle East & Africa UK Wearable Technology Market Revenue Share (%), by Country 2024 & 2032
- Figure 20: Asia Pacific UK Wearable Technology Market Revenue (Million), by Type of Device 2024 & 2032
- Figure 21: Asia Pacific UK Wearable Technology Market Revenue Share (%), by Type of Device 2024 & 2032
- Figure 22: Asia Pacific UK Wearable Technology Market Revenue (Million), by Country 2024 & 2032
- Figure 23: Asia Pacific UK Wearable Technology Market Revenue Share (%), by Country 2024 & 2032
List of Tables
- Table 1: Global UK Wearable Technology Market Revenue Million Forecast, by Region 2019 & 2032
- Table 2: Global UK Wearable Technology Market Revenue Million Forecast, by Type of Device 2019 & 2032
- Table 3: Global UK Wearable Technology Market Revenue Million Forecast, by Region 2019 & 2032
- Table 4: Global UK Wearable Technology Market Revenue Million Forecast, by Country 2019 & 2032
- Table 5: England UK Wearable Technology Market Revenue (Million) Forecast, by Application 2019 & 2032
- Table 6: Wales UK Wearable Technology Market Revenue (Million) Forecast, by Application 2019 & 2032
- Table 7: Scotland UK Wearable Technology Market Revenue (Million) Forecast, by Application 2019 & 2032
- Table 8: Northern UK Wearable Technology Market Revenue (Million) Forecast, by Application 2019 & 2032
- Table 9: Ireland UK Wearable Technology Market Revenue (Million) Forecast, by Application 2019 & 2032
- Table 10: Global UK Wearable Technology Market Revenue Million Forecast, by Type of Device 2019 & 2032
- Table 11: Global UK Wearable Technology Market Revenue Million Forecast, by Country 2019 & 2032
- Table 12: United States UK Wearable Technology Market Revenue (Million) Forecast, by Application 2019 & 2032
- Table 13: Canada UK Wearable Technology Market Revenue (Million) Forecast, by Application 2019 & 2032
- Table 14: Mexico UK Wearable Technology Market Revenue (Million) Forecast, by Application 2019 & 2032
- Table 15: Global UK Wearable Technology Market Revenue Million Forecast, by Type of Device 2019 & 2032
- Table 16: Global UK Wearable Technology Market Revenue Million Forecast, by Country 2019 & 2032
- Table 17: Brazil UK Wearable Technology Market Revenue (Million) Forecast, by Application 2019 & 2032
- Table 18: Argentina UK Wearable Technology Market Revenue (Million) Forecast, by Application 2019 & 2032
- Table 19: Rest of South America UK Wearable Technology Market Revenue (Million) Forecast, by Application 2019 & 2032
- Table 20: Global UK Wearable Technology Market Revenue Million Forecast, by Type of Device 2019 & 2032
- Table 21: Global UK Wearable Technology Market Revenue Million Forecast, by Country 2019 & 2032
- Table 22: United Kingdom UK Wearable Technology Market Revenue (Million) Forecast, by Application 2019 & 2032
- Table 23: Germany UK Wearable Technology Market Revenue (Million) Forecast, by Application 2019 & 2032
- Table 24: France UK Wearable Technology Market Revenue (Million) Forecast, by Application 2019 & 2032
- Table 25: Italy UK Wearable Technology Market Revenue (Million) Forecast, by Application 2019 & 2032
- Table 26: Spain UK Wearable Technology Market Revenue (Million) Forecast, by Application 2019 & 2032
- Table 27: Russia UK Wearable Technology Market Revenue (Million) Forecast, by Application 2019 & 2032
- Table 28: Benelux UK Wearable Technology Market Revenue (Million) Forecast, by Application 2019 & 2032
- Table 29: Nordics UK Wearable Technology Market Revenue (Million) Forecast, by Application 2019 & 2032
- Table 30: Rest of Europe UK Wearable Technology Market Revenue (Million) Forecast, by Application 2019 & 2032
- Table 31: Global UK Wearable Technology Market Revenue Million Forecast, by Type of Device 2019 & 2032
- Table 32: Global UK Wearable Technology Market Revenue Million Forecast, by Country 2019 & 2032
- Table 33: Turkey UK Wearable Technology Market Revenue (Million) Forecast, by Application 2019 & 2032
- Table 34: Israel UK Wearable Technology Market Revenue (Million) Forecast, by Application 2019 & 2032
- Table 35: GCC UK Wearable Technology Market Revenue (Million) Forecast, by Application 2019 & 2032
- Table 36: North Africa UK Wearable Technology Market Revenue (Million) Forecast, by Application 2019 & 2032
- Table 37: South Africa UK Wearable Technology Market Revenue (Million) Forecast, by Application 2019 & 2032
- Table 38: Rest of Middle East & Africa UK Wearable Technology Market Revenue (Million) Forecast, by Application 2019 & 2032
- Table 39: Global UK Wearable Technology Market Revenue Million Forecast, by Type of Device 2019 & 2032
- Table 40: Global UK Wearable Technology Market Revenue Million Forecast, by Country 2019 & 2032
- Table 41: China UK Wearable Technology Market Revenue (Million) Forecast, by Application 2019 & 2032
- Table 42: India UK Wearable Technology Market Revenue (Million) Forecast, by Application 2019 & 2032
- Table 43: Japan UK Wearable Technology Market Revenue (Million) Forecast, by Application 2019 & 2032
- Table 44: South Korea UK Wearable Technology Market Revenue (Million) Forecast, by Application 2019 & 2032
- Table 45: ASEAN UK Wearable Technology Market Revenue (Million) Forecast, by Application 2019 & 2032
- Table 46: Oceania UK Wearable Technology Market Revenue (Million) Forecast, by Application 2019 & 2032
- Table 47: Rest of Asia Pacific UK Wearable Technology Market Revenue (Million) Forecast, by Application 2019 & 2032
Frequently Asked Questions
1. What is the projected Compound Annual Growth Rate (CAGR) of the UK Wearable Technology Market?
The projected CAGR is approximately 17.65%.
2. Which companies are prominent players in the UK Wearable Technology Market?
Key companies in the market include Xiaomi, Garmin Ltd, Sekonda, Fitbit Inc, OnePlus, Honor Device Co Ltd, Huawei Technologies Co Ltd, Fossil Group Inc, Apple Inc, Samsung.
3. What are the main segments of the UK Wearable Technology Market?
The market segments include Type of Device.
4. Can you provide details about the market size?
The market size is estimated to be USD XX Million as of 2022.
5. What are some drivers contributing to market growth?
Increasing Technological Advancements in the Wearables Market; Increase in Health Awareness among the Consumers.
6. What are the notable trends driving market growth?
Smartwatches to Witness Significant Growth.
7. Are there any restraints impacting market growth?
Fragmented Nature of the Market and the Growing Incidence of Data Breaches.
8. Can you provide examples of recent developments in the market?
September 2021 - Swansea University announced that British athletes in Tokyo, including top medal winners, used wearable technology designed by them. The wearables were designed with a printed carbon ink heater to keep their muscles warm before competing. Swansea University's team made up of experts from the Welsh Centre for Printing and Coating (WCPC) and Applied Sports, Technology Exercise and Medicine (A-STEM), collaborated with the English Institute of Sport (EIS), Haydale, Screentec, and Newbury Electronics to develop this product.
9. What pricing options are available for accessing the report?
Pricing options include single-user, multi-user, and enterprise licenses priced at USD 3800, USD 4500, and USD 5800 respectively.
10. Is the market size provided in terms of value or volume?
The market size is provided in terms of value, measured in Million.
11. Are there any specific market keywords associated with the report?
Yes, the market keyword associated with the report is "UK Wearable Technology Market," which aids in identifying and referencing the specific market segment covered.
12. How do I determine which pricing option suits my needs best?
The pricing options vary based on user requirements and access needs. Individual users may opt for single-user licenses, while businesses requiring broader access may choose multi-user or enterprise licenses for cost-effective access to the report.
13. Are there any additional resources or data provided in the UK Wearable Technology Market report?
While the report offers comprehensive insights, it's advisable to review the specific contents or supplementary materials provided to ascertain if additional resources or data are available.
14. How can I stay updated on further developments or reports in the UK Wearable Technology Market?
To stay informed about further developments, trends, and reports in the UK Wearable Technology Market, consider subscribing to industry newsletters, following relevant companies and organizations, or regularly checking reputable industry news sources and publications.
Methodology
Step 1 - Identification of Relevant Samples Size from Population Database


Step 2 - Approaches for Defining Global Market Size (Value, Volume* & Price*)

Note*: In applicable scenarios
Step 3 - Data Sources
Primary Research
- Web Analytics
- Survey Reports
- Research Institute
- Latest Research Reports
- Opinion Leaders
Secondary Research
- Annual Reports
- White Paper
- Latest Press Release
- Industry Association
- Paid Database
- Investor Presentations

Step 4 - Data Triangulation
Involves using different sources of information in order to increase the validity of a study
These sources are likely to be stakeholders in a program - participants, other researchers, program staff, other community members, and so on.
Then we put all data in single framework & apply various statistical tools to find out the dynamic on the market.
During the analysis stage, feedback from the stakeholder groups would be compared to determine areas of agreement as well as areas of divergence


