
Key Insights
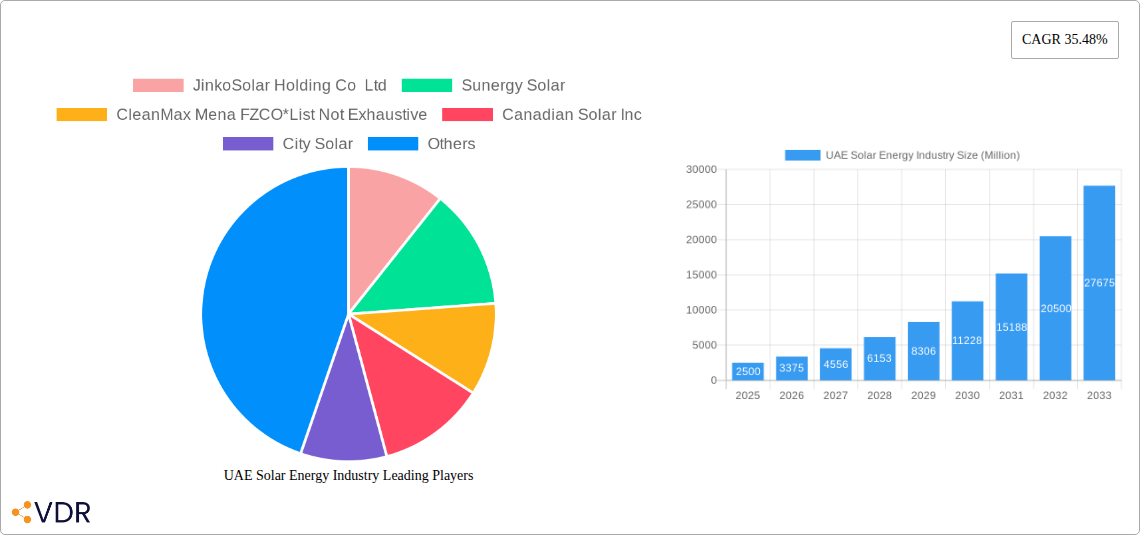
The UAE solar energy market is experiencing robust growth, driven by the government's ambitious renewable energy targets and the country's commitment to diversifying its energy sources. With a Compound Annual Growth Rate (CAGR) of 35.48% from 2019 to 2024, the market demonstrates significant potential. This expansion is fueled by several key factors: increasing electricity demand, favorable government policies including substantial subsidies and tax incentives, decreasing solar technology costs making it increasingly competitive with traditional energy sources, and a growing awareness of environmental sustainability among businesses and consumers. The market is segmented across various technologies, primarily photovoltaic (PV) and Concentrated Solar Power (CSP), and deployment types including utility-scale, commercial & industrial (C&I), and residential installations. Utility-scale projects are currently dominating the market share due to substantial government investment, but the C&I and residential segments are expected to witness accelerated growth in the coming years, driven by decreasing costs and increasing consumer adoption. Leading players like JinkoSolar, Canadian Solar, and Masdar are actively shaping the market landscape through large-scale projects and technological advancements.
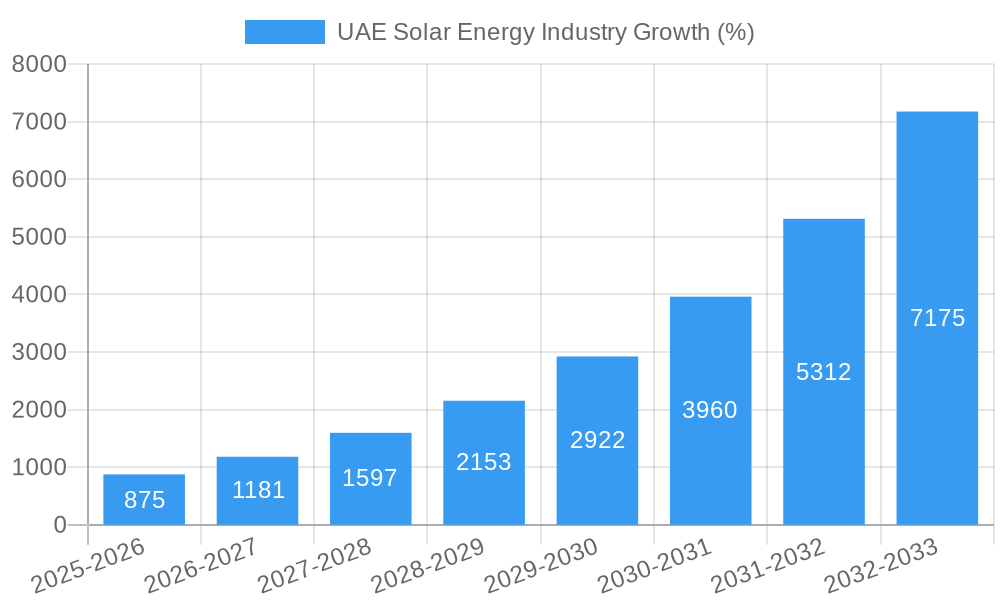
The forecast period (2025-2033) anticipates continued strong growth, propelled by ongoing government initiatives and private sector investment. While challenges such as land availability and grid integration may persist, innovative solutions and technological advancements are mitigating these concerns. The consistent decrease in PV module costs, alongside advancements in energy storage technologies, will further contribute to market expansion. The focus is likely to shift towards enhancing energy storage solutions to ensure reliable power supply, especially for residential and C&I applications. The UAE's strategic location and abundant sunshine make it an ideal hub for solar energy development, promising substantial economic benefits and a cleaner energy future. The market's strong fundamentals suggest continued significant growth throughout the forecast period, solidifying the UAE's position as a leader in renewable energy adoption within the Middle East and beyond.
This comprehensive report provides a detailed analysis of the UAE solar energy market, encompassing market dynamics, growth trends, dominant segments, key players, and future outlook. With a focus on the parent market (renewable energy) and child markets (photovoltaic, concentrated solar power, utility-scale, commercial & industrial, and residential solar), this report is an essential resource for industry professionals, investors, and policymakers seeking to understand and capitalize on the burgeoning UAE solar energy sector. The study period covers 2019-2033, with 2025 as the base and estimated year.
UAE Solar Energy Industry Market Dynamics & Structure
This section analyzes the UAE solar energy market's structure, encompassing market concentration, technological innovation drivers, regulatory frameworks, competitive dynamics, end-user demographics, and mergers & acquisitions (M&A) activity. The report utilizes data from 2019-2024 (historical period) to forecast market trends until 2033.
- Market Concentration: The UAE solar market exhibits a moderately concentrated structure, with a few major players holding significant market share. Precise percentages will be detailed in the full report, but we estimate that the top 5 players hold approximately xx% of the market share in 2025.
- Technological Innovation: The market is driven by continuous advancements in photovoltaic (PV) technology, including the adoption of higher-efficiency panels and improved energy storage solutions. Concentrated solar power (CSP) technology is also witnessing steady growth.
- Regulatory Framework: Supportive government policies, including feed-in tariffs and renewable energy targets, are key drivers of market growth. However, regulatory complexities and permitting processes can present challenges.
- Competitive Landscape: Intense competition exists among established players and new entrants, leading to price pressures and innovation. The report will detail competitive strategies and market positioning.
- End-User Demographics: The primary end-users are utility companies, commercial and industrial (C&I) businesses, and increasingly, residential consumers. The report will provide a breakdown of market share by end-user segment.
- M&A Activity: The UAE has witnessed a moderate level of M&A activity in recent years, primarily involving strategic acquisitions by larger players to consolidate market share and expand capabilities. The report estimates xx M&A deals in the 2019-2024 period.
UAE Solar Energy Industry Growth Trends & Insights
This section analyzes the evolution of the UAE solar energy market size, adoption rates, technological disruptions, and shifts in consumer behavior. It leverages proprietary data and publicly available information to provide a comprehensive overview of market growth trends. The report projects a Compound Annual Growth Rate (CAGR) of xx% from 2025 to 2033 for the overall market, driven by factors such as government support, decreasing solar energy costs, and growing energy demand. Market penetration is expected to reach xx% by 2033.
Dominant Regions, Countries, or Segments in UAE Solar Energy Industry
This section identifies the leading regions, countries, and segments within the UAE solar energy market. The analysis focuses on the key factors driving growth in each segment, including economic policies, infrastructure development, and technological advancements.
- Technology: Photovoltaic (PV) technology dominates the market, accounting for approximately xx% of the total installed capacity in 2025, followed by CSP technology with xx%.
- Deployment: The utility-scale segment is currently the largest, followed by the C&I sector, with residential solar installations showing strong growth potential.
- Key Drivers:
- Government initiatives: The UAE's ambitious renewable energy targets and supportive policies are significantly driving market growth.
- Cost reductions: The decreasing cost of solar PV technology is making it increasingly competitive with conventional energy sources.
- Infrastructure development: Investments in grid infrastructure are crucial for accommodating the increasing penetration of renewable energy.
UAE Solar Energy Industry Product Landscape
The UAE solar energy market features a diverse range of products, including high-efficiency PV modules, advanced solar trackers, and innovative energy storage solutions. These products showcase unique selling propositions such as enhanced energy conversion efficiency, reduced land requirements, and improved system reliability. Technological advancements, such as the development of perovskite solar cells and improved battery technologies, are further enhancing the performance and efficiency of solar energy systems.
Key Drivers, Barriers & Challenges in UAE Solar Energy Industry
Key Drivers:
- Government support through policies and subsidies
- Falling solar technology costs
- Increasing energy demand
- Growing environmental awareness
Key Challenges:
- Land availability and constraints
- Grid integration challenges
- Intermittency of solar power (mitigated by storage solutions)
- Supply chain disruptions (estimated impact on market growth: xx% in 2025)
Emerging Opportunities in UAE Solar Energy Industry
Emerging opportunities include:
- Increased adoption of rooftop solar in residential and commercial sectors.
- Integration of solar energy with smart grids and energy management systems.
- Development of large-scale solar parks and concentrated solar power (CSP) plants.
- Exploration of innovative financing mechanisms to accelerate solar energy deployment.
Growth Accelerators in the UAE Solar Energy Industry
Long-term growth will be fueled by technological advancements in PV and CSP technologies, strategic partnerships between local and international players, expansion into new market segments (e.g., agricultural applications), and continuous policy support from the UAE government.
Key Players Shaping the UAE Solar Energy Industry Market
- JinkoSolar Holding Co Ltd
- Sunergy Solar
- CleanMax Mena FZCO
- Canadian Solar Inc
- City Solar
- Masdar (Abu Dhabi Future Energy Company)
- MAYSUN SOLAR FZCO
- Enerwhere
- ACWA Power
Notable Milestones in UAE Solar Energy Industry Sector
- January 2023: Suntech delivered 680MW solar modules for the Al Dhafra PV2 Solar Power Plant, advancing the construction of the world's largest single-site solar power plant.
- May 2023: ADNOC Distribution partnered with Emerge (EDF and Masdar joint venture) to develop on-site solar power across its service station network in Dubai.
In-Depth UAE Solar Energy Industry Market Outlook
The UAE solar energy market is poised for significant growth over the next decade, driven by supportive government policies, decreasing technology costs, and a growing focus on energy diversification. Strategic partnerships, technological innovation, and expansion into new market segments will play a crucial role in shaping the future of the industry. The market is expected to witness sustained growth, creating opportunities for both established players and new entrants. The potential for large-scale solar projects and the integration of energy storage solutions will be key factors influencing market dynamics in the forecast period (2025-2033).
UAE Solar Energy Industry Segmentation
-
1. Technology
- 1.1. Photovoltaic
- 1.2. Concentrated Solar Power (CSP)
-
2. Deployment
- 2.1. Utility
- 2.2. Commercial and Industrial
- 2.3. Residential
UAE Solar Energy Industry Segmentation By Geography
-
1. North America
- 1.1. United States
- 1.2. Canada
- 1.3. Mexico
-
2. South America
- 2.1. Brazil
- 2.2. Argentina
- 2.3. Rest of South America
-
3. Europe
- 3.1. United Kingdom
- 3.2. Germany
- 3.3. France
- 3.4. Italy
- 3.5. Spain
- 3.6. Russia
- 3.7. Benelux
- 3.8. Nordics
- 3.9. Rest of Europe
-
4. Middle East & Africa
- 4.1. Turkey
- 4.2. Israel
- 4.3. GCC
- 4.4. North Africa
- 4.5. South Africa
- 4.6. Rest of Middle East & Africa
-
5. Asia Pacific
- 5.1. China
- 5.2. India
- 5.3. Japan
- 5.4. South Korea
- 5.5. ASEAN
- 5.6. Oceania
- 5.7. Rest of Asia Pacific
UAE Solar Energy Industry REPORT HIGHLIGHTS
| Aspects | Details |
|---|---|
| Study Period | 2019-2033 |
| Base Year | 2024 |
| Estimated Year | 2025 |
| Forecast Period | 2025-2033 |
| Historical Period | 2019-2024 |
| Growth Rate | CAGR of 35.48% from 2019-2033 |
| Segmentation |
|
Table of Contents
- 1. Introduction
- 1.1. Research Scope
- 1.2. Market Segmentation
- 1.3. Research Methodology
- 1.4. Definitions and Assumptions
- 2. Executive Summary
- 2.1. Introduction
- 3. Market Dynamics
- 3.1. Introduction
- 3.2. Market Drivers
- 3.2.1. 4.; Rising Government Policies to Support Solar PV Installation4.; Rising Installation of Renewable Energy to Reduce Dependency on Fossil Fuels
- 3.3. Market Restrains
- 3.3.1 4.; Rising Adoption of Alternative Clean Energy Sources such as Wind
- 3.3.2 Geothermal
- 3.3.3 Bioenergy
- 3.3.4 and Others
- 3.4. Market Trends
- 3.4.1. Solar Photovoltaic to Dominate the Market
- 4. Market Factor Analysis
- 4.1. Porters Five Forces
- 4.2. Supply/Value Chain
- 4.3. PESTEL analysis
- 4.4. Market Entropy
- 4.5. Patent/Trademark Analysis
- 5. Global UAE Solar Energy Industry Analysis, Insights and Forecast, 2019-2031
- 5.1. Market Analysis, Insights and Forecast - by Technology
- 5.1.1. Photovoltaic
- 5.1.2. Concentrated Solar Power (CSP)
- 5.2. Market Analysis, Insights and Forecast - by Deployment
- 5.2.1. Utility
- 5.2.2. Commercial and Industrial
- 5.2.3. Residential
- 5.3. Market Analysis, Insights and Forecast - by Region
- 5.3.1. North America
- 5.3.2. South America
- 5.3.3. Europe
- 5.3.4. Middle East & Africa
- 5.3.5. Asia Pacific
- 5.1. Market Analysis, Insights and Forecast - by Technology
- 6. North America UAE Solar Energy Industry Analysis, Insights and Forecast, 2019-2031
- 6.1. Market Analysis, Insights and Forecast - by Technology
- 6.1.1. Photovoltaic
- 6.1.2. Concentrated Solar Power (CSP)
- 6.2. Market Analysis, Insights and Forecast - by Deployment
- 6.2.1. Utility
- 6.2.2. Commercial and Industrial
- 6.2.3. Residential
- 6.1. Market Analysis, Insights and Forecast - by Technology
- 7. South America UAE Solar Energy Industry Analysis, Insights and Forecast, 2019-2031
- 7.1. Market Analysis, Insights and Forecast - by Technology
- 7.1.1. Photovoltaic
- 7.1.2. Concentrated Solar Power (CSP)
- 7.2. Market Analysis, Insights and Forecast - by Deployment
- 7.2.1. Utility
- 7.2.2. Commercial and Industrial
- 7.2.3. Residential
- 7.1. Market Analysis, Insights and Forecast - by Technology
- 8. Europe UAE Solar Energy Industry Analysis, Insights and Forecast, 2019-2031
- 8.1. Market Analysis, Insights and Forecast - by Technology
- 8.1.1. Photovoltaic
- 8.1.2. Concentrated Solar Power (CSP)
- 8.2. Market Analysis, Insights and Forecast - by Deployment
- 8.2.1. Utility
- 8.2.2. Commercial and Industrial
- 8.2.3. Residential
- 8.1. Market Analysis, Insights and Forecast - by Technology
- 9. Middle East & Africa UAE Solar Energy Industry Analysis, Insights and Forecast, 2019-2031
- 9.1. Market Analysis, Insights and Forecast - by Technology
- 9.1.1. Photovoltaic
- 9.1.2. Concentrated Solar Power (CSP)
- 9.2. Market Analysis, Insights and Forecast - by Deployment
- 9.2.1. Utility
- 9.2.2. Commercial and Industrial
- 9.2.3. Residential
- 9.1. Market Analysis, Insights and Forecast - by Technology
- 10. Asia Pacific UAE Solar Energy Industry Analysis, Insights and Forecast, 2019-2031
- 10.1. Market Analysis, Insights and Forecast - by Technology
- 10.1.1. Photovoltaic
- 10.1.2. Concentrated Solar Power (CSP)
- 10.2. Market Analysis, Insights and Forecast - by Deployment
- 10.2.1. Utility
- 10.2.2. Commercial and Industrial
- 10.2.3. Residential
- 10.1. Market Analysis, Insights and Forecast - by Technology
- 11. Competitive Analysis
- 11.1. Global Market Share Analysis 2024
- 11.2. Company Profiles
- 11.2.1 JinkoSolar Holding Co Ltd
- 11.2.1.1. Overview
- 11.2.1.2. Products
- 11.2.1.3. SWOT Analysis
- 11.2.1.4. Recent Developments
- 11.2.1.5. Financials (Based on Availability)
- 11.2.2 Sunergy Solar
- 11.2.2.1. Overview
- 11.2.2.2. Products
- 11.2.2.3. SWOT Analysis
- 11.2.2.4. Recent Developments
- 11.2.2.5. Financials (Based on Availability)
- 11.2.3 CleanMax Mena FZCO*List Not Exhaustive
- 11.2.3.1. Overview
- 11.2.3.2. Products
- 11.2.3.3. SWOT Analysis
- 11.2.3.4. Recent Developments
- 11.2.3.5. Financials (Based on Availability)
- 11.2.4 Canadian Solar Inc
- 11.2.4.1. Overview
- 11.2.4.2. Products
- 11.2.4.3. SWOT Analysis
- 11.2.4.4. Recent Developments
- 11.2.4.5. Financials (Based on Availability)
- 11.2.5 City Solar
- 11.2.5.1. Overview
- 11.2.5.2. Products
- 11.2.5.3. SWOT Analysis
- 11.2.5.4. Recent Developments
- 11.2.5.5. Financials (Based on Availability)
- 11.2.6 Masdar (Abu Dhabi Future Energy Company)
- 11.2.6.1. Overview
- 11.2.6.2. Products
- 11.2.6.3. SWOT Analysis
- 11.2.6.4. Recent Developments
- 11.2.6.5. Financials (Based on Availability)
- 11.2.7 MAYSUN SOLAR FZCO
- 11.2.7.1. Overview
- 11.2.7.2. Products
- 11.2.7.3. SWOT Analysis
- 11.2.7.4. Recent Developments
- 11.2.7.5. Financials (Based on Availability)
- 11.2.8 Enerwhere
- 11.2.8.1. Overview
- 11.2.8.2. Products
- 11.2.8.3. SWOT Analysis
- 11.2.8.4. Recent Developments
- 11.2.8.5. Financials (Based on Availability)
- 11.2.9 ACWA Power
- 11.2.9.1. Overview
- 11.2.9.2. Products
- 11.2.9.3. SWOT Analysis
- 11.2.9.4. Recent Developments
- 11.2.9.5. Financials (Based on Availability)
- 11.2.1 JinkoSolar Holding Co Ltd
List of Figures
- Figure 1: Global UAE Solar Energy Industry Revenue Breakdown (Million, %) by Region 2024 & 2032
- Figure 2: Global UAE Solar Energy Industry Volume Breakdown (gigawatt, %) by Region 2024 & 2032
- Figure 3: UAE UAE Solar Energy Industry Revenue (Million), by Country 2024 & 2032
- Figure 4: UAE UAE Solar Energy Industry Volume (gigawatt), by Country 2024 & 2032
- Figure 5: UAE UAE Solar Energy Industry Revenue Share (%), by Country 2024 & 2032
- Figure 6: UAE UAE Solar Energy Industry Volume Share (%), by Country 2024 & 2032
- Figure 7: North America UAE Solar Energy Industry Revenue (Million), by Technology 2024 & 2032
- Figure 8: North America UAE Solar Energy Industry Volume (gigawatt), by Technology 2024 & 2032
- Figure 9: North America UAE Solar Energy Industry Revenue Share (%), by Technology 2024 & 2032
- Figure 10: North America UAE Solar Energy Industry Volume Share (%), by Technology 2024 & 2032
- Figure 11: North America UAE Solar Energy Industry Revenue (Million), by Deployment 2024 & 2032
- Figure 12: North America UAE Solar Energy Industry Volume (gigawatt), by Deployment 2024 & 2032
- Figure 13: North America UAE Solar Energy Industry Revenue Share (%), by Deployment 2024 & 2032
- Figure 14: North America UAE Solar Energy Industry Volume Share (%), by Deployment 2024 & 2032
- Figure 15: North America UAE Solar Energy Industry Revenue (Million), by Country 2024 & 2032
- Figure 16: North America UAE Solar Energy Industry Volume (gigawatt), by Country 2024 & 2032
- Figure 17: North America UAE Solar Energy Industry Revenue Share (%), by Country 2024 & 2032
- Figure 18: North America UAE Solar Energy Industry Volume Share (%), by Country 2024 & 2032
- Figure 19: South America UAE Solar Energy Industry Revenue (Million), by Technology 2024 & 2032
- Figure 20: South America UAE Solar Energy Industry Volume (gigawatt), by Technology 2024 & 2032
- Figure 21: South America UAE Solar Energy Industry Revenue Share (%), by Technology 2024 & 2032
- Figure 22: South America UAE Solar Energy Industry Volume Share (%), by Technology 2024 & 2032
- Figure 23: South America UAE Solar Energy Industry Revenue (Million), by Deployment 2024 & 2032
- Figure 24: South America UAE Solar Energy Industry Volume (gigawatt), by Deployment 2024 & 2032
- Figure 25: South America UAE Solar Energy Industry Revenue Share (%), by Deployment 2024 & 2032
- Figure 26: South America UAE Solar Energy Industry Volume Share (%), by Deployment 2024 & 2032
- Figure 27: South America UAE Solar Energy Industry Revenue (Million), by Country 2024 & 2032
- Figure 28: South America UAE Solar Energy Industry Volume (gigawatt), by Country 2024 & 2032
- Figure 29: South America UAE Solar Energy Industry Revenue Share (%), by Country 2024 & 2032
- Figure 30: South America UAE Solar Energy Industry Volume Share (%), by Country 2024 & 2032
- Figure 31: Europe UAE Solar Energy Industry Revenue (Million), by Technology 2024 & 2032
- Figure 32: Europe UAE Solar Energy Industry Volume (gigawatt), by Technology 2024 & 2032
- Figure 33: Europe UAE Solar Energy Industry Revenue Share (%), by Technology 2024 & 2032
- Figure 34: Europe UAE Solar Energy Industry Volume Share (%), by Technology 2024 & 2032
- Figure 35: Europe UAE Solar Energy Industry Revenue (Million), by Deployment 2024 & 2032
- Figure 36: Europe UAE Solar Energy Industry Volume (gigawatt), by Deployment 2024 & 2032
- Figure 37: Europe UAE Solar Energy Industry Revenue Share (%), by Deployment 2024 & 2032
- Figure 38: Europe UAE Solar Energy Industry Volume Share (%), by Deployment 2024 & 2032
- Figure 39: Europe UAE Solar Energy Industry Revenue (Million), by Country 2024 & 2032
- Figure 40: Europe UAE Solar Energy Industry Volume (gigawatt), by Country 2024 & 2032
- Figure 41: Europe UAE Solar Energy Industry Revenue Share (%), by Country 2024 & 2032
- Figure 42: Europe UAE Solar Energy Industry Volume Share (%), by Country 2024 & 2032
- Figure 43: Middle East & Africa UAE Solar Energy Industry Revenue (Million), by Technology 2024 & 2032
- Figure 44: Middle East & Africa UAE Solar Energy Industry Volume (gigawatt), by Technology 2024 & 2032
- Figure 45: Middle East & Africa UAE Solar Energy Industry Revenue Share (%), by Technology 2024 & 2032
- Figure 46: Middle East & Africa UAE Solar Energy Industry Volume Share (%), by Technology 2024 & 2032
- Figure 47: Middle East & Africa UAE Solar Energy Industry Revenue (Million), by Deployment 2024 & 2032
- Figure 48: Middle East & Africa UAE Solar Energy Industry Volume (gigawatt), by Deployment 2024 & 2032
- Figure 49: Middle East & Africa UAE Solar Energy Industry Revenue Share (%), by Deployment 2024 & 2032
- Figure 50: Middle East & Africa UAE Solar Energy Industry Volume Share (%), by Deployment 2024 & 2032
- Figure 51: Middle East & Africa UAE Solar Energy Industry Revenue (Million), by Country 2024 & 2032
- Figure 52: Middle East & Africa UAE Solar Energy Industry Volume (gigawatt), by Country 2024 & 2032
- Figure 53: Middle East & Africa UAE Solar Energy Industry Revenue Share (%), by Country 2024 & 2032
- Figure 54: Middle East & Africa UAE Solar Energy Industry Volume Share (%), by Country 2024 & 2032
- Figure 55: Asia Pacific UAE Solar Energy Industry Revenue (Million), by Technology 2024 & 2032
- Figure 56: Asia Pacific UAE Solar Energy Industry Volume (gigawatt), by Technology 2024 & 2032
- Figure 57: Asia Pacific UAE Solar Energy Industry Revenue Share (%), by Technology 2024 & 2032
- Figure 58: Asia Pacific UAE Solar Energy Industry Volume Share (%), by Technology 2024 & 2032
- Figure 59: Asia Pacific UAE Solar Energy Industry Revenue (Million), by Deployment 2024 & 2032
- Figure 60: Asia Pacific UAE Solar Energy Industry Volume (gigawatt), by Deployment 2024 & 2032
- Figure 61: Asia Pacific UAE Solar Energy Industry Revenue Share (%), by Deployment 2024 & 2032
- Figure 62: Asia Pacific UAE Solar Energy Industry Volume Share (%), by Deployment 2024 & 2032
- Figure 63: Asia Pacific UAE Solar Energy Industry Revenue (Million), by Country 2024 & 2032
- Figure 64: Asia Pacific UAE Solar Energy Industry Volume (gigawatt), by Country 2024 & 2032
- Figure 65: Asia Pacific UAE Solar Energy Industry Revenue Share (%), by Country 2024 & 2032
- Figure 66: Asia Pacific UAE Solar Energy Industry Volume Share (%), by Country 2024 & 2032
List of Tables
- Table 1: Global UAE Solar Energy Industry Revenue Million Forecast, by Region 2019 & 2032
- Table 2: Global UAE Solar Energy Industry Volume gigawatt Forecast, by Region 2019 & 2032
- Table 3: Global UAE Solar Energy Industry Revenue Million Forecast, by Technology 2019 & 2032
- Table 4: Global UAE Solar Energy Industry Volume gigawatt Forecast, by Technology 2019 & 2032
- Table 5: Global UAE Solar Energy Industry Revenue Million Forecast, by Deployment 2019 & 2032
- Table 6: Global UAE Solar Energy Industry Volume gigawatt Forecast, by Deployment 2019 & 2032
- Table 7: Global UAE Solar Energy Industry Revenue Million Forecast, by Region 2019 & 2032
- Table 8: Global UAE Solar Energy Industry Volume gigawatt Forecast, by Region 2019 & 2032
- Table 9: Global UAE Solar Energy Industry Revenue Million Forecast, by Country 2019 & 2032
- Table 10: Global UAE Solar Energy Industry Volume gigawatt Forecast, by Country 2019 & 2032
- Table 11: Global UAE Solar Energy Industry Revenue Million Forecast, by Technology 2019 & 2032
- Table 12: Global UAE Solar Energy Industry Volume gigawatt Forecast, by Technology 2019 & 2032
- Table 13: Global UAE Solar Energy Industry Revenue Million Forecast, by Deployment 2019 & 2032
- Table 14: Global UAE Solar Energy Industry Volume gigawatt Forecast, by Deployment 2019 & 2032
- Table 15: Global UAE Solar Energy Industry Revenue Million Forecast, by Country 2019 & 2032
- Table 16: Global UAE Solar Energy Industry Volume gigawatt Forecast, by Country 2019 & 2032
- Table 17: United States UAE Solar Energy Industry Revenue (Million) Forecast, by Application 2019 & 2032
- Table 18: United States UAE Solar Energy Industry Volume (gigawatt) Forecast, by Application 2019 & 2032
- Table 19: Canada UAE Solar Energy Industry Revenue (Million) Forecast, by Application 2019 & 2032
- Table 20: Canada UAE Solar Energy Industry Volume (gigawatt) Forecast, by Application 2019 & 2032
- Table 21: Mexico UAE Solar Energy Industry Revenue (Million) Forecast, by Application 2019 & 2032
- Table 22: Mexico UAE Solar Energy Industry Volume (gigawatt) Forecast, by Application 2019 & 2032
- Table 23: Global UAE Solar Energy Industry Revenue Million Forecast, by Technology 2019 & 2032
- Table 24: Global UAE Solar Energy Industry Volume gigawatt Forecast, by Technology 2019 & 2032
- Table 25: Global UAE Solar Energy Industry Revenue Million Forecast, by Deployment 2019 & 2032
- Table 26: Global UAE Solar Energy Industry Volume gigawatt Forecast, by Deployment 2019 & 2032
- Table 27: Global UAE Solar Energy Industry Revenue Million Forecast, by Country 2019 & 2032
- Table 28: Global UAE Solar Energy Industry Volume gigawatt Forecast, by Country 2019 & 2032
- Table 29: Brazil UAE Solar Energy Industry Revenue (Million) Forecast, by Application 2019 & 2032
- Table 30: Brazil UAE Solar Energy Industry Volume (gigawatt) Forecast, by Application 2019 & 2032
- Table 31: Argentina UAE Solar Energy Industry Revenue (Million) Forecast, by Application 2019 & 2032
- Table 32: Argentina UAE Solar Energy Industry Volume (gigawatt) Forecast, by Application 2019 & 2032
- Table 33: Rest of South America UAE Solar Energy Industry Revenue (Million) Forecast, by Application 2019 & 2032
- Table 34: Rest of South America UAE Solar Energy Industry Volume (gigawatt) Forecast, by Application 2019 & 2032
- Table 35: Global UAE Solar Energy Industry Revenue Million Forecast, by Technology 2019 & 2032
- Table 36: Global UAE Solar Energy Industry Volume gigawatt Forecast, by Technology 2019 & 2032
- Table 37: Global UAE Solar Energy Industry Revenue Million Forecast, by Deployment 2019 & 2032
- Table 38: Global UAE Solar Energy Industry Volume gigawatt Forecast, by Deployment 2019 & 2032
- Table 39: Global UAE Solar Energy Industry Revenue Million Forecast, by Country 2019 & 2032
- Table 40: Global UAE Solar Energy Industry Volume gigawatt Forecast, by Country 2019 & 2032
- Table 41: United Kingdom UAE Solar Energy Industry Revenue (Million) Forecast, by Application 2019 & 2032
- Table 42: United Kingdom UAE Solar Energy Industry Volume (gigawatt) Forecast, by Application 2019 & 2032
- Table 43: Germany UAE Solar Energy Industry Revenue (Million) Forecast, by Application 2019 & 2032
- Table 44: Germany UAE Solar Energy Industry Volume (gigawatt) Forecast, by Application 2019 & 2032
- Table 45: France UAE Solar Energy Industry Revenue (Million) Forecast, by Application 2019 & 2032
- Table 46: France UAE Solar Energy Industry Volume (gigawatt) Forecast, by Application 2019 & 2032
- Table 47: Italy UAE Solar Energy Industry Revenue (Million) Forecast, by Application 2019 & 2032
- Table 48: Italy UAE Solar Energy Industry Volume (gigawatt) Forecast, by Application 2019 & 2032
- Table 49: Spain UAE Solar Energy Industry Revenue (Million) Forecast, by Application 2019 & 2032
- Table 50: Spain UAE Solar Energy Industry Volume (gigawatt) Forecast, by Application 2019 & 2032
- Table 51: Russia UAE Solar Energy Industry Revenue (Million) Forecast, by Application 2019 & 2032
- Table 52: Russia UAE Solar Energy Industry Volume (gigawatt) Forecast, by Application 2019 & 2032
- Table 53: Benelux UAE Solar Energy Industry Revenue (Million) Forecast, by Application 2019 & 2032
- Table 54: Benelux UAE Solar Energy Industry Volume (gigawatt) Forecast, by Application 2019 & 2032
- Table 55: Nordics UAE Solar Energy Industry Revenue (Million) Forecast, by Application 2019 & 2032
- Table 56: Nordics UAE Solar Energy Industry Volume (gigawatt) Forecast, by Application 2019 & 2032
- Table 57: Rest of Europe UAE Solar Energy Industry Revenue (Million) Forecast, by Application 2019 & 2032
- Table 58: Rest of Europe UAE Solar Energy Industry Volume (gigawatt) Forecast, by Application 2019 & 2032
- Table 59: Global UAE Solar Energy Industry Revenue Million Forecast, by Technology 2019 & 2032
- Table 60: Global UAE Solar Energy Industry Volume gigawatt Forecast, by Technology 2019 & 2032
- Table 61: Global UAE Solar Energy Industry Revenue Million Forecast, by Deployment 2019 & 2032
- Table 62: Global UAE Solar Energy Industry Volume gigawatt Forecast, by Deployment 2019 & 2032
- Table 63: Global UAE Solar Energy Industry Revenue Million Forecast, by Country 2019 & 2032
- Table 64: Global UAE Solar Energy Industry Volume gigawatt Forecast, by Country 2019 & 2032
- Table 65: Turkey UAE Solar Energy Industry Revenue (Million) Forecast, by Application 2019 & 2032
- Table 66: Turkey UAE Solar Energy Industry Volume (gigawatt) Forecast, by Application 2019 & 2032
- Table 67: Israel UAE Solar Energy Industry Revenue (Million) Forecast, by Application 2019 & 2032
- Table 68: Israel UAE Solar Energy Industry Volume (gigawatt) Forecast, by Application 2019 & 2032
- Table 69: GCC UAE Solar Energy Industry Revenue (Million) Forecast, by Application 2019 & 2032
- Table 70: GCC UAE Solar Energy Industry Volume (gigawatt) Forecast, by Application 2019 & 2032
- Table 71: North Africa UAE Solar Energy Industry Revenue (Million) Forecast, by Application 2019 & 2032
- Table 72: North Africa UAE Solar Energy Industry Volume (gigawatt) Forecast, by Application 2019 & 2032
- Table 73: South Africa UAE Solar Energy Industry Revenue (Million) Forecast, by Application 2019 & 2032
- Table 74: South Africa UAE Solar Energy Industry Volume (gigawatt) Forecast, by Application 2019 & 2032
- Table 75: Rest of Middle East & Africa UAE Solar Energy Industry Revenue (Million) Forecast, by Application 2019 & 2032
- Table 76: Rest of Middle East & Africa UAE Solar Energy Industry Volume (gigawatt) Forecast, by Application 2019 & 2032
- Table 77: Global UAE Solar Energy Industry Revenue Million Forecast, by Technology 2019 & 2032
- Table 78: Global UAE Solar Energy Industry Volume gigawatt Forecast, by Technology 2019 & 2032
- Table 79: Global UAE Solar Energy Industry Revenue Million Forecast, by Deployment 2019 & 2032
- Table 80: Global UAE Solar Energy Industry Volume gigawatt Forecast, by Deployment 2019 & 2032
- Table 81: Global UAE Solar Energy Industry Revenue Million Forecast, by Country 2019 & 2032
- Table 82: Global UAE Solar Energy Industry Volume gigawatt Forecast, by Country 2019 & 2032
- Table 83: China UAE Solar Energy Industry Revenue (Million) Forecast, by Application 2019 & 2032
- Table 84: China UAE Solar Energy Industry Volume (gigawatt) Forecast, by Application 2019 & 2032
- Table 85: India UAE Solar Energy Industry Revenue (Million) Forecast, by Application 2019 & 2032
- Table 86: India UAE Solar Energy Industry Volume (gigawatt) Forecast, by Application 2019 & 2032
- Table 87: Japan UAE Solar Energy Industry Revenue (Million) Forecast, by Application 2019 & 2032
- Table 88: Japan UAE Solar Energy Industry Volume (gigawatt) Forecast, by Application 2019 & 2032
- Table 89: South Korea UAE Solar Energy Industry Revenue (Million) Forecast, by Application 2019 & 2032
- Table 90: South Korea UAE Solar Energy Industry Volume (gigawatt) Forecast, by Application 2019 & 2032
- Table 91: ASEAN UAE Solar Energy Industry Revenue (Million) Forecast, by Application 2019 & 2032
- Table 92: ASEAN UAE Solar Energy Industry Volume (gigawatt) Forecast, by Application 2019 & 2032
- Table 93: Oceania UAE Solar Energy Industry Revenue (Million) Forecast, by Application 2019 & 2032
- Table 94: Oceania UAE Solar Energy Industry Volume (gigawatt) Forecast, by Application 2019 & 2032
- Table 95: Rest of Asia Pacific UAE Solar Energy Industry Revenue (Million) Forecast, by Application 2019 & 2032
- Table 96: Rest of Asia Pacific UAE Solar Energy Industry Volume (gigawatt) Forecast, by Application 2019 & 2032
Frequently Asked Questions
1. What is the projected Compound Annual Growth Rate (CAGR) of the UAE Solar Energy Industry?
The projected CAGR is approximately 35.48%.
2. Which companies are prominent players in the UAE Solar Energy Industry?
Key companies in the market include JinkoSolar Holding Co Ltd, Sunergy Solar, CleanMax Mena FZCO*List Not Exhaustive, Canadian Solar Inc, City Solar, Masdar (Abu Dhabi Future Energy Company), MAYSUN SOLAR FZCO, Enerwhere, ACWA Power.
3. What are the main segments of the UAE Solar Energy Industry?
The market segments include Technology, Deployment.
4. Can you provide details about the market size?
The market size is estimated to be USD XX Million as of 2022.
5. What are some drivers contributing to market growth?
4.; Rising Government Policies to Support Solar PV Installation4.; Rising Installation of Renewable Energy to Reduce Dependency on Fossil Fuels.
6. What are the notable trends driving market growth?
Solar Photovoltaic to Dominate the Market.
7. Are there any restraints impacting market growth?
4.; Rising Adoption of Alternative Clean Energy Sources such as Wind. Geothermal. Bioenergy. and Others.
8. Can you provide examples of recent developments in the market?
May 2023: ADNOC Distribution announced a key partnership with Emerge, a joint venture between EDF and Masdar, to develop on-site solar power across its service station network. The project will commence in Dubai in 2023 to generate clean energy.
9. What pricing options are available for accessing the report?
Pricing options include single-user, multi-user, and enterprise licenses priced at USD 3800, USD 4500, and USD 5800 respectively.
10. Is the market size provided in terms of value or volume?
The market size is provided in terms of value, measured in Million and volume, measured in gigawatt.
11. Are there any specific market keywords associated with the report?
Yes, the market keyword associated with the report is "UAE Solar Energy Industry," which aids in identifying and referencing the specific market segment covered.
12. How do I determine which pricing option suits my needs best?
The pricing options vary based on user requirements and access needs. Individual users may opt for single-user licenses, while businesses requiring broader access may choose multi-user or enterprise licenses for cost-effective access to the report.
13. Are there any additional resources or data provided in the UAE Solar Energy Industry report?
While the report offers comprehensive insights, it's advisable to review the specific contents or supplementary materials provided to ascertain if additional resources or data are available.
14. How can I stay updated on further developments or reports in the UAE Solar Energy Industry?
To stay informed about further developments, trends, and reports in the UAE Solar Energy Industry, consider subscribing to industry newsletters, following relevant companies and organizations, or regularly checking reputable industry news sources and publications.
Methodology
Step 1 - Identification of Relevant Samples Size from Population Database


Step 2 - Approaches for Defining Global Market Size (Value, Volume* & Price*)

Note*: In applicable scenarios
Step 3 - Data Sources
Primary Research
- Web Analytics
- Survey Reports
- Research Institute
- Latest Research Reports
- Opinion Leaders
Secondary Research
- Annual Reports
- White Paper
- Latest Press Release
- Industry Association
- Paid Database
- Investor Presentations

Step 4 - Data Triangulation
Involves using different sources of information in order to increase the validity of a study
These sources are likely to be stakeholders in a program - participants, other researchers, program staff, other community members, and so on.
Then we put all data in single framework & apply various statistical tools to find out the dynamic on the market.
During the analysis stage, feedback from the stakeholder groups would be compared to determine areas of agreement as well as areas of divergence


