
Key Insights
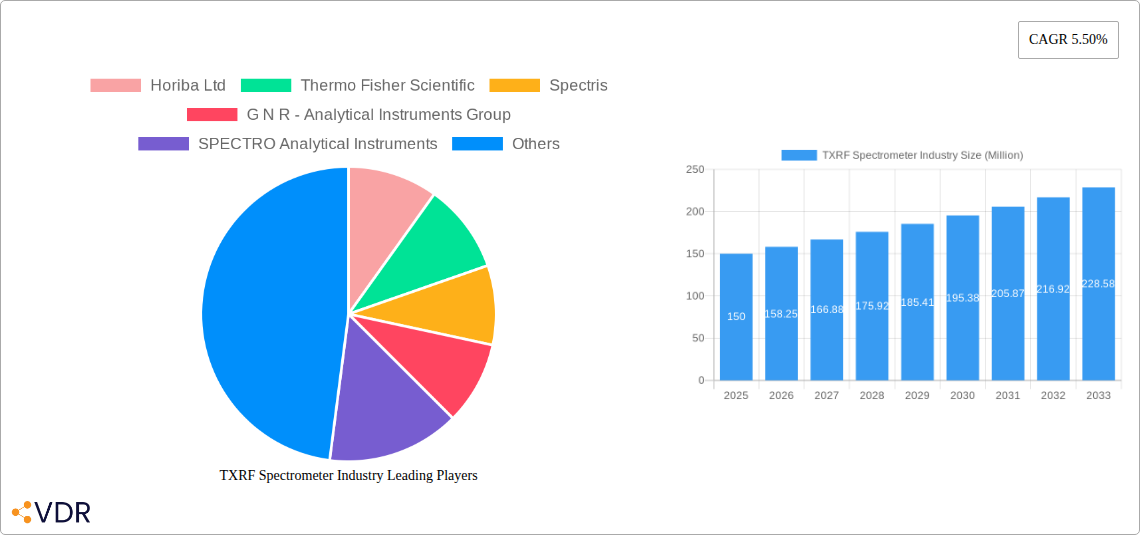
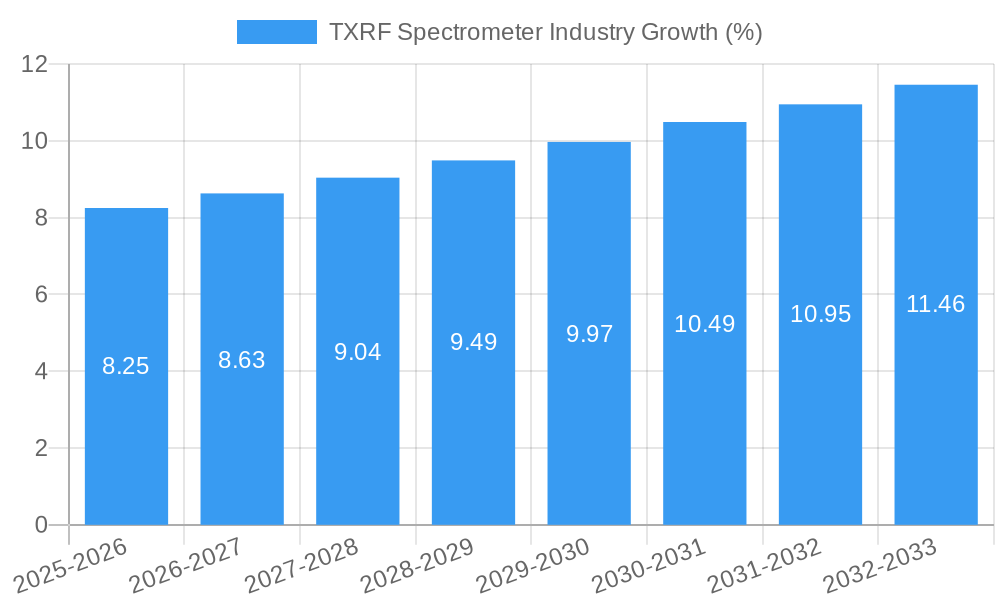
The TXRF Spectrometer market, valued at approximately $150 million in 2025, is projected to experience robust growth, exhibiting a compound annual growth rate (CAGR) of 5.5% from 2025 to 2033. This expansion is fueled by several key drivers. The increasing demand for precise elemental analysis across diverse sectors, including pharmaceuticals, food safety, and environmental monitoring, is a primary catalyst. Advancements in spectrometer technology, leading to improved sensitivity, accuracy, and ease of use, further stimulate market growth. Moreover, stringent regulatory frameworks governing contaminant levels in various products are compelling industries to adopt advanced analytical techniques like TXRF, bolstering market demand. The pharmaceutical industry, particularly, is a significant contributor due to the rising need for quality control and precise elemental characterization in drug development and manufacturing. Growth in emerging economies, particularly in Asia-Pacific, is expected to further contribute to the market's expansion over the forecast period. However, the high initial investment cost associated with TXRF spectrometers and the availability of alternative analytical techniques could act as potential restraints on market growth. The market is segmented by type (Atomic, Molecular, and Mass Spectrometers) and application (Pharmaceutical, Food, Environmental Monitoring, and Other). The atomic spectrometer segment currently dominates, but the molecular spectrometer segment is poised for significant growth driven by advancements in technology and increased applications in the food and environmental sectors.
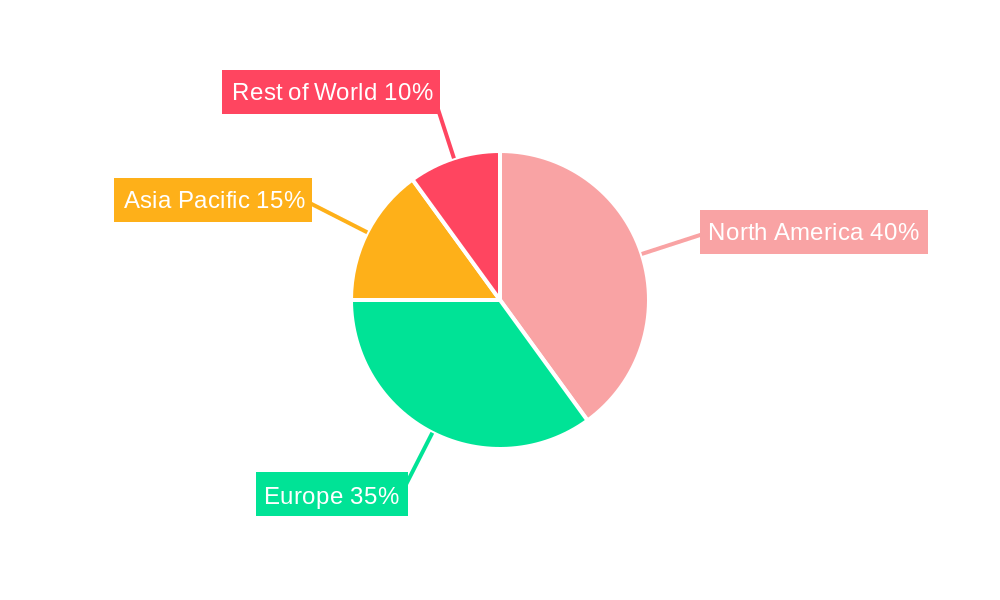
The competitive landscape is characterized by the presence of established players like Horiba Ltd, Thermo Fisher Scientific, and Bruker Corporation, alongside several specialized manufacturers. These companies are actively engaged in research and development to enhance the capabilities of TXRF spectrometers, introducing advanced features and improving performance. Strategic partnerships and acquisitions are also anticipated to play a significant role in shaping the competitive landscape and driving innovation within the market. Regional analysis indicates that North America and Europe currently hold a dominant share of the market, however, the Asia-Pacific region is predicted to witness the fastest growth rate due to the increasing adoption of TXRF spectrometry in various industries and government initiatives for environmental protection and food safety. Future growth will be contingent upon continuous technological innovation, expanding applications across industries, and favorable regulatory support.
This comprehensive report provides a detailed analysis of the TXRF Spectrometer market, encompassing market dynamics, growth trends, regional analysis, product landscape, key players, and future outlook. The study period covers 2019-2033, with a base year of 2025 and a forecast period of 2025-2033. The report utilizes data from the historical period (2019-2024) and incorporates projected values where necessary. Market values are presented in million units.
TXRF Spectrometer Industry Market Dynamics & Structure
The TXRF spectrometer market, a sub-segment of the broader analytical instrument market (parent market), is characterized by moderate concentration, with key players holding significant market shares. The market is driven by technological advancements leading to improved sensitivity, accuracy, and ease of use in elemental analysis. Stringent environmental regulations across various industries are another significant driver, mandating precise trace element detection. Competitive substitutes include techniques like ICP-OES and AAS, but TXRF offers unique advantages in terms of sample preparation and versatility. The end-user demographics span diverse industries, with significant demand from the pharmaceutical and semiconductor sectors. Consolidation through mergers and acquisitions (M&A) has been observed, with approximately xx M&A deals recorded in the last 5 years, leading to increased market concentration. Innovation barriers include high R&D costs and the need for specialized expertise.
- Market Concentration: Moderately concentrated, with top 5 players holding xx% market share in 2024.
- Technological Innovation Drivers: Enhanced sensitivity, miniaturization, improved software integration.
- Regulatory Frameworks: Stringent environmental regulations, particularly in Europe and North America.
- Competitive Product Substitutes: ICP-OES, AAS, XRF.
- End-User Demographics: Pharmaceutical, food & beverage, environmental monitoring, semiconductor, materials science.
- M&A Trends: xx M&A deals in the last 5 years, resulting in market consolidation.
TXRF Spectrometer Industry Growth Trends & Insights
The TXRF spectrometer market experienced a CAGR of xx% during the historical period (2019-2024), reaching a market size of xx million units in 2024. Driven by increasing demand from emerging economies and advancements in technology, the market is projected to maintain a healthy growth trajectory, with a forecasted CAGR of xx% during the period 2025-2033, reaching xx million units by 2033. Market penetration remains relatively low in some developing regions, presenting significant growth opportunities. Technological disruptions, such as the integration of AI and machine learning for data analysis, are enhancing the capabilities of TXRF spectrometers and driving wider adoption. Consumer behavior shifts towards increased reliance on automated and high-throughput analytical techniques are also supporting market expansion.
Dominant Regions, Countries, or Segments in TXRF Spectrometer Industry
North America currently holds the largest market share in the TXRF spectrometer industry, driven by robust R&D investments, stringent environmental regulations, and a strong presence of key players. Europe follows closely, with strong regulatory compliance and a significant pharmaceutical industry. Within the segment breakdown, the Atomic Spectrometers segment dominates, accounting for xx% of the market in 2024, largely driven by its versatility and broad applications. The Pharmaceutical Industry is the leading application segment, constituting xx% of the overall market share in 2024.
- Key Drivers in North America: Strong R&D investment, stringent regulations, presence of major players.
- Key Drivers in Europe: Stringent environmental regulations, robust pharmaceutical industry.
- Atomic Spectrometers Segment Dominance: Versatility and broad application across various industries.
- Pharmaceutical Industry Application: High demand for precise elemental analysis in drug development and quality control.
- Growth Potential: Significant potential in emerging markets like Asia-Pacific, driven by economic growth and rising environmental awareness.
TXRF Spectrometer Industry Product Landscape
Recent product innovations focus on improving sensitivity, reducing analysis time, and enhancing ease of use. Advancements in detector technology and software algorithms have led to significant improvements in performance metrics such as detection limits and accuracy. Unique selling propositions often include features like automated sample handling, integrated data analysis software, and user-friendly interfaces. Technological advancements are steadily making TXRF spectrometry a more accessible and efficient analytical tool.
Key Drivers, Barriers & Challenges in TXRF Spectrometer Industry
Key Drivers: Increasing demand for trace element analysis in various industries; stringent environmental regulations; advancements in detector technology and software; growing adoption of automation.
Challenges: High initial investment costs; complex sample preparation requirements; competition from alternative analytical techniques; skilled labor shortages; potential supply chain disruptions impacting component availability, resulting in xx% increase in production cost in 2024.
Emerging Opportunities in TXRF Spectrometer Industry
Untapped markets in developing economies present significant growth opportunities. Innovative applications in fields such as nanotechnology, materials science, and forensics are emerging. Growing consumer preferences for faster, more efficient, and user-friendly analytical instruments are driving demand for advanced features and improved software solutions.
Growth Accelerators in the TXRF Spectrometer Industry Industry
Technological breakthroughs in detector technology and data analysis algorithms are driving market expansion. Strategic partnerships between instrument manufacturers and software developers are enhancing product capabilities. Market expansion into emerging economies through targeted marketing and distribution strategies are vital for long-term growth.
Key Players Shaping the TXRF Spectrometer Industry Market
- Horiba Ltd
- Thermo Fisher Scientific
- Spectris
- G N R - Analytical Instruments Group
- SPECTRO Analytical Instruments
- EAG Inc
- Bruker Corporation
- Rigaku
Notable Milestones in TXRF Spectrometer Industry Sector
- 2021: Bruker Corporation launched a new high-throughput TXRF spectrometer.
- 2022: Thermo Fisher Scientific acquired a smaller TXRF spectrometer manufacturer.
- 2023: New software updates from Horiba improved data analysis capabilities.
- 2024: Rigaku introduced a portable TXRF spectrometer for field applications.
In-Depth TXRF Spectrometer Industry Market Outlook
The TXRF spectrometer market is poised for significant growth, driven by continuous technological advancements, expanding applications, and increasing demand across various sectors. Strategic partnerships, focused R&D, and expansion into emerging markets will be crucial for capturing the market’s future potential. The market is expected to witness a period of sustained growth and innovation, solidifying its position as a valuable analytical technique across diverse scientific and industrial applications.
TXRF Spectrometer Industry Segmentation
-
1. Type
- 1.1. Atomic Spectrometers
- 1.2. Molecular Spectrometers
- 1.3. Mass Spectrometers
-
2. Applictions
- 2.1. Pharmaceutical Industry
- 2.2. Food Industry
- 2.3. Environment Monitoring
- 2.4. Other Applications
TXRF Spectrometer Industry Segmentation By Geography
-
1. North America
- 1.1. United States
- 1.2. Canada
- 1.3. Mexico
-
2. Europe
- 2.1. Germany
- 2.2. United Kingdom
- 2.3. France
- 2.4. Italy
- 2.5. Spain
- 2.6. Rest of Europe
-
3. Asia Pacific
- 3.1. China
- 3.2. Japan
- 3.3. India
- 3.4. Australia
- 3.5. South Korea
- 3.6. Rest of Asia Pacific
- 4. Middle East
-
5. GCC
- 5.1. South Africa
- 5.2. Rest of Middle East
-
6. South America
- 6.1. Brazil
- 6.2. Argentina
- 6.3. Rest of South America
TXRF Spectrometer Industry REPORT HIGHLIGHTS
| Aspects | Details |
|---|---|
| Study Period | 2019-2033 |
| Base Year | 2024 |
| Estimated Year | 2025 |
| Forecast Period | 2025-2033 |
| Historical Period | 2019-2024 |
| Growth Rate | CAGR of 5.50% from 2019-2033 |
| Segmentation |
|
Table of Contents
- 1. Introduction
- 1.1. Research Scope
- 1.2. Market Segmentation
- 1.3. Research Methodology
- 1.4. Definitions and Assumptions
- 2. Executive Summary
- 2.1. Introduction
- 3. Market Dynamics
- 3.1. Introduction
- 3.2. Market Drivers
- 3.2.1. ; Technological Advancements; Wide Usage of these Spectrometers in Various Sectors; Rapid Increase in the Global Disease Burden
- 3.3. Market Restrains
- 3.3.1. ; Limited Applications
- 3.4. Market Trends
- 3.4.1 Based on Application
- 3.4.2 Environment Monitoring is Expected to Witness a Healthy Growth in Future
- 4. Market Factor Analysis
- 4.1. Porters Five Forces
- 4.2. Supply/Value Chain
- 4.3. PESTEL analysis
- 4.4. Market Entropy
- 4.5. Patent/Trademark Analysis
- 5. Global TXRF Spectrometer Industry Analysis, Insights and Forecast, 2019-2031
- 5.1. Market Analysis, Insights and Forecast - by Type
- 5.1.1. Atomic Spectrometers
- 5.1.2. Molecular Spectrometers
- 5.1.3. Mass Spectrometers
- 5.2. Market Analysis, Insights and Forecast - by Applictions
- 5.2.1. Pharmaceutical Industry
- 5.2.2. Food Industry
- 5.2.3. Environment Monitoring
- 5.2.4. Other Applications
- 5.3. Market Analysis, Insights and Forecast - by Region
- 5.3.1. North America
- 5.3.2. Europe
- 5.3.3. Asia Pacific
- 5.3.4. Middle East
- 5.3.5. GCC
- 5.3.6. South America
- 5.1. Market Analysis, Insights and Forecast - by Type
- 6. North America TXRF Spectrometer Industry Analysis, Insights and Forecast, 2019-2031
- 6.1. Market Analysis, Insights and Forecast - by Type
- 6.1.1. Atomic Spectrometers
- 6.1.2. Molecular Spectrometers
- 6.1.3. Mass Spectrometers
- 6.2. Market Analysis, Insights and Forecast - by Applictions
- 6.2.1. Pharmaceutical Industry
- 6.2.2. Food Industry
- 6.2.3. Environment Monitoring
- 6.2.4. Other Applications
- 6.1. Market Analysis, Insights and Forecast - by Type
- 7. Europe TXRF Spectrometer Industry Analysis, Insights and Forecast, 2019-2031
- 7.1. Market Analysis, Insights and Forecast - by Type
- 7.1.1. Atomic Spectrometers
- 7.1.2. Molecular Spectrometers
- 7.1.3. Mass Spectrometers
- 7.2. Market Analysis, Insights and Forecast - by Applictions
- 7.2.1. Pharmaceutical Industry
- 7.2.2. Food Industry
- 7.2.3. Environment Monitoring
- 7.2.4. Other Applications
- 7.1. Market Analysis, Insights and Forecast - by Type
- 8. Asia Pacific TXRF Spectrometer Industry Analysis, Insights and Forecast, 2019-2031
- 8.1. Market Analysis, Insights and Forecast - by Type
- 8.1.1. Atomic Spectrometers
- 8.1.2. Molecular Spectrometers
- 8.1.3. Mass Spectrometers
- 8.2. Market Analysis, Insights and Forecast - by Applictions
- 8.2.1. Pharmaceutical Industry
- 8.2.2. Food Industry
- 8.2.3. Environment Monitoring
- 8.2.4. Other Applications
- 8.1. Market Analysis, Insights and Forecast - by Type
- 9. Middle East TXRF Spectrometer Industry Analysis, Insights and Forecast, 2019-2031
- 9.1. Market Analysis, Insights and Forecast - by Type
- 9.1.1. Atomic Spectrometers
- 9.1.2. Molecular Spectrometers
- 9.1.3. Mass Spectrometers
- 9.2. Market Analysis, Insights and Forecast - by Applictions
- 9.2.1. Pharmaceutical Industry
- 9.2.2. Food Industry
- 9.2.3. Environment Monitoring
- 9.2.4. Other Applications
- 9.1. Market Analysis, Insights and Forecast - by Type
- 10. GCC TXRF Spectrometer Industry Analysis, Insights and Forecast, 2019-2031
- 10.1. Market Analysis, Insights and Forecast - by Type
- 10.1.1. Atomic Spectrometers
- 10.1.2. Molecular Spectrometers
- 10.1.3. Mass Spectrometers
- 10.2. Market Analysis, Insights and Forecast - by Applictions
- 10.2.1. Pharmaceutical Industry
- 10.2.2. Food Industry
- 10.2.3. Environment Monitoring
- 10.2.4. Other Applications
- 10.1. Market Analysis, Insights and Forecast - by Type
- 11. South America TXRF Spectrometer Industry Analysis, Insights and Forecast, 2019-2031
- 11.1. Market Analysis, Insights and Forecast - by Type
- 11.1.1. Atomic Spectrometers
- 11.1.2. Molecular Spectrometers
- 11.1.3. Mass Spectrometers
- 11.2. Market Analysis, Insights and Forecast - by Applictions
- 11.2.1. Pharmaceutical Industry
- 11.2.2. Food Industry
- 11.2.3. Environment Monitoring
- 11.2.4. Other Applications
- 11.1. Market Analysis, Insights and Forecast - by Type
- 12. North America TXRF Spectrometer Industry Analysis, Insights and Forecast, 2019-2031
- 12.1. Market Analysis, Insights and Forecast - By Country/Sub-region
- 12.1.1 United States
- 12.1.2 Canada
- 12.1.3 Mexico
- 13. Europe TXRF Spectrometer Industry Analysis, Insights and Forecast, 2019-2031
- 13.1. Market Analysis, Insights and Forecast - By Country/Sub-region
- 13.1.1 Germany
- 13.1.2 United Kingdom
- 13.1.3 France
- 13.1.4 Italy
- 13.1.5 Spain
- 13.1.6 Rest of Europe
- 14. Asia Pacific TXRF Spectrometer Industry Analysis, Insights and Forecast, 2019-2031
- 14.1. Market Analysis, Insights and Forecast - By Country/Sub-region
- 14.1.1 China
- 14.1.2 Japan
- 14.1.3 India
- 14.1.4 Australia
- 14.1.5 South Korea
- 14.1.6 Rest of Asia Pacific
- 15. Middle East TXRF Spectrometer Industry Analysis, Insights and Forecast, 2019-2031
- 15.1. Market Analysis, Insights and Forecast - By Country/Sub-region
- 15.1.1.
- 16. GCC TXRF Spectrometer Industry Analysis, Insights and Forecast, 2019-2031
- 16.1. Market Analysis, Insights and Forecast - By Country/Sub-region
- 16.1.1 South Africa
- 16.1.2 Rest of Middle East
- 17. South America TXRF Spectrometer Industry Analysis, Insights and Forecast, 2019-2031
- 17.1. Market Analysis, Insights and Forecast - By Country/Sub-region
- 17.1.1 Brazil
- 17.1.2 Argentina
- 17.1.3 Rest of South America
- 18. Competitive Analysis
- 18.1. Global Market Share Analysis 2024
- 18.2. Company Profiles
- 18.2.1 Horiba Ltd
- 18.2.1.1. Overview
- 18.2.1.2. Products
- 18.2.1.3. SWOT Analysis
- 18.2.1.4. Recent Developments
- 18.2.1.5. Financials (Based on Availability)
- 18.2.2 Thermo Fisher Scientific
- 18.2.2.1. Overview
- 18.2.2.2. Products
- 18.2.2.3. SWOT Analysis
- 18.2.2.4. Recent Developments
- 18.2.2.5. Financials (Based on Availability)
- 18.2.3 Spectris
- 18.2.3.1. Overview
- 18.2.3.2. Products
- 18.2.3.3. SWOT Analysis
- 18.2.3.4. Recent Developments
- 18.2.3.5. Financials (Based on Availability)
- 18.2.4 G N R - Analytical Instruments Group
- 18.2.4.1. Overview
- 18.2.4.2. Products
- 18.2.4.3. SWOT Analysis
- 18.2.4.4. Recent Developments
- 18.2.4.5. Financials (Based on Availability)
- 18.2.5 SPECTRO Analytical Instruments
- 18.2.5.1. Overview
- 18.2.5.2. Products
- 18.2.5.3. SWOT Analysis
- 18.2.5.4. Recent Developments
- 18.2.5.5. Financials (Based on Availability)
- 18.2.6 EAG Inc
- 18.2.6.1. Overview
- 18.2.6.2. Products
- 18.2.6.3. SWOT Analysis
- 18.2.6.4. Recent Developments
- 18.2.6.5. Financials (Based on Availability)
- 18.2.7 Bruker Corporation
- 18.2.7.1. Overview
- 18.2.7.2. Products
- 18.2.7.3. SWOT Analysis
- 18.2.7.4. Recent Developments
- 18.2.7.5. Financials (Based on Availability)
- 18.2.8 Rigaku
- 18.2.8.1. Overview
- 18.2.8.2. Products
- 18.2.8.3. SWOT Analysis
- 18.2.8.4. Recent Developments
- 18.2.8.5. Financials (Based on Availability)
- 18.2.1 Horiba Ltd
List of Figures
- Figure 1: Global TXRF Spectrometer Industry Revenue Breakdown (Million, %) by Region 2024 & 2032
- Figure 2: Global TXRF Spectrometer Industry Volume Breakdown (K Unit, %) by Region 2024 & 2032
- Figure 3: North America TXRF Spectrometer Industry Revenue (Million), by Country 2024 & 2032
- Figure 4: North America TXRF Spectrometer Industry Volume (K Unit), by Country 2024 & 2032
- Figure 5: North America TXRF Spectrometer Industry Revenue Share (%), by Country 2024 & 2032
- Figure 6: North America TXRF Spectrometer Industry Volume Share (%), by Country 2024 & 2032
- Figure 7: Europe TXRF Spectrometer Industry Revenue (Million), by Country 2024 & 2032
- Figure 8: Europe TXRF Spectrometer Industry Volume (K Unit), by Country 2024 & 2032
- Figure 9: Europe TXRF Spectrometer Industry Revenue Share (%), by Country 2024 & 2032
- Figure 10: Europe TXRF Spectrometer Industry Volume Share (%), by Country 2024 & 2032
- Figure 11: Asia Pacific TXRF Spectrometer Industry Revenue (Million), by Country 2024 & 2032
- Figure 12: Asia Pacific TXRF Spectrometer Industry Volume (K Unit), by Country 2024 & 2032
- Figure 13: Asia Pacific TXRF Spectrometer Industry Revenue Share (%), by Country 2024 & 2032
- Figure 14: Asia Pacific TXRF Spectrometer Industry Volume Share (%), by Country 2024 & 2032
- Figure 15: Middle East TXRF Spectrometer Industry Revenue (Million), by Country 2024 & 2032
- Figure 16: Middle East TXRF Spectrometer Industry Volume (K Unit), by Country 2024 & 2032
- Figure 17: Middle East TXRF Spectrometer Industry Revenue Share (%), by Country 2024 & 2032
- Figure 18: Middle East TXRF Spectrometer Industry Volume Share (%), by Country 2024 & 2032
- Figure 19: GCC TXRF Spectrometer Industry Revenue (Million), by Country 2024 & 2032
- Figure 20: GCC TXRF Spectrometer Industry Volume (K Unit), by Country 2024 & 2032
- Figure 21: GCC TXRF Spectrometer Industry Revenue Share (%), by Country 2024 & 2032
- Figure 22: GCC TXRF Spectrometer Industry Volume Share (%), by Country 2024 & 2032
- Figure 23: South America TXRF Spectrometer Industry Revenue (Million), by Country 2024 & 2032
- Figure 24: South America TXRF Spectrometer Industry Volume (K Unit), by Country 2024 & 2032
- Figure 25: South America TXRF Spectrometer Industry Revenue Share (%), by Country 2024 & 2032
- Figure 26: South America TXRF Spectrometer Industry Volume Share (%), by Country 2024 & 2032
- Figure 27: North America TXRF Spectrometer Industry Revenue (Million), by Type 2024 & 2032
- Figure 28: North America TXRF Spectrometer Industry Volume (K Unit), by Type 2024 & 2032
- Figure 29: North America TXRF Spectrometer Industry Revenue Share (%), by Type 2024 & 2032
- Figure 30: North America TXRF Spectrometer Industry Volume Share (%), by Type 2024 & 2032
- Figure 31: North America TXRF Spectrometer Industry Revenue (Million), by Applictions 2024 & 2032
- Figure 32: North America TXRF Spectrometer Industry Volume (K Unit), by Applictions 2024 & 2032
- Figure 33: North America TXRF Spectrometer Industry Revenue Share (%), by Applictions 2024 & 2032
- Figure 34: North America TXRF Spectrometer Industry Volume Share (%), by Applictions 2024 & 2032
- Figure 35: North America TXRF Spectrometer Industry Revenue (Million), by Country 2024 & 2032
- Figure 36: North America TXRF Spectrometer Industry Volume (K Unit), by Country 2024 & 2032
- Figure 37: North America TXRF Spectrometer Industry Revenue Share (%), by Country 2024 & 2032
- Figure 38: North America TXRF Spectrometer Industry Volume Share (%), by Country 2024 & 2032
- Figure 39: Europe TXRF Spectrometer Industry Revenue (Million), by Type 2024 & 2032
- Figure 40: Europe TXRF Spectrometer Industry Volume (K Unit), by Type 2024 & 2032
- Figure 41: Europe TXRF Spectrometer Industry Revenue Share (%), by Type 2024 & 2032
- Figure 42: Europe TXRF Spectrometer Industry Volume Share (%), by Type 2024 & 2032
- Figure 43: Europe TXRF Spectrometer Industry Revenue (Million), by Applictions 2024 & 2032
- Figure 44: Europe TXRF Spectrometer Industry Volume (K Unit), by Applictions 2024 & 2032
- Figure 45: Europe TXRF Spectrometer Industry Revenue Share (%), by Applictions 2024 & 2032
- Figure 46: Europe TXRF Spectrometer Industry Volume Share (%), by Applictions 2024 & 2032
- Figure 47: Europe TXRF Spectrometer Industry Revenue (Million), by Country 2024 & 2032
- Figure 48: Europe TXRF Spectrometer Industry Volume (K Unit), by Country 2024 & 2032
- Figure 49: Europe TXRF Spectrometer Industry Revenue Share (%), by Country 2024 & 2032
- Figure 50: Europe TXRF Spectrometer Industry Volume Share (%), by Country 2024 & 2032
- Figure 51: Asia Pacific TXRF Spectrometer Industry Revenue (Million), by Type 2024 & 2032
- Figure 52: Asia Pacific TXRF Spectrometer Industry Volume (K Unit), by Type 2024 & 2032
- Figure 53: Asia Pacific TXRF Spectrometer Industry Revenue Share (%), by Type 2024 & 2032
- Figure 54: Asia Pacific TXRF Spectrometer Industry Volume Share (%), by Type 2024 & 2032
- Figure 55: Asia Pacific TXRF Spectrometer Industry Revenue (Million), by Applictions 2024 & 2032
- Figure 56: Asia Pacific TXRF Spectrometer Industry Volume (K Unit), by Applictions 2024 & 2032
- Figure 57: Asia Pacific TXRF Spectrometer Industry Revenue Share (%), by Applictions 2024 & 2032
- Figure 58: Asia Pacific TXRF Spectrometer Industry Volume Share (%), by Applictions 2024 & 2032
- Figure 59: Asia Pacific TXRF Spectrometer Industry Revenue (Million), by Country 2024 & 2032
- Figure 60: Asia Pacific TXRF Spectrometer Industry Volume (K Unit), by Country 2024 & 2032
- Figure 61: Asia Pacific TXRF Spectrometer Industry Revenue Share (%), by Country 2024 & 2032
- Figure 62: Asia Pacific TXRF Spectrometer Industry Volume Share (%), by Country 2024 & 2032
- Figure 63: Middle East TXRF Spectrometer Industry Revenue (Million), by Type 2024 & 2032
- Figure 64: Middle East TXRF Spectrometer Industry Volume (K Unit), by Type 2024 & 2032
- Figure 65: Middle East TXRF Spectrometer Industry Revenue Share (%), by Type 2024 & 2032
- Figure 66: Middle East TXRF Spectrometer Industry Volume Share (%), by Type 2024 & 2032
- Figure 67: Middle East TXRF Spectrometer Industry Revenue (Million), by Applictions 2024 & 2032
- Figure 68: Middle East TXRF Spectrometer Industry Volume (K Unit), by Applictions 2024 & 2032
- Figure 69: Middle East TXRF Spectrometer Industry Revenue Share (%), by Applictions 2024 & 2032
- Figure 70: Middle East TXRF Spectrometer Industry Volume Share (%), by Applictions 2024 & 2032
- Figure 71: Middle East TXRF Spectrometer Industry Revenue (Million), by Country 2024 & 2032
- Figure 72: Middle East TXRF Spectrometer Industry Volume (K Unit), by Country 2024 & 2032
- Figure 73: Middle East TXRF Spectrometer Industry Revenue Share (%), by Country 2024 & 2032
- Figure 74: Middle East TXRF Spectrometer Industry Volume Share (%), by Country 2024 & 2032
- Figure 75: GCC TXRF Spectrometer Industry Revenue (Million), by Type 2024 & 2032
- Figure 76: GCC TXRF Spectrometer Industry Volume (K Unit), by Type 2024 & 2032
- Figure 77: GCC TXRF Spectrometer Industry Revenue Share (%), by Type 2024 & 2032
- Figure 78: GCC TXRF Spectrometer Industry Volume Share (%), by Type 2024 & 2032
- Figure 79: GCC TXRF Spectrometer Industry Revenue (Million), by Applictions 2024 & 2032
- Figure 80: GCC TXRF Spectrometer Industry Volume (K Unit), by Applictions 2024 & 2032
- Figure 81: GCC TXRF Spectrometer Industry Revenue Share (%), by Applictions 2024 & 2032
- Figure 82: GCC TXRF Spectrometer Industry Volume Share (%), by Applictions 2024 & 2032
- Figure 83: GCC TXRF Spectrometer Industry Revenue (Million), by Country 2024 & 2032
- Figure 84: GCC TXRF Spectrometer Industry Volume (K Unit), by Country 2024 & 2032
- Figure 85: GCC TXRF Spectrometer Industry Revenue Share (%), by Country 2024 & 2032
- Figure 86: GCC TXRF Spectrometer Industry Volume Share (%), by Country 2024 & 2032
- Figure 87: South America TXRF Spectrometer Industry Revenue (Million), by Type 2024 & 2032
- Figure 88: South America TXRF Spectrometer Industry Volume (K Unit), by Type 2024 & 2032
- Figure 89: South America TXRF Spectrometer Industry Revenue Share (%), by Type 2024 & 2032
- Figure 90: South America TXRF Spectrometer Industry Volume Share (%), by Type 2024 & 2032
- Figure 91: South America TXRF Spectrometer Industry Revenue (Million), by Applictions 2024 & 2032
- Figure 92: South America TXRF Spectrometer Industry Volume (K Unit), by Applictions 2024 & 2032
- Figure 93: South America TXRF Spectrometer Industry Revenue Share (%), by Applictions 2024 & 2032
- Figure 94: South America TXRF Spectrometer Industry Volume Share (%), by Applictions 2024 & 2032
- Figure 95: South America TXRF Spectrometer Industry Revenue (Million), by Country 2024 & 2032
- Figure 96: South America TXRF Spectrometer Industry Volume (K Unit), by Country 2024 & 2032
- Figure 97: South America TXRF Spectrometer Industry Revenue Share (%), by Country 2024 & 2032
- Figure 98: South America TXRF Spectrometer Industry Volume Share (%), by Country 2024 & 2032
List of Tables
- Table 1: Global TXRF Spectrometer Industry Revenue Million Forecast, by Region 2019 & 2032
- Table 2: Global TXRF Spectrometer Industry Volume K Unit Forecast, by Region 2019 & 2032
- Table 3: Global TXRF Spectrometer Industry Revenue Million Forecast, by Type 2019 & 2032
- Table 4: Global TXRF Spectrometer Industry Volume K Unit Forecast, by Type 2019 & 2032
- Table 5: Global TXRF Spectrometer Industry Revenue Million Forecast, by Applictions 2019 & 2032
- Table 6: Global TXRF Spectrometer Industry Volume K Unit Forecast, by Applictions 2019 & 2032
- Table 7: Global TXRF Spectrometer Industry Revenue Million Forecast, by Region 2019 & 2032
- Table 8: Global TXRF Spectrometer Industry Volume K Unit Forecast, by Region 2019 & 2032
- Table 9: Global TXRF Spectrometer Industry Revenue Million Forecast, by Country 2019 & 2032
- Table 10: Global TXRF Spectrometer Industry Volume K Unit Forecast, by Country 2019 & 2032
- Table 11: United States TXRF Spectrometer Industry Revenue (Million) Forecast, by Application 2019 & 2032
- Table 12: United States TXRF Spectrometer Industry Volume (K Unit) Forecast, by Application 2019 & 2032
- Table 13: Canada TXRF Spectrometer Industry Revenue (Million) Forecast, by Application 2019 & 2032
- Table 14: Canada TXRF Spectrometer Industry Volume (K Unit) Forecast, by Application 2019 & 2032
- Table 15: Mexico TXRF Spectrometer Industry Revenue (Million) Forecast, by Application 2019 & 2032
- Table 16: Mexico TXRF Spectrometer Industry Volume (K Unit) Forecast, by Application 2019 & 2032
- Table 17: Global TXRF Spectrometer Industry Revenue Million Forecast, by Country 2019 & 2032
- Table 18: Global TXRF Spectrometer Industry Volume K Unit Forecast, by Country 2019 & 2032
- Table 19: Germany TXRF Spectrometer Industry Revenue (Million) Forecast, by Application 2019 & 2032
- Table 20: Germany TXRF Spectrometer Industry Volume (K Unit) Forecast, by Application 2019 & 2032
- Table 21: United Kingdom TXRF Spectrometer Industry Revenue (Million) Forecast, by Application 2019 & 2032
- Table 22: United Kingdom TXRF Spectrometer Industry Volume (K Unit) Forecast, by Application 2019 & 2032
- Table 23: France TXRF Spectrometer Industry Revenue (Million) Forecast, by Application 2019 & 2032
- Table 24: France TXRF Spectrometer Industry Volume (K Unit) Forecast, by Application 2019 & 2032
- Table 25: Italy TXRF Spectrometer Industry Revenue (Million) Forecast, by Application 2019 & 2032
- Table 26: Italy TXRF Spectrometer Industry Volume (K Unit) Forecast, by Application 2019 & 2032
- Table 27: Spain TXRF Spectrometer Industry Revenue (Million) Forecast, by Application 2019 & 2032
- Table 28: Spain TXRF Spectrometer Industry Volume (K Unit) Forecast, by Application 2019 & 2032
- Table 29: Rest of Europe TXRF Spectrometer Industry Revenue (Million) Forecast, by Application 2019 & 2032
- Table 30: Rest of Europe TXRF Spectrometer Industry Volume (K Unit) Forecast, by Application 2019 & 2032
- Table 31: Global TXRF Spectrometer Industry Revenue Million Forecast, by Country 2019 & 2032
- Table 32: Global TXRF Spectrometer Industry Volume K Unit Forecast, by Country 2019 & 2032
- Table 33: China TXRF Spectrometer Industry Revenue (Million) Forecast, by Application 2019 & 2032
- Table 34: China TXRF Spectrometer Industry Volume (K Unit) Forecast, by Application 2019 & 2032
- Table 35: Japan TXRF Spectrometer Industry Revenue (Million) Forecast, by Application 2019 & 2032
- Table 36: Japan TXRF Spectrometer Industry Volume (K Unit) Forecast, by Application 2019 & 2032
- Table 37: India TXRF Spectrometer Industry Revenue (Million) Forecast, by Application 2019 & 2032
- Table 38: India TXRF Spectrometer Industry Volume (K Unit) Forecast, by Application 2019 & 2032
- Table 39: Australia TXRF Spectrometer Industry Revenue (Million) Forecast, by Application 2019 & 2032
- Table 40: Australia TXRF Spectrometer Industry Volume (K Unit) Forecast, by Application 2019 & 2032
- Table 41: South Korea TXRF Spectrometer Industry Revenue (Million) Forecast, by Application 2019 & 2032
- Table 42: South Korea TXRF Spectrometer Industry Volume (K Unit) Forecast, by Application 2019 & 2032
- Table 43: Rest of Asia Pacific TXRF Spectrometer Industry Revenue (Million) Forecast, by Application 2019 & 2032
- Table 44: Rest of Asia Pacific TXRF Spectrometer Industry Volume (K Unit) Forecast, by Application 2019 & 2032
- Table 45: Global TXRF Spectrometer Industry Revenue Million Forecast, by Country 2019 & 2032
- Table 46: Global TXRF Spectrometer Industry Volume K Unit Forecast, by Country 2019 & 2032
- Table 47: TXRF Spectrometer Industry Revenue (Million) Forecast, by Application 2019 & 2032
- Table 48: TXRF Spectrometer Industry Volume (K Unit) Forecast, by Application 2019 & 2032
- Table 49: Global TXRF Spectrometer Industry Revenue Million Forecast, by Country 2019 & 2032
- Table 50: Global TXRF Spectrometer Industry Volume K Unit Forecast, by Country 2019 & 2032
- Table 51: South Africa TXRF Spectrometer Industry Revenue (Million) Forecast, by Application 2019 & 2032
- Table 52: South Africa TXRF Spectrometer Industry Volume (K Unit) Forecast, by Application 2019 & 2032
- Table 53: Rest of Middle East TXRF Spectrometer Industry Revenue (Million) Forecast, by Application 2019 & 2032
- Table 54: Rest of Middle East TXRF Spectrometer Industry Volume (K Unit) Forecast, by Application 2019 & 2032
- Table 55: Global TXRF Spectrometer Industry Revenue Million Forecast, by Country 2019 & 2032
- Table 56: Global TXRF Spectrometer Industry Volume K Unit Forecast, by Country 2019 & 2032
- Table 57: Brazil TXRF Spectrometer Industry Revenue (Million) Forecast, by Application 2019 & 2032
- Table 58: Brazil TXRF Spectrometer Industry Volume (K Unit) Forecast, by Application 2019 & 2032
- Table 59: Argentina TXRF Spectrometer Industry Revenue (Million) Forecast, by Application 2019 & 2032
- Table 60: Argentina TXRF Spectrometer Industry Volume (K Unit) Forecast, by Application 2019 & 2032
- Table 61: Rest of South America TXRF Spectrometer Industry Revenue (Million) Forecast, by Application 2019 & 2032
- Table 62: Rest of South America TXRF Spectrometer Industry Volume (K Unit) Forecast, by Application 2019 & 2032
- Table 63: Global TXRF Spectrometer Industry Revenue Million Forecast, by Type 2019 & 2032
- Table 64: Global TXRF Spectrometer Industry Volume K Unit Forecast, by Type 2019 & 2032
- Table 65: Global TXRF Spectrometer Industry Revenue Million Forecast, by Applictions 2019 & 2032
- Table 66: Global TXRF Spectrometer Industry Volume K Unit Forecast, by Applictions 2019 & 2032
- Table 67: Global TXRF Spectrometer Industry Revenue Million Forecast, by Country 2019 & 2032
- Table 68: Global TXRF Spectrometer Industry Volume K Unit Forecast, by Country 2019 & 2032
- Table 69: United States TXRF Spectrometer Industry Revenue (Million) Forecast, by Application 2019 & 2032
- Table 70: United States TXRF Spectrometer Industry Volume (K Unit) Forecast, by Application 2019 & 2032
- Table 71: Canada TXRF Spectrometer Industry Revenue (Million) Forecast, by Application 2019 & 2032
- Table 72: Canada TXRF Spectrometer Industry Volume (K Unit) Forecast, by Application 2019 & 2032
- Table 73: Mexico TXRF Spectrometer Industry Revenue (Million) Forecast, by Application 2019 & 2032
- Table 74: Mexico TXRF Spectrometer Industry Volume (K Unit) Forecast, by Application 2019 & 2032
- Table 75: Global TXRF Spectrometer Industry Revenue Million Forecast, by Type 2019 & 2032
- Table 76: Global TXRF Spectrometer Industry Volume K Unit Forecast, by Type 2019 & 2032
- Table 77: Global TXRF Spectrometer Industry Revenue Million Forecast, by Applictions 2019 & 2032
- Table 78: Global TXRF Spectrometer Industry Volume K Unit Forecast, by Applictions 2019 & 2032
- Table 79: Global TXRF Spectrometer Industry Revenue Million Forecast, by Country 2019 & 2032
- Table 80: Global TXRF Spectrometer Industry Volume K Unit Forecast, by Country 2019 & 2032
- Table 81: Germany TXRF Spectrometer Industry Revenue (Million) Forecast, by Application 2019 & 2032
- Table 82: Germany TXRF Spectrometer Industry Volume (K Unit) Forecast, by Application 2019 & 2032
- Table 83: United Kingdom TXRF Spectrometer Industry Revenue (Million) Forecast, by Application 2019 & 2032
- Table 84: United Kingdom TXRF Spectrometer Industry Volume (K Unit) Forecast, by Application 2019 & 2032
- Table 85: France TXRF Spectrometer Industry Revenue (Million) Forecast, by Application 2019 & 2032
- Table 86: France TXRF Spectrometer Industry Volume (K Unit) Forecast, by Application 2019 & 2032
- Table 87: Italy TXRF Spectrometer Industry Revenue (Million) Forecast, by Application 2019 & 2032
- Table 88: Italy TXRF Spectrometer Industry Volume (K Unit) Forecast, by Application 2019 & 2032
- Table 89: Spain TXRF Spectrometer Industry Revenue (Million) Forecast, by Application 2019 & 2032
- Table 90: Spain TXRF Spectrometer Industry Volume (K Unit) Forecast, by Application 2019 & 2032
- Table 91: Rest of Europe TXRF Spectrometer Industry Revenue (Million) Forecast, by Application 2019 & 2032
- Table 92: Rest of Europe TXRF Spectrometer Industry Volume (K Unit) Forecast, by Application 2019 & 2032
- Table 93: Global TXRF Spectrometer Industry Revenue Million Forecast, by Type 2019 & 2032
- Table 94: Global TXRF Spectrometer Industry Volume K Unit Forecast, by Type 2019 & 2032
- Table 95: Global TXRF Spectrometer Industry Revenue Million Forecast, by Applictions 2019 & 2032
- Table 96: Global TXRF Spectrometer Industry Volume K Unit Forecast, by Applictions 2019 & 2032
- Table 97: Global TXRF Spectrometer Industry Revenue Million Forecast, by Country 2019 & 2032
- Table 98: Global TXRF Spectrometer Industry Volume K Unit Forecast, by Country 2019 & 2032
- Table 99: China TXRF Spectrometer Industry Revenue (Million) Forecast, by Application 2019 & 2032
- Table 100: China TXRF Spectrometer Industry Volume (K Unit) Forecast, by Application 2019 & 2032
- Table 101: Japan TXRF Spectrometer Industry Revenue (Million) Forecast, by Application 2019 & 2032
- Table 102: Japan TXRF Spectrometer Industry Volume (K Unit) Forecast, by Application 2019 & 2032
- Table 103: India TXRF Spectrometer Industry Revenue (Million) Forecast, by Application 2019 & 2032
- Table 104: India TXRF Spectrometer Industry Volume (K Unit) Forecast, by Application 2019 & 2032
- Table 105: Australia TXRF Spectrometer Industry Revenue (Million) Forecast, by Application 2019 & 2032
- Table 106: Australia TXRF Spectrometer Industry Volume (K Unit) Forecast, by Application 2019 & 2032
- Table 107: South Korea TXRF Spectrometer Industry Revenue (Million) Forecast, by Application 2019 & 2032
- Table 108: South Korea TXRF Spectrometer Industry Volume (K Unit) Forecast, by Application 2019 & 2032
- Table 109: Rest of Asia Pacific TXRF Spectrometer Industry Revenue (Million) Forecast, by Application 2019 & 2032
- Table 110: Rest of Asia Pacific TXRF Spectrometer Industry Volume (K Unit) Forecast, by Application 2019 & 2032
- Table 111: Global TXRF Spectrometer Industry Revenue Million Forecast, by Type 2019 & 2032
- Table 112: Global TXRF Spectrometer Industry Volume K Unit Forecast, by Type 2019 & 2032
- Table 113: Global TXRF Spectrometer Industry Revenue Million Forecast, by Applictions 2019 & 2032
- Table 114: Global TXRF Spectrometer Industry Volume K Unit Forecast, by Applictions 2019 & 2032
- Table 115: Global TXRF Spectrometer Industry Revenue Million Forecast, by Country 2019 & 2032
- Table 116: Global TXRF Spectrometer Industry Volume K Unit Forecast, by Country 2019 & 2032
- Table 117: Global TXRF Spectrometer Industry Revenue Million Forecast, by Type 2019 & 2032
- Table 118: Global TXRF Spectrometer Industry Volume K Unit Forecast, by Type 2019 & 2032
- Table 119: Global TXRF Spectrometer Industry Revenue Million Forecast, by Applictions 2019 & 2032
- Table 120: Global TXRF Spectrometer Industry Volume K Unit Forecast, by Applictions 2019 & 2032
- Table 121: Global TXRF Spectrometer Industry Revenue Million Forecast, by Country 2019 & 2032
- Table 122: Global TXRF Spectrometer Industry Volume K Unit Forecast, by Country 2019 & 2032
- Table 123: South Africa TXRF Spectrometer Industry Revenue (Million) Forecast, by Application 2019 & 2032
- Table 124: South Africa TXRF Spectrometer Industry Volume (K Unit) Forecast, by Application 2019 & 2032
- Table 125: Rest of Middle East TXRF Spectrometer Industry Revenue (Million) Forecast, by Application 2019 & 2032
- Table 126: Rest of Middle East TXRF Spectrometer Industry Volume (K Unit) Forecast, by Application 2019 & 2032
- Table 127: Global TXRF Spectrometer Industry Revenue Million Forecast, by Type 2019 & 2032
- Table 128: Global TXRF Spectrometer Industry Volume K Unit Forecast, by Type 2019 & 2032
- Table 129: Global TXRF Spectrometer Industry Revenue Million Forecast, by Applictions 2019 & 2032
- Table 130: Global TXRF Spectrometer Industry Volume K Unit Forecast, by Applictions 2019 & 2032
- Table 131: Global TXRF Spectrometer Industry Revenue Million Forecast, by Country 2019 & 2032
- Table 132: Global TXRF Spectrometer Industry Volume K Unit Forecast, by Country 2019 & 2032
- Table 133: Brazil TXRF Spectrometer Industry Revenue (Million) Forecast, by Application 2019 & 2032
- Table 134: Brazil TXRF Spectrometer Industry Volume (K Unit) Forecast, by Application 2019 & 2032
- Table 135: Argentina TXRF Spectrometer Industry Revenue (Million) Forecast, by Application 2019 & 2032
- Table 136: Argentina TXRF Spectrometer Industry Volume (K Unit) Forecast, by Application 2019 & 2032
- Table 137: Rest of South America TXRF Spectrometer Industry Revenue (Million) Forecast, by Application 2019 & 2032
- Table 138: Rest of South America TXRF Spectrometer Industry Volume (K Unit) Forecast, by Application 2019 & 2032
Frequently Asked Questions
1. What is the projected Compound Annual Growth Rate (CAGR) of the TXRF Spectrometer Industry?
The projected CAGR is approximately 5.50%.
2. Which companies are prominent players in the TXRF Spectrometer Industry?
Key companies in the market include Horiba Ltd, Thermo Fisher Scientific, Spectris, G N R - Analytical Instruments Group, SPECTRO Analytical Instruments, EAG Inc, Bruker Corporation, Rigaku.
3. What are the main segments of the TXRF Spectrometer Industry?
The market segments include Type, Applictions.
4. Can you provide details about the market size?
The market size is estimated to be USD XX Million as of 2022.
5. What are some drivers contributing to market growth?
; Technological Advancements; Wide Usage of these Spectrometers in Various Sectors; Rapid Increase in the Global Disease Burden.
6. What are the notable trends driving market growth?
Based on Application. Environment Monitoring is Expected to Witness a Healthy Growth in Future.
7. Are there any restraints impacting market growth?
; Limited Applications.
8. Can you provide examples of recent developments in the market?
N/A
9. What pricing options are available for accessing the report?
Pricing options include single-user, multi-user, and enterprise licenses priced at USD 4750, USD 5250, and USD 8750 respectively.
10. Is the market size provided in terms of value or volume?
The market size is provided in terms of value, measured in Million and volume, measured in K Unit.
11. Are there any specific market keywords associated with the report?
Yes, the market keyword associated with the report is "TXRF Spectrometer Industry," which aids in identifying and referencing the specific market segment covered.
12. How do I determine which pricing option suits my needs best?
The pricing options vary based on user requirements and access needs. Individual users may opt for single-user licenses, while businesses requiring broader access may choose multi-user or enterprise licenses for cost-effective access to the report.
13. Are there any additional resources or data provided in the TXRF Spectrometer Industry report?
While the report offers comprehensive insights, it's advisable to review the specific contents or supplementary materials provided to ascertain if additional resources or data are available.
14. How can I stay updated on further developments or reports in the TXRF Spectrometer Industry?
To stay informed about further developments, trends, and reports in the TXRF Spectrometer Industry, consider subscribing to industry newsletters, following relevant companies and organizations, or regularly checking reputable industry news sources and publications.
Methodology
Step 1 - Identification of Relevant Samples Size from Population Database


Step 2 - Approaches for Defining Global Market Size (Value, Volume* & Price*)

Note*: In applicable scenarios
Step 3 - Data Sources
Primary Research
- Web Analytics
- Survey Reports
- Research Institute
- Latest Research Reports
- Opinion Leaders
Secondary Research
- Annual Reports
- White Paper
- Latest Press Release
- Industry Association
- Paid Database
- Investor Presentations

Step 4 - Data Triangulation
Involves using different sources of information in order to increase the validity of a study
These sources are likely to be stakeholders in a program - participants, other researchers, program staff, other community members, and so on.
Then we put all data in single framework & apply various statistical tools to find out the dynamic on the market.
During the analysis stage, feedback from the stakeholder groups would be compared to determine areas of agreement as well as areas of divergence


