

Key Insights
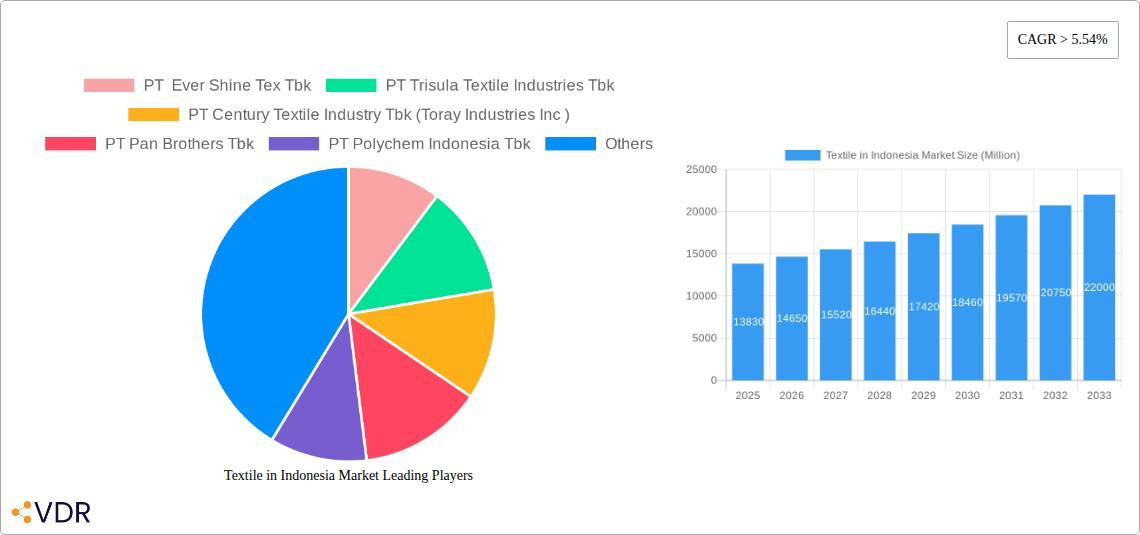
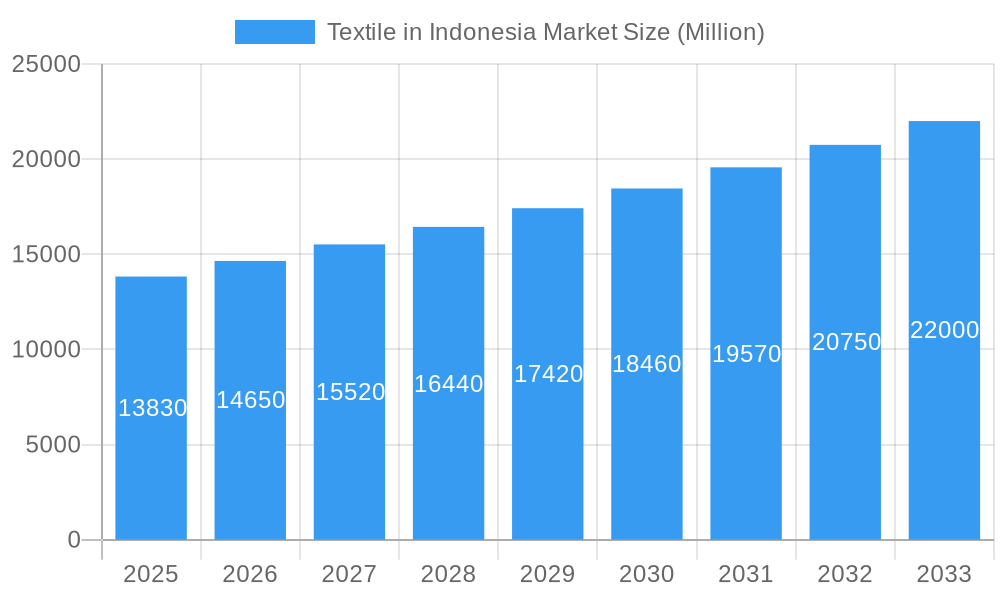
The Indonesian textile market is poised for robust expansion, projected to reach a significant valuation of USD 13.83 billion. This growth is underpinned by a compelling Compound Annual Growth Rate (CAGR) exceeding 5.54%, indicating a dynamic and evolving industry. A key driver of this upward trajectory is the burgeoning demand across diverse applications, most notably in clothing, which consistently represents a substantial portion of textile consumption. Beyond apparel, the industrial/technical and household segments are also exhibiting strong growth, fueled by increasing infrastructure development, rising disposable incomes, and a growing consumer preference for quality home furnishings. The market's expansion is further propelled by the versatility of its material base, with cotton and synthetics leading the charge due to their affordability, durability, and wide-ranging applications. Innovations in processing, such as advancements in woven and non-woven techniques, are also contributing to the creation of higher-value products and opening new market avenues. The Indonesian government's supportive policies, coupled with the nation's strategic location as a manufacturing hub, are attracting significant investment, fostering both domestic production and export capabilities.
Textile in Indonesia Market Market Size (In Billion)
While the market demonstrates considerable strength, certain factors warrant strategic consideration. Increasing competition from other emerging textile powerhouses and potential fluctuations in raw material prices could present challenges. Furthermore, a growing emphasis on sustainability and ethical sourcing by global brands necessitates adherence to stringent environmental and social standards. To navigate these dynamics effectively, companies are actively focusing on product innovation, vertical integration, and expanding their presence in both domestic and international markets. The competitive landscape features prominent players such as PT Ever Shine Tex Tbk, PT Trisula Textile Industries Tbk, and PT Century Textile Industry Tbk, alongside international entities like Toray Industries Inc. These companies are instrumental in shaping market trends through their investments in advanced manufacturing technologies and their commitment to meeting evolving consumer demands. The Asia Pacific region, particularly China and India, along with domestic growth within Indonesia, are expected to be the primary growth engines for the textile industry.
Textile in Indonesia Market Company Market Share
Unveiling the Textile in Indonesia Market: A Comprehensive Analysis (2019-2033)
This in-depth report provides a detailed examination of the Textile in Indonesia Market, offering critical insights into its dynamics, growth trajectory, and competitive landscape from 2019 to 2033. With a base year of 2025 and a forecast period extending to 2033, this analysis is essential for stakeholders seeking to navigate and capitalize on this dynamic sector. We delve into parent and child market segments, exploring applications, materials, and processing techniques, and integrate high-traffic keywords to ensure maximum visibility for industry professionals.
Textile in Indonesia Market Market Dynamics & Structure
The Indonesian textile market is characterized by a moderate to high degree of concentration, with established players like PT Sri Rejeki Isman Tbk and PT Pan Brothers Tbk holding significant market share. Technological innovation is driven by advancements in sustainable processing, digital printing, and smart textiles, though adoption rates can be hindered by capital investment requirements. Regulatory frameworks, including government support for the garment industry and export incentives, play a crucial role in shaping market competitiveness. Competitive product substitutes are emerging, particularly in the form of recycled and bio-based materials, influencing consumer choices. End-user demographics show a growing preference for ethically produced and high-performance textiles, especially within the burgeoning middle class. Mergers and acquisitions (M&A) are relatively moderate, with strategic partnerships being more prevalent as companies seek to expand their product portfolios and market reach.
- Market Concentration: Moderate to High, with key players dominating specific niches.
- Technological Innovation Drivers: Sustainability, digitalization, smart textiles.
- Regulatory Frameworks: Government incentives, trade agreements, environmental regulations.
- Competitive Product Substitutes: Recycled fibers, bio-based materials.
- End-User Demographics: Growing demand for sustainable and performance-driven textiles.
- M&A Trends: Strategic partnerships and vertical integration are more common than outright acquisitions.
Textile in Indonesia Market Growth Trends & Insights
The Textile in Indonesia Market is projected to experience robust growth, fueled by increasing domestic consumption and a strong export orientation. Market size evolution indicates a steady upward trajectory, driven by the nation's growing population and expanding manufacturing capabilities. Adoption rates for advanced textile technologies are gradually increasing, spurred by global trends towards efficiency and sustainability. Technological disruptions, such as the integration of AI in design and production, are beginning to reshape operational models. Consumer behavior shifts are evident, with a rising demand for fashion-forward, comfortable, and environmentally conscious apparel. The anticipated Compound Annual Growth Rate (CAGR) for the forecast period is estimated to be around 5.5% to 6.8%, with market penetration expected to deepen across various segments, particularly in the Clothing application and Synthetics material categories. The report leverages market research data and industry expert analysis to deliver these comprehensive insights.
Dominant Regions, Countries, or Segments in Textile in Indonesia Market
Within the Textile in Indonesia Market, the Clothing application segment consistently drives market growth, accounting for an estimated 55-60% of the total market value. This dominance is attributed to Indonesia's large and young population, coupled with its established position as a global apparel manufacturing hub. The Synthetics material segment is another significant contributor, with polyester and nylon dominating due to their versatility, durability, and cost-effectiveness, holding an approximate 40-45% market share. Regionally, Java remains the industrial heartland, concentrating major manufacturing facilities and contributing to over 70% of the national textile output.
- Dominant Application: Clothing, driven by domestic consumption and export demand.
- Key Drivers: Growing middle class, fashion trends, large population.
- Market Share: Estimated 55-60%.
- Dominant Material: Synthetics (Polyester, Nylon), due to their widespread use in apparel and industrial applications.
- Key Drivers: Cost-effectiveness, durability, versatility, technological advancements in synthetic fiber production.
- Market Share: Estimated 40-45%.
- Dominant Region: Java, as the primary manufacturing and industrial hub.
- Key Drivers: Infrastructure, skilled labor, government support, established supply chains.
- Contribution to National Output: Over 70%.
Textile in Indonesia Market Product Landscape
The product landscape within the Indonesian textile market is diverse and evolving, with a strong emphasis on woven and non-woven fabrics for a multitude of applications. Innovations are focused on enhancing fabric performance, such as moisture-wicking, UV protection, and antimicrobial properties, particularly for the Clothing and Industrial/Technical segments. The increasing demand for sustainable textiles is driving the development of eco-friendly materials and production processes. Key performance metrics being targeted include durability, breathability, and reduced environmental impact. The integration of digital printing technologies is also enabling greater design flexibility and faster turnaround times, enhancing unique selling propositions for manufacturers.
Key Drivers, Barriers & Challenges in Textile in Indonesia Market
Key Drivers:
- Growing Domestic Demand: Indonesia's large and youthful population, coupled with rising disposable incomes, fuels continuous demand for textiles, especially in the Clothing segment.
- Export Competitiveness: Indonesia's strategic location, competitive labor costs, and established manufacturing infrastructure make it an attractive export destination for global apparel brands.
- Government Support: Initiatives aimed at boosting the textile and garment industry, including tax incentives and trade promotion, are significant growth accelerators.
- Technological Advancements: Adoption of modern machinery and sustainable production techniques enhances efficiency and product quality.
Barriers & Challenges:
- Raw Material Price Volatility: Fluctuations in the prices of raw materials like cotton and petrochemicals can impact profitability.
- Supply Chain Disruptions: Global events and logistical complexities can affect the timely availability of raw materials and the delivery of finished goods.
- Intense Competition: Both domestic and international competition puts pressure on pricing and profit margins.
- Skilled Labor Shortage: A lack of adequately trained personnel in specialized textile manufacturing processes can be a constraint.
- Environmental Regulations: Increasing stringency of environmental regulations may necessitate additional investment in compliance.
Emerging Opportunities in Textile in Indonesia Market
Emerging opportunities in the Textile in Indonesia Market lie in the growing demand for sustainable and recycled textiles, catering to environmentally conscious consumers. The expansion of technical textiles for specialized industrial applications, such as automotive and medical sectors, presents a significant growth avenue. Furthermore, the increasing adoption of e-commerce and direct-to-consumer models offers new avenues for market penetration and brand building for textile manufacturers. There is also a burgeoning opportunity in niche segments like activewear and athleisure, aligning with evolving lifestyle trends.
Growth Accelerators in the Textile in Indonesia Market Industry
Growth in the Indonesian textile industry is being significantly accelerated by technological breakthroughs in sustainable material production and innovative processing techniques, such as digital textile printing and 3D knitting. Strategic partnerships between local manufacturers and international brands are expanding market access and fostering knowledge transfer. Furthermore, government initiatives promoting export diversification and investment in R&D are critical catalysts. The increasing focus on traceability and transparency in the supply chain is also becoming a growth accelerator, building consumer trust and brand loyalty.
Key Players Shaping the Textile in Indonesia Market Market
- PT Ever Shine Tex Tbk
- PT Trisula Textile Industries Tbk
- PT Century Textile Industry Tbk (Toray Industries Inc)
- PT Pan Brothers Tbk
- PT Polychem Indonesia Tbk
- PT Sri Rejeki Isman Tbk
- PT Indo Kordsa Tbk
- PT Tifico Fiber Indonesia Tbk
- PT Panasia Group
- PT Asia Pacific Fibers Tbk
- PT Tyfountex Indonesia
- PT Eratex Djaja Tbk
- PT Argo Pantes Tbk
- Indorama Corporation (PT Indo-Rama Synthetics Tbk)
- 6 3 Other Companies
Notable Milestones in Textile in Indonesia Market Sector
- November 2023: WHP Global, a leading brand management firm, has inked significant licensing agreements to expand the reach of the iconic EXPRESS brand. The deals include partnerships with PT MAP in Indonesia, Kemsa in Paraguay, and a strategic collaboration with IB Group in Mexico, further solidifying the brand's foothold in these markets.
- October 2023: Renewcell, a leading textile-to-textile recycling firm, recently expanded its network by partnering with Southeast Asian Circulose Suppliers, notably including Indonesia. The move positions Renewcell as a frontrunner in the global circular fashion movement. The company anticipates that its expansion in Southeast Asia and Europe will bolster the availability of fashion materials derived from its eco-friendly cellulose pulp.
In-Depth Textile in Indonesia Market Market Outlook
The future outlook for the Textile in Indonesia Market is exceptionally promising, driven by sustained demand from both domestic and international markets. Growth accelerators such as the ongoing digital transformation in manufacturing, coupled with a strong global push towards sustainable and circular fashion, will redefine the industry. Strategic investments in advanced machinery, eco-friendly materials, and skilled workforce development are poised to further enhance Indonesia's competitive edge. The market is expected to witness increased collaboration and innovation, paving the way for new product development and market expansion opportunities, particularly in high-value technical textiles and specialized apparel segments.
Textile in Indonesia Market Segmentation
-
1. Application
- 1.1. Clothing
- 1.2. Industrial/Technical
- 1.3. Household
- 1.4. Other Applications
-
2. Material
- 2.1. Cotton
- 2.2. Jute
- 2.3. Silk
- 2.4. Synthetics
- 2.5. Wool
- 2.6. Other Materials
-
3. Process
- 3.1. Woven
- 3.2. Non-woven
Textile in Indonesia Market Segmentation By Geography
-
1. North America
- 1.1. United States
- 1.2. Canada
- 1.3. Mexico
-
2. South America
- 2.1. Brazil
- 2.2. Argentina
- 2.3. Rest of South America
-
3. Europe
- 3.1. United Kingdom
- 3.2. Germany
- 3.3. France
- 3.4. Italy
- 3.5. Spain
- 3.6. Russia
- 3.7. Benelux
- 3.8. Nordics
- 3.9. Rest of Europe
-
4. Middle East & Africa
- 4.1. Turkey
- 4.2. Israel
- 4.3. GCC
- 4.4. North Africa
- 4.5. South Africa
- 4.6. Rest of Middle East & Africa
-
5. Asia Pacific
- 5.1. China
- 5.2. India
- 5.3. Japan
- 5.4. South Korea
- 5.5. ASEAN
- 5.6. Oceania
- 5.7. Rest of Asia Pacific
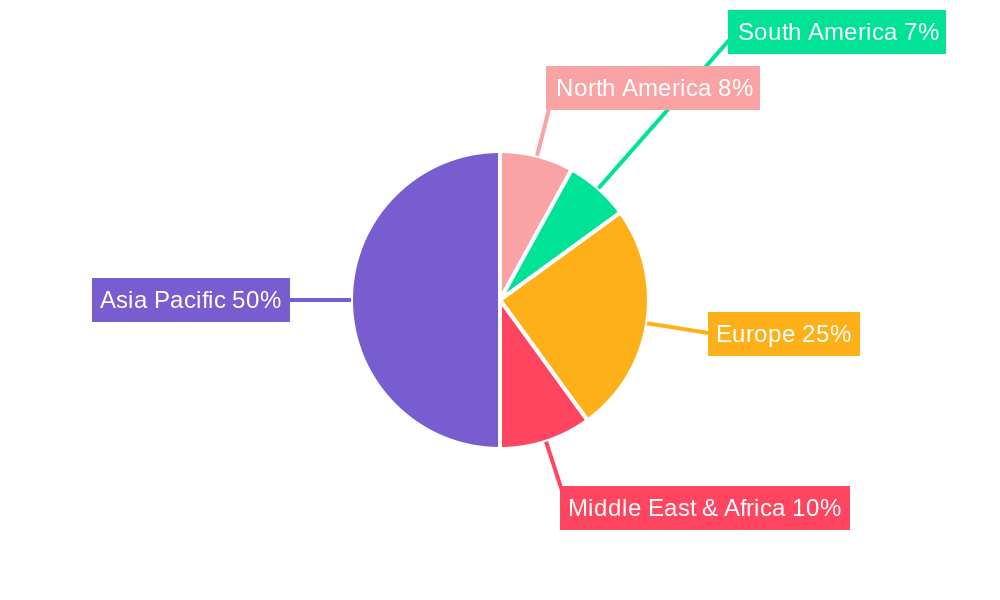
Textile in Indonesia Market Regional Market Share
Geographic Coverage of Textile in Indonesia Market
Textile in Indonesia Market REPORT HIGHLIGHTS
| Aspects | Details |
|---|---|
| Study Period | 2020-2034 |
| Base Year | 2025 |
| Estimated Year | 2026 |
| Forecast Period | 2026-2034 |
| Historical Period | 2020-2025 |
| Growth Rate | CAGR of > 5.54% from 2020-2034 |
| Segmentation |
|
Table of Contents
- 1. Introduction
- 1.1. Research Scope
- 1.2. Market Segmentation
- 1.3. Research Objective
- 1.4. Definitions and Assumptions
- 2. Executive Summary
- 2.1. Market Snapshot
- 3. Market Dynamics
- 3.1. Market Drivers
- 3.2. Market Restrains
- 3.3. Market Trends
- 3.4. Market Opportunities
- 4. Market Factor Analysis
- 4.1. Porters Five Forces
- 4.1.1. Bargaining Power of Suppliers
- 4.1.2. Bargaining Power of Buyers
- 4.1.3. Threat of New Entrants
- 4.1.4. Threat of Substitutes
- 4.1.5. Competitive Rivalry
- 4.2. PESTEL analysis
- 4.3. BCG Analysis
- 4.3.1. Stars (High Growth, High Market Share)
- 4.3.2. Cash Cows (Low Growth, High Market Share)
- 4.3.3. Question Mark (High Growth, Low Market Share)
- 4.3.4. Dogs (Low Growth, Low Market Share)
- 4.4. Ansoff Matrix Analysis
- 4.5. Supply Chain Analysis
- 4.6. Regulatory Landscape
- 4.7. Current Market Potential and Opportunity Assessment (TAM–SAM–SOM Framework)
- 4.8. VDR Analyst Note
- 4.1. Porters Five Forces
- 5. Market Analysis, Insights and Forecast 2021-2033
- 5.1. Market Analysis, Insights and Forecast - by Application
- 5.1.1. Clothing
- 5.1.2. Industrial/Technical
- 5.1.3. Household
- 5.1.4. Other Applications
- 5.2. Market Analysis, Insights and Forecast - by Material
- 5.2.1. Cotton
- 5.2.2. Jute
- 5.2.3. Silk
- 5.2.4. Synthetics
- 5.2.5. Wool
- 5.2.6. Other Materials
- 5.3. Market Analysis, Insights and Forecast - by Process
- 5.3.1. Woven
- 5.3.2. Non-woven
- 5.4. Market Analysis, Insights and Forecast - by Region
- 5.4.1. North America
- 5.4.2. South America
- 5.4.3. Europe
- 5.4.4. Middle East & Africa
- 5.4.5. Asia Pacific
- 5.1. Market Analysis, Insights and Forecast - by Application
- 6. Global Textile in Indonesia Market Analysis, Insights and Forecast, 2021-2033
- 6.1. Market Analysis, Insights and Forecast - by Application
- 6.1.1. Clothing
- 6.1.2. Industrial/Technical
- 6.1.3. Household
- 6.1.4. Other Applications
- 6.2. Market Analysis, Insights and Forecast - by Material
- 6.2.1. Cotton
- 6.2.2. Jute
- 6.2.3. Silk
- 6.2.4. Synthetics
- 6.2.5. Wool
- 6.2.6. Other Materials
- 6.3. Market Analysis, Insights and Forecast - by Process
- 6.3.1. Woven
- 6.3.2. Non-woven
- 6.1. Market Analysis, Insights and Forecast - by Application
- 7. North America Textile in Indonesia Market Analysis, Insights and Forecast, 2021-2033
- 7.1. Market Analysis, Insights and Forecast - by Application
- 7.1.1. Clothing
- 7.1.2. Industrial/Technical
- 7.1.3. Household
- 7.1.4. Other Applications
- 7.2. Market Analysis, Insights and Forecast - by Material
- 7.2.1. Cotton
- 7.2.2. Jute
- 7.2.3. Silk
- 7.2.4. Synthetics
- 7.2.5. Wool
- 7.2.6. Other Materials
- 7.3. Market Analysis, Insights and Forecast - by Process
- 7.3.1. Woven
- 7.3.2. Non-woven
- 7.1. Market Analysis, Insights and Forecast - by Application
- 8. South America Textile in Indonesia Market Analysis, Insights and Forecast, 2021-2033
- 8.1. Market Analysis, Insights and Forecast - by Application
- 8.1.1. Clothing
- 8.1.2. Industrial/Technical
- 8.1.3. Household
- 8.1.4. Other Applications
- 8.2. Market Analysis, Insights and Forecast - by Material
- 8.2.1. Cotton
- 8.2.2. Jute
- 8.2.3. Silk
- 8.2.4. Synthetics
- 8.2.5. Wool
- 8.2.6. Other Materials
- 8.3. Market Analysis, Insights and Forecast - by Process
- 8.3.1. Woven
- 8.3.2. Non-woven
- 8.1. Market Analysis, Insights and Forecast - by Application
- 9. Europe Textile in Indonesia Market Analysis, Insights and Forecast, 2021-2033
- 9.1. Market Analysis, Insights and Forecast - by Application
- 9.1.1. Clothing
- 9.1.2. Industrial/Technical
- 9.1.3. Household
- 9.1.4. Other Applications
- 9.2. Market Analysis, Insights and Forecast - by Material
- 9.2.1. Cotton
- 9.2.2. Jute
- 9.2.3. Silk
- 9.2.4. Synthetics
- 9.2.5. Wool
- 9.2.6. Other Materials
- 9.3. Market Analysis, Insights and Forecast - by Process
- 9.3.1. Woven
- 9.3.2. Non-woven
- 9.1. Market Analysis, Insights and Forecast - by Application
- 10. Middle East & Africa Textile in Indonesia Market Analysis, Insights and Forecast, 2021-2033
- 10.1. Market Analysis, Insights and Forecast - by Application
- 10.1.1. Clothing
- 10.1.2. Industrial/Technical
- 10.1.3. Household
- 10.1.4. Other Applications
- 10.2. Market Analysis, Insights and Forecast - by Material
- 10.2.1. Cotton
- 10.2.2. Jute
- 10.2.3. Silk
- 10.2.4. Synthetics
- 10.2.5. Wool
- 10.2.6. Other Materials
- 10.3. Market Analysis, Insights and Forecast - by Process
- 10.3.1. Woven
- 10.3.2. Non-woven
- 10.1. Market Analysis, Insights and Forecast - by Application
- 11. Asia Pacific Textile in Indonesia Market Analysis, Insights and Forecast, 2021-2033
- 11.1. Market Analysis, Insights and Forecast - by Application
- 11.1.1. Clothing
- 11.1.2. Industrial/Technical
- 11.1.3. Household
- 11.1.4. Other Applications
- 11.2. Market Analysis, Insights and Forecast - by Material
- 11.2.1. Cotton
- 11.2.2. Jute
- 11.2.3. Silk
- 11.2.4. Synthetics
- 11.2.5. Wool
- 11.2.6. Other Materials
- 11.3. Market Analysis, Insights and Forecast - by Process
- 11.3.1. Woven
- 11.3.2. Non-woven
- 11.1. Market Analysis, Insights and Forecast - by Application
- 12. Competitive Analysis
- 12.1. Company Profiles
- 12.1.1 PT Ever Shine Tex Tbk
- 12.1.1.1. Company Overview
- 12.1.1.2. Products
- 12.1.1.3. Company Financials
- 12.1.1.4. SWOT Analysis
- 12.1.2 PT Trisula Textile Industries Tbk
- 12.1.2.1. Company Overview
- 12.1.2.2. Products
- 12.1.2.3. Company Financials
- 12.1.2.4. SWOT Analysis
- 12.1.3 PT Century Textile Industry Tbk (Toray Industries Inc )
- 12.1.3.1. Company Overview
- 12.1.3.2. Products
- 12.1.3.3. Company Financials
- 12.1.3.4. SWOT Analysis
- 12.1.4 PT Pan Brothers Tbk
- 12.1.4.1. Company Overview
- 12.1.4.2. Products
- 12.1.4.3. Company Financials
- 12.1.4.4. SWOT Analysis
- 12.1.5 PT Polychem Indonesia Tbk
- 12.1.5.1. Company Overview
- 12.1.5.2. Products
- 12.1.5.3. Company Financials
- 12.1.5.4. SWOT Analysis
- 12.1.6 PT Sri Rejeki Isman Tbk
- 12.1.6.1. Company Overview
- 12.1.6.2. Products
- 12.1.6.3. Company Financials
- 12.1.6.4. SWOT Analysis
- 12.1.7 PT Indo Kordsa Tbk
- 12.1.7.1. Company Overview
- 12.1.7.2. Products
- 12.1.7.3. Company Financials
- 12.1.7.4. SWOT Analysis
- 12.1.8 PT Tifico Fiber Indonesia Tbk
- 12.1.8.1. Company Overview
- 12.1.8.2. Products
- 12.1.8.3. Company Financials
- 12.1.8.4. SWOT Analysis
- 12.1.9 PT Panasia Group
- 12.1.9.1. Company Overview
- 12.1.9.2. Products
- 12.1.9.3. Company Financials
- 12.1.9.4. SWOT Analysis
- 12.1.10 PT Asia Pacific Fibers Tbk
- 12.1.10.1. Company Overview
- 12.1.10.2. Products
- 12.1.10.3. Company Financials
- 12.1.10.4. SWOT Analysis
- 12.1.11 PT Tyfountex Indonesia
- 12.1.11.1. Company Overview
- 12.1.11.2. Products
- 12.1.11.3. Company Financials
- 12.1.11.4. SWOT Analysis
- 12.1.12 PT Eratex Djaja Tbk
- 12.1.12.1. Company Overview
- 12.1.12.2. Products
- 12.1.12.3. Company Financials
- 12.1.12.4. SWOT Analysis
- 12.1.13 PT Argo Pantes Tbk
- 12.1.13.1. Company Overview
- 12.1.13.2. Products
- 12.1.13.3. Company Financials
- 12.1.13.4. SWOT Analysis
- 12.1.14 Indorama Corporation (PT Indo-Rama Synthetics Tbk)**List Not Exhaustive 6 3 Other Companie
- 12.1.14.1. Company Overview
- 12.1.14.2. Products
- 12.1.14.3. Company Financials
- 12.1.14.4. SWOT Analysis
- 12.1.1 PT Ever Shine Tex Tbk
- 12.2. Market Entropy
- 12.2.1 Company's Key Areas Served
- 12.2.2 Recent Developments
- 12.3. Company Market Share Analysis 2025
- 12.3.1 Top 5 Companies Market Share Analysis
- 12.3.2 Top 3 Companies Market Share Analysis
- 12.4. List of Potential Customers
- 13. Research Methodology
List of Figures
- Figure 1: Global Textile in Indonesia Market Revenue Breakdown (Million, %) by Region 2025 & 2033
- Figure 2: Global Textile in Indonesia Market Volume Breakdown (Billion, %) by Region 2025 & 2033
- Figure 3: North America Textile in Indonesia Market Revenue (Million), by Application 2025 & 2033
- Figure 4: North America Textile in Indonesia Market Volume (Billion), by Application 2025 & 2033
- Figure 5: North America Textile in Indonesia Market Revenue Share (%), by Application 2025 & 2033
- Figure 6: North America Textile in Indonesia Market Volume Share (%), by Application 2025 & 2033
- Figure 7: North America Textile in Indonesia Market Revenue (Million), by Material 2025 & 2033
- Figure 8: North America Textile in Indonesia Market Volume (Billion), by Material 2025 & 2033
- Figure 9: North America Textile in Indonesia Market Revenue Share (%), by Material 2025 & 2033
- Figure 10: North America Textile in Indonesia Market Volume Share (%), by Material 2025 & 2033
- Figure 11: North America Textile in Indonesia Market Revenue (Million), by Process 2025 & 2033
- Figure 12: North America Textile in Indonesia Market Volume (Billion), by Process 2025 & 2033
- Figure 13: North America Textile in Indonesia Market Revenue Share (%), by Process 2025 & 2033
- Figure 14: North America Textile in Indonesia Market Volume Share (%), by Process 2025 & 2033
- Figure 15: North America Textile in Indonesia Market Revenue (Million), by Country 2025 & 2033
- Figure 16: North America Textile in Indonesia Market Volume (Billion), by Country 2025 & 2033
- Figure 17: North America Textile in Indonesia Market Revenue Share (%), by Country 2025 & 2033
- Figure 18: North America Textile in Indonesia Market Volume Share (%), by Country 2025 & 2033
- Figure 19: South America Textile in Indonesia Market Revenue (Million), by Application 2025 & 2033
- Figure 20: South America Textile in Indonesia Market Volume (Billion), by Application 2025 & 2033
- Figure 21: South America Textile in Indonesia Market Revenue Share (%), by Application 2025 & 2033
- Figure 22: South America Textile in Indonesia Market Volume Share (%), by Application 2025 & 2033
- Figure 23: South America Textile in Indonesia Market Revenue (Million), by Material 2025 & 2033
- Figure 24: South America Textile in Indonesia Market Volume (Billion), by Material 2025 & 2033
- Figure 25: South America Textile in Indonesia Market Revenue Share (%), by Material 2025 & 2033
- Figure 26: South America Textile in Indonesia Market Volume Share (%), by Material 2025 & 2033
- Figure 27: South America Textile in Indonesia Market Revenue (Million), by Process 2025 & 2033
- Figure 28: South America Textile in Indonesia Market Volume (Billion), by Process 2025 & 2033
- Figure 29: South America Textile in Indonesia Market Revenue Share (%), by Process 2025 & 2033
- Figure 30: South America Textile in Indonesia Market Volume Share (%), by Process 2025 & 2033
- Figure 31: South America Textile in Indonesia Market Revenue (Million), by Country 2025 & 2033
- Figure 32: South America Textile in Indonesia Market Volume (Billion), by Country 2025 & 2033
- Figure 33: South America Textile in Indonesia Market Revenue Share (%), by Country 2025 & 2033
- Figure 34: South America Textile in Indonesia Market Volume Share (%), by Country 2025 & 2033
- Figure 35: Europe Textile in Indonesia Market Revenue (Million), by Application 2025 & 2033
- Figure 36: Europe Textile in Indonesia Market Volume (Billion), by Application 2025 & 2033
- Figure 37: Europe Textile in Indonesia Market Revenue Share (%), by Application 2025 & 2033
- Figure 38: Europe Textile in Indonesia Market Volume Share (%), by Application 2025 & 2033
- Figure 39: Europe Textile in Indonesia Market Revenue (Million), by Material 2025 & 2033
- Figure 40: Europe Textile in Indonesia Market Volume (Billion), by Material 2025 & 2033
- Figure 41: Europe Textile in Indonesia Market Revenue Share (%), by Material 2025 & 2033
- Figure 42: Europe Textile in Indonesia Market Volume Share (%), by Material 2025 & 2033
- Figure 43: Europe Textile in Indonesia Market Revenue (Million), by Process 2025 & 2033
- Figure 44: Europe Textile in Indonesia Market Volume (Billion), by Process 2025 & 2033
- Figure 45: Europe Textile in Indonesia Market Revenue Share (%), by Process 2025 & 2033
- Figure 46: Europe Textile in Indonesia Market Volume Share (%), by Process 2025 & 2033
- Figure 47: Europe Textile in Indonesia Market Revenue (Million), by Country 2025 & 2033
- Figure 48: Europe Textile in Indonesia Market Volume (Billion), by Country 2025 & 2033
- Figure 49: Europe Textile in Indonesia Market Revenue Share (%), by Country 2025 & 2033
- Figure 50: Europe Textile in Indonesia Market Volume Share (%), by Country 2025 & 2033
- Figure 51: Middle East & Africa Textile in Indonesia Market Revenue (Million), by Application 2025 & 2033
- Figure 52: Middle East & Africa Textile in Indonesia Market Volume (Billion), by Application 2025 & 2033
- Figure 53: Middle East & Africa Textile in Indonesia Market Revenue Share (%), by Application 2025 & 2033
- Figure 54: Middle East & Africa Textile in Indonesia Market Volume Share (%), by Application 2025 & 2033
- Figure 55: Middle East & Africa Textile in Indonesia Market Revenue (Million), by Material 2025 & 2033
- Figure 56: Middle East & Africa Textile in Indonesia Market Volume (Billion), by Material 2025 & 2033
- Figure 57: Middle East & Africa Textile in Indonesia Market Revenue Share (%), by Material 2025 & 2033
- Figure 58: Middle East & Africa Textile in Indonesia Market Volume Share (%), by Material 2025 & 2033
- Figure 59: Middle East & Africa Textile in Indonesia Market Revenue (Million), by Process 2025 & 2033
- Figure 60: Middle East & Africa Textile in Indonesia Market Volume (Billion), by Process 2025 & 2033
- Figure 61: Middle East & Africa Textile in Indonesia Market Revenue Share (%), by Process 2025 & 2033
- Figure 62: Middle East & Africa Textile in Indonesia Market Volume Share (%), by Process 2025 & 2033
- Figure 63: Middle East & Africa Textile in Indonesia Market Revenue (Million), by Country 2025 & 2033
- Figure 64: Middle East & Africa Textile in Indonesia Market Volume (Billion), by Country 2025 & 2033
- Figure 65: Middle East & Africa Textile in Indonesia Market Revenue Share (%), by Country 2025 & 2033
- Figure 66: Middle East & Africa Textile in Indonesia Market Volume Share (%), by Country 2025 & 2033
- Figure 67: Asia Pacific Textile in Indonesia Market Revenue (Million), by Application 2025 & 2033
- Figure 68: Asia Pacific Textile in Indonesia Market Volume (Billion), by Application 2025 & 2033
- Figure 69: Asia Pacific Textile in Indonesia Market Revenue Share (%), by Application 2025 & 2033
- Figure 70: Asia Pacific Textile in Indonesia Market Volume Share (%), by Application 2025 & 2033
- Figure 71: Asia Pacific Textile in Indonesia Market Revenue (Million), by Material 2025 & 2033
- Figure 72: Asia Pacific Textile in Indonesia Market Volume (Billion), by Material 2025 & 2033
- Figure 73: Asia Pacific Textile in Indonesia Market Revenue Share (%), by Material 2025 & 2033
- Figure 74: Asia Pacific Textile in Indonesia Market Volume Share (%), by Material 2025 & 2033
- Figure 75: Asia Pacific Textile in Indonesia Market Revenue (Million), by Process 2025 & 2033
- Figure 76: Asia Pacific Textile in Indonesia Market Volume (Billion), by Process 2025 & 2033
- Figure 77: Asia Pacific Textile in Indonesia Market Revenue Share (%), by Process 2025 & 2033
- Figure 78: Asia Pacific Textile in Indonesia Market Volume Share (%), by Process 2025 & 2033
- Figure 79: Asia Pacific Textile in Indonesia Market Revenue (Million), by Country 2025 & 2033
- Figure 80: Asia Pacific Textile in Indonesia Market Volume (Billion), by Country 2025 & 2033
- Figure 81: Asia Pacific Textile in Indonesia Market Revenue Share (%), by Country 2025 & 2033
- Figure 82: Asia Pacific Textile in Indonesia Market Volume Share (%), by Country 2025 & 2033
List of Tables
- Table 1: Global Textile in Indonesia Market Revenue Million Forecast, by Application 2020 & 2033
- Table 2: Global Textile in Indonesia Market Volume Billion Forecast, by Application 2020 & 2033
- Table 3: Global Textile in Indonesia Market Revenue Million Forecast, by Material 2020 & 2033
- Table 4: Global Textile in Indonesia Market Volume Billion Forecast, by Material 2020 & 2033
- Table 5: Global Textile in Indonesia Market Revenue Million Forecast, by Process 2020 & 2033
- Table 6: Global Textile in Indonesia Market Volume Billion Forecast, by Process 2020 & 2033
- Table 7: Global Textile in Indonesia Market Revenue Million Forecast, by Region 2020 & 2033
- Table 8: Global Textile in Indonesia Market Volume Billion Forecast, by Region 2020 & 2033
- Table 9: Global Textile in Indonesia Market Revenue Million Forecast, by Application 2020 & 2033
- Table 10: Global Textile in Indonesia Market Volume Billion Forecast, by Application 2020 & 2033
- Table 11: Global Textile in Indonesia Market Revenue Million Forecast, by Material 2020 & 2033
- Table 12: Global Textile in Indonesia Market Volume Billion Forecast, by Material 2020 & 2033
- Table 13: Global Textile in Indonesia Market Revenue Million Forecast, by Process 2020 & 2033
- Table 14: Global Textile in Indonesia Market Volume Billion Forecast, by Process 2020 & 2033
- Table 15: Global Textile in Indonesia Market Revenue Million Forecast, by Country 2020 & 2033
- Table 16: Global Textile in Indonesia Market Volume Billion Forecast, by Country 2020 & 2033
- Table 17: United States Textile in Indonesia Market Revenue (Million) Forecast, by Application 2020 & 2033
- Table 18: United States Textile in Indonesia Market Volume (Billion) Forecast, by Application 2020 & 2033
- Table 19: Canada Textile in Indonesia Market Revenue (Million) Forecast, by Application 2020 & 2033
- Table 20: Canada Textile in Indonesia Market Volume (Billion) Forecast, by Application 2020 & 2033
- Table 21: Mexico Textile in Indonesia Market Revenue (Million) Forecast, by Application 2020 & 2033
- Table 22: Mexico Textile in Indonesia Market Volume (Billion) Forecast, by Application 2020 & 2033
- Table 23: Global Textile in Indonesia Market Revenue Million Forecast, by Application 2020 & 2033
- Table 24: Global Textile in Indonesia Market Volume Billion Forecast, by Application 2020 & 2033
- Table 25: Global Textile in Indonesia Market Revenue Million Forecast, by Material 2020 & 2033
- Table 26: Global Textile in Indonesia Market Volume Billion Forecast, by Material 2020 & 2033
- Table 27: Global Textile in Indonesia Market Revenue Million Forecast, by Process 2020 & 2033
- Table 28: Global Textile in Indonesia Market Volume Billion Forecast, by Process 2020 & 2033
- Table 29: Global Textile in Indonesia Market Revenue Million Forecast, by Country 2020 & 2033
- Table 30: Global Textile in Indonesia Market Volume Billion Forecast, by Country 2020 & 2033
- Table 31: Brazil Textile in Indonesia Market Revenue (Million) Forecast, by Application 2020 & 2033
- Table 32: Brazil Textile in Indonesia Market Volume (Billion) Forecast, by Application 2020 & 2033
- Table 33: Argentina Textile in Indonesia Market Revenue (Million) Forecast, by Application 2020 & 2033
- Table 34: Argentina Textile in Indonesia Market Volume (Billion) Forecast, by Application 2020 & 2033
- Table 35: Rest of South America Textile in Indonesia Market Revenue (Million) Forecast, by Application 2020 & 2033
- Table 36: Rest of South America Textile in Indonesia Market Volume (Billion) Forecast, by Application 2020 & 2033
- Table 37: Global Textile in Indonesia Market Revenue Million Forecast, by Application 2020 & 2033
- Table 38: Global Textile in Indonesia Market Volume Billion Forecast, by Application 2020 & 2033
- Table 39: Global Textile in Indonesia Market Revenue Million Forecast, by Material 2020 & 2033
- Table 40: Global Textile in Indonesia Market Volume Billion Forecast, by Material 2020 & 2033
- Table 41: Global Textile in Indonesia Market Revenue Million Forecast, by Process 2020 & 2033
- Table 42: Global Textile in Indonesia Market Volume Billion Forecast, by Process 2020 & 2033
- Table 43: Global Textile in Indonesia Market Revenue Million Forecast, by Country 2020 & 2033
- Table 44: Global Textile in Indonesia Market Volume Billion Forecast, by Country 2020 & 2033
- Table 45: United Kingdom Textile in Indonesia Market Revenue (Million) Forecast, by Application 2020 & 2033
- Table 46: United Kingdom Textile in Indonesia Market Volume (Billion) Forecast, by Application 2020 & 2033
- Table 47: Germany Textile in Indonesia Market Revenue (Million) Forecast, by Application 2020 & 2033
- Table 48: Germany Textile in Indonesia Market Volume (Billion) Forecast, by Application 2020 & 2033
- Table 49: France Textile in Indonesia Market Revenue (Million) Forecast, by Application 2020 & 2033
- Table 50: France Textile in Indonesia Market Volume (Billion) Forecast, by Application 2020 & 2033
- Table 51: Italy Textile in Indonesia Market Revenue (Million) Forecast, by Application 2020 & 2033
- Table 52: Italy Textile in Indonesia Market Volume (Billion) Forecast, by Application 2020 & 2033
- Table 53: Spain Textile in Indonesia Market Revenue (Million) Forecast, by Application 2020 & 2033
- Table 54: Spain Textile in Indonesia Market Volume (Billion) Forecast, by Application 2020 & 2033
- Table 55: Russia Textile in Indonesia Market Revenue (Million) Forecast, by Application 2020 & 2033
- Table 56: Russia Textile in Indonesia Market Volume (Billion) Forecast, by Application 2020 & 2033
- Table 57: Benelux Textile in Indonesia Market Revenue (Million) Forecast, by Application 2020 & 2033
- Table 58: Benelux Textile in Indonesia Market Volume (Billion) Forecast, by Application 2020 & 2033
- Table 59: Nordics Textile in Indonesia Market Revenue (Million) Forecast, by Application 2020 & 2033
- Table 60: Nordics Textile in Indonesia Market Volume (Billion) Forecast, by Application 2020 & 2033
- Table 61: Rest of Europe Textile in Indonesia Market Revenue (Million) Forecast, by Application 2020 & 2033
- Table 62: Rest of Europe Textile in Indonesia Market Volume (Billion) Forecast, by Application 2020 & 2033
- Table 63: Global Textile in Indonesia Market Revenue Million Forecast, by Application 2020 & 2033
- Table 64: Global Textile in Indonesia Market Volume Billion Forecast, by Application 2020 & 2033
- Table 65: Global Textile in Indonesia Market Revenue Million Forecast, by Material 2020 & 2033
- Table 66: Global Textile in Indonesia Market Volume Billion Forecast, by Material 2020 & 2033
- Table 67: Global Textile in Indonesia Market Revenue Million Forecast, by Process 2020 & 2033
- Table 68: Global Textile in Indonesia Market Volume Billion Forecast, by Process 2020 & 2033
- Table 69: Global Textile in Indonesia Market Revenue Million Forecast, by Country 2020 & 2033
- Table 70: Global Textile in Indonesia Market Volume Billion Forecast, by Country 2020 & 2033
- Table 71: Turkey Textile in Indonesia Market Revenue (Million) Forecast, by Application 2020 & 2033
- Table 72: Turkey Textile in Indonesia Market Volume (Billion) Forecast, by Application 2020 & 2033
- Table 73: Israel Textile in Indonesia Market Revenue (Million) Forecast, by Application 2020 & 2033
- Table 74: Israel Textile in Indonesia Market Volume (Billion) Forecast, by Application 2020 & 2033
- Table 75: GCC Textile in Indonesia Market Revenue (Million) Forecast, by Application 2020 & 2033
- Table 76: GCC Textile in Indonesia Market Volume (Billion) Forecast, by Application 2020 & 2033
- Table 77: North Africa Textile in Indonesia Market Revenue (Million) Forecast, by Application 2020 & 2033
- Table 78: North Africa Textile in Indonesia Market Volume (Billion) Forecast, by Application 2020 & 2033
- Table 79: South Africa Textile in Indonesia Market Revenue (Million) Forecast, by Application 2020 & 2033
- Table 80: South Africa Textile in Indonesia Market Volume (Billion) Forecast, by Application 2020 & 2033
- Table 81: Rest of Middle East & Africa Textile in Indonesia Market Revenue (Million) Forecast, by Application 2020 & 2033
- Table 82: Rest of Middle East & Africa Textile in Indonesia Market Volume (Billion) Forecast, by Application 2020 & 2033
- Table 83: Global Textile in Indonesia Market Revenue Million Forecast, by Application 2020 & 2033
- Table 84: Global Textile in Indonesia Market Volume Billion Forecast, by Application 2020 & 2033
- Table 85: Global Textile in Indonesia Market Revenue Million Forecast, by Material 2020 & 2033
- Table 86: Global Textile in Indonesia Market Volume Billion Forecast, by Material 2020 & 2033
- Table 87: Global Textile in Indonesia Market Revenue Million Forecast, by Process 2020 & 2033
- Table 88: Global Textile in Indonesia Market Volume Billion Forecast, by Process 2020 & 2033
- Table 89: Global Textile in Indonesia Market Revenue Million Forecast, by Country 2020 & 2033
- Table 90: Global Textile in Indonesia Market Volume Billion Forecast, by Country 2020 & 2033
- Table 91: China Textile in Indonesia Market Revenue (Million) Forecast, by Application 2020 & 2033
- Table 92: China Textile in Indonesia Market Volume (Billion) Forecast, by Application 2020 & 2033
- Table 93: India Textile in Indonesia Market Revenue (Million) Forecast, by Application 2020 & 2033
- Table 94: India Textile in Indonesia Market Volume (Billion) Forecast, by Application 2020 & 2033
- Table 95: Japan Textile in Indonesia Market Revenue (Million) Forecast, by Application 2020 & 2033
- Table 96: Japan Textile in Indonesia Market Volume (Billion) Forecast, by Application 2020 & 2033
- Table 97: South Korea Textile in Indonesia Market Revenue (Million) Forecast, by Application 2020 & 2033
- Table 98: South Korea Textile in Indonesia Market Volume (Billion) Forecast, by Application 2020 & 2033
- Table 99: ASEAN Textile in Indonesia Market Revenue (Million) Forecast, by Application 2020 & 2033
- Table 100: ASEAN Textile in Indonesia Market Volume (Billion) Forecast, by Application 2020 & 2033
- Table 101: Oceania Textile in Indonesia Market Revenue (Million) Forecast, by Application 2020 & 2033
- Table 102: Oceania Textile in Indonesia Market Volume (Billion) Forecast, by Application 2020 & 2033
- Table 103: Rest of Asia Pacific Textile in Indonesia Market Revenue (Million) Forecast, by Application 2020 & 2033
- Table 104: Rest of Asia Pacific Textile in Indonesia Market Volume (Billion) Forecast, by Application 2020 & 2033
Frequently Asked Questions
1. What is the projected Compound Annual Growth Rate (CAGR) of the Textile in Indonesia Market?
The projected CAGR is approximately > 5.54%.
2. Which companies are prominent players in the Textile in Indonesia Market?
Key companies in the market include PT Ever Shine Tex Tbk, PT Trisula Textile Industries Tbk, PT Century Textile Industry Tbk (Toray Industries Inc ), PT Pan Brothers Tbk, PT Polychem Indonesia Tbk, PT Sri Rejeki Isman Tbk, PT Indo Kordsa Tbk, PT Tifico Fiber Indonesia Tbk, PT Panasia Group, PT Asia Pacific Fibers Tbk, PT Tyfountex Indonesia, PT Eratex Djaja Tbk, PT Argo Pantes Tbk, Indorama Corporation (PT Indo-Rama Synthetics Tbk)**List Not Exhaustive 6 3 Other Companie.
3. What are the main segments of the Textile in Indonesia Market?
The market segments include Application, Material, Process.
4. Can you provide details about the market size?
The market size is estimated to be USD 13.83 Million as of 2022.
5. What are some drivers contributing to market growth?
4.; Growing domestic market4.; Government support driving the market.
6. What are the notable trends driving market growth?
Indonesian Cotton Imports Set to Rise in 2024.
7. Are there any restraints impacting market growth?
4.; Growing domestic market4.; Government support driving the market.
8. Can you provide examples of recent developments in the market?
November 2023: WHP Global, a leading brand management firm, has inked significant licensing agreements to expand the reach of the iconic EXPRESS brand. The deals include partnerships with PT MAP in Indonesia, Kemsa in Paraguay, and a strategic collaboration with IB Group in Mexico, further solidifying the brand's foothold in these markets.
9. What pricing options are available for accessing the report?
Pricing options include single-user, multi-user, and enterprise licenses priced at USD 3800, USD 4500, and USD 5800 respectively.
10. Is the market size provided in terms of value or volume?
The market size is provided in terms of value, measured in Million and volume, measured in Billion.
11. Are there any specific market keywords associated with the report?
Yes, the market keyword associated with the report is "Textile in Indonesia Market," which aids in identifying and referencing the specific market segment covered.
12. How do I determine which pricing option suits my needs best?
The pricing options vary based on user requirements and access needs. Individual users may opt for single-user licenses, while businesses requiring broader access may choose multi-user or enterprise licenses for cost-effective access to the report.
13. Are there any additional resources or data provided in the Textile in Indonesia Market report?
While the report offers comprehensive insights, it's advisable to review the specific contents or supplementary materials provided to ascertain if additional resources or data are available.
14. How can I stay updated on further developments or reports in the Textile in Indonesia Market?
To stay informed about further developments, trends, and reports in the Textile in Indonesia Market, consider subscribing to industry newsletters, following relevant companies and organizations, or regularly checking reputable industry news sources and publications.
Methodology
Step 1 - Identification of Relevant Samples Size from Population Database


Step 2 - Approaches for Defining Global Market Size (Value, Volume* & Price*)

Note*: In applicable scenarios
Step 3 - Data Sources
Primary Research
- Web Analytics
- Survey Reports
- Research Institute
- Latest Research Reports
- Opinion Leaders
Secondary Research
- Annual Reports
- White Paper
- Latest Press Release
- Industry Association
- Paid Database
- Investor Presentations

Step 4 - Data Triangulation
Involves using different sources of information in order to increase the validity of a study
These sources are likely to be stakeholders in a program - participants, other researchers, program staff, other community members, and so on.
Then we put all data in single framework & apply various statistical tools to find out the dynamic on the market.
During the analysis stage, feedback from the stakeholder groups would be compared to determine areas of agreement as well as areas of divergence