
Key Insights
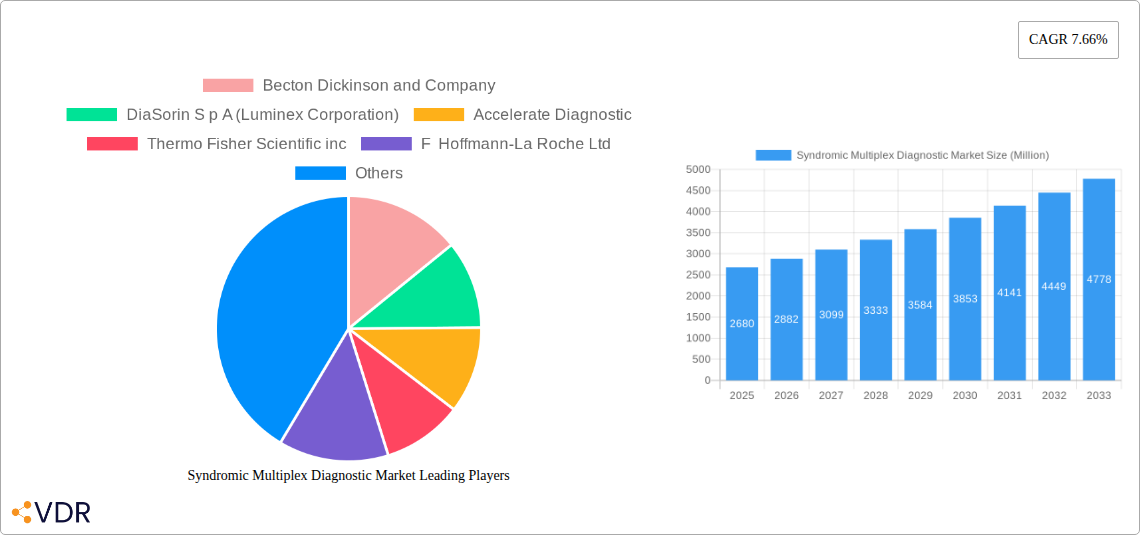
The Syndromic Multiplex Diagnostic Market, valued at $2.68 billion in 2025, is projected to experience robust growth, exhibiting a compound annual growth rate (CAGR) of 7.66% from 2025 to 2033. This expansion is driven by several key factors. The rising prevalence of infectious diseases, coupled with the increasing demand for rapid and accurate diagnostics, fuels market growth. Advances in multiplex technology, enabling simultaneous detection of multiple pathogens within a single test, significantly improve efficiency and reduce diagnostic turnaround times. Furthermore, the growing adoption of point-of-care diagnostics and the increasing integration of syndromic testing into healthcare workflows contribute to market expansion. Hospitals and diagnostic laboratories represent the largest end-user segments, reflecting the crucial role of rapid and accurate syndromic diagnostics in patient care and infection control. Respiratory and gastrointestinal syndromes currently dominate the market share by syndrome type, reflecting their high prevalence globally. However, increasing focus on sexually transmitted diseases (STDs) and urinary tract infections (cUTIs) is projected to boost the growth of the "Other Types of Syndromes" segment in the coming years. Technological advancements, such as improved assay performance and the integration of artificial intelligence (AI) for data analysis, are expected to further propel market expansion.
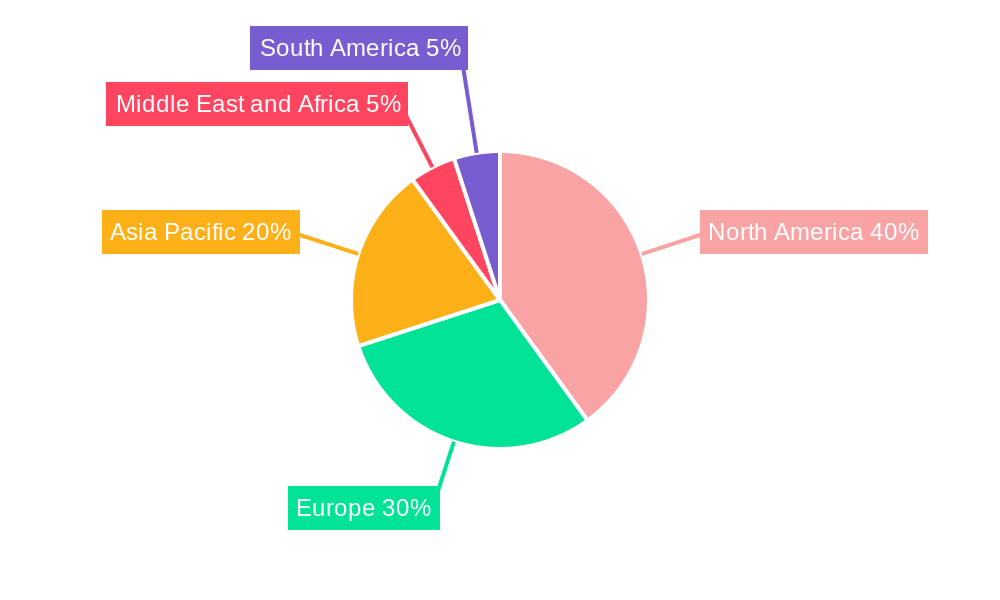
Competition within the syndromic multiplex diagnostic market is intense, with key players such as Becton Dickinson, DiaSorin, Thermo Fisher Scientific, Roche, and Abbott Laboratories vying for market share through continuous innovation and strategic partnerships. The geographic distribution of market share reflects varying healthcare infrastructure and disease prevalence across regions. North America and Europe currently hold significant market shares due to advanced healthcare infrastructure and high adoption rates. However, the Asia-Pacific region is anticipated to witness substantial growth, driven by increasing healthcare investments and rising infectious disease incidence. The market's future trajectory will likely be influenced by factors such as regulatory approvals for new diagnostic technologies, the adoption of new reimbursement models, and ongoing efforts to improve disease surveillance and control.
Syndromic Multiplex Diagnostic Market: A Comprehensive Report (2019-2033)
This comprehensive report provides an in-depth analysis of the Syndromic Multiplex Diagnostic market, encompassing market dynamics, growth trends, regional dominance, product landscape, key players, and future outlook. The report covers the parent market of In Vitro Diagnostics and the child market of Molecular Diagnostics, offering a granular view of this rapidly evolving sector. The study period spans from 2019 to 2033, with 2025 serving as the base and estimated year. The market size is presented in million units.
Syndromic Multiplex Diagnostic Market Dynamics & Structure
The Syndromic Multiplex Diagnostic market is characterized by moderate concentration, with key players like Becton Dickinson and Company, Thermo Fisher Scientific Inc., and Abbott Laboratories holding significant market share (xx%). Technological innovation, particularly in multiplex PCR and next-generation sequencing (NGS), is a major driver, enabling faster and more accurate diagnoses. Stringent regulatory frameworks (e.g., FDA approvals in the US and CE marking in Europe) influence market access and product development. Competitive pressures from alternative diagnostic methods and the emergence of point-of-care diagnostics present challenges. End-user demographics, primarily hospitals and diagnostic laboratories, are expanding, fueled by increasing prevalence of infectious diseases and rising healthcare expenditure. M&A activity has been moderate (xx deals in the past 5 years), with larger players acquiring smaller companies to expand their product portfolios and market reach.
- Market Concentration: Moderately concentrated, with top 5 players holding xx% market share.
- Technological Innovation: Multiplex PCR, NGS, and microfluidics are key drivers.
- Regulatory Landscape: Stringent regulatory approvals influence market entry and product development.
- Competitive Substitutes: Traditional diagnostic methods and point-of-care diagnostics pose competition.
- End-User Demographics: Hospitals and diagnostic laboratories represent the primary end-users.
- M&A Activity: Moderate level of mergers and acquisitions to expand market presence.
Syndromic Multiplex Diagnostic Market Growth Trends & Insights
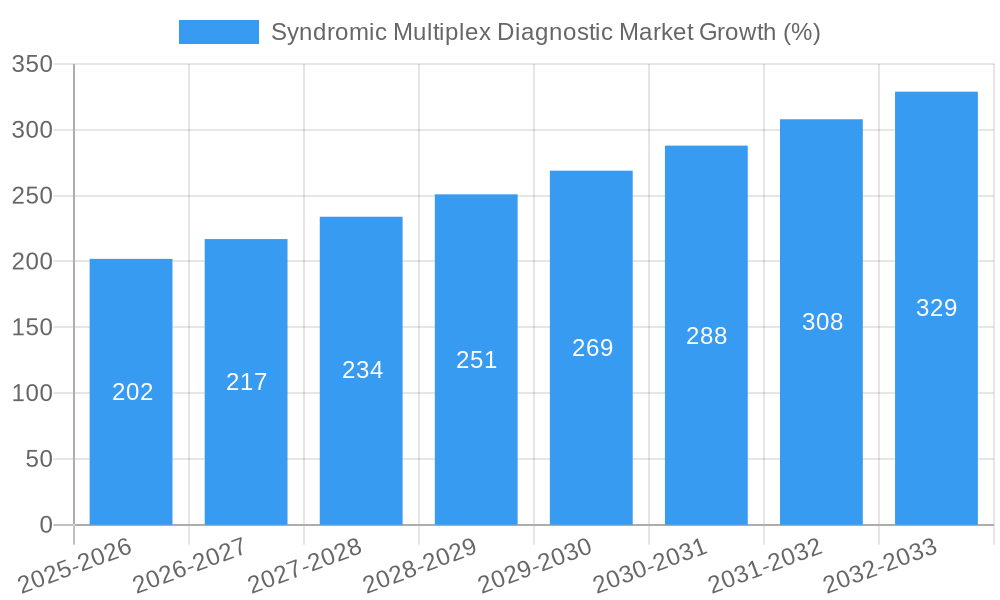
The Syndromic Multiplex Diagnostic market exhibited a CAGR of xx% during the historical period (2019-2024), driven by increasing demand for rapid and accurate diagnosis of infectious diseases. The market is expected to grow at a CAGR of xx% during the forecast period (2025-2033), reaching xx million units by 2033. This growth is fueled by technological advancements leading to improved sensitivity and specificity, rising prevalence of infectious diseases, increasing healthcare expenditure, and growing adoption of multiplex testing in clinical settings. Market penetration is expected to increase from xx% in 2025 to xx% by 2033, driven by expanding awareness and acceptance of multiplex diagnostic techniques among healthcare professionals. Consumer behavior shifts toward personalized medicine and a preference for rapid diagnostic solutions further contribute to market expansion.
Dominant Regions, Countries, or Segments in Syndromic Multiplex Diagnostic Market
North America (specifically the United States) currently holds the largest market share (xx%) due to high healthcare spending, advanced healthcare infrastructure, and a strong presence of major diagnostic companies. Europe follows as a significant market, driven by increasing adoption of advanced diagnostic technologies and supportive regulatory frameworks. Within the end-user segment, hospitals dominate the market (xx%), followed by diagnostic laboratories (xx%). The respiratory syndrome segment holds the largest share (xx%) owing to the high prevalence of respiratory infections.
Key Regional Drivers:
- North America: High healthcare expenditure, advanced infrastructure.
- Europe: Growing adoption of advanced technologies, supportive regulatory environment.
- Asia-Pacific: Rising healthcare awareness, increasing prevalence of infectious diseases.
Key Segment Drivers:
- Hospitals: High testing volumes, advanced infrastructure.
- Respiratory Syndromes: High prevalence of respiratory infections, efficient diagnosis methods.
Syndromic Multiplex Diagnostic Market Product Landscape
The market offers a diverse range of products, including multiplex PCR assays, microarrays, and NGS-based platforms. These products are designed to detect multiple pathogens simultaneously, offering rapid and efficient diagnosis. Key advancements include improved sensitivity, reduced turnaround time, and integration with laboratory information systems (LIS). Unique selling propositions often center on ease of use, high throughput capacity, and cost-effectiveness.
Key Drivers, Barriers & Challenges in Syndromic Multiplex Diagnostic Market
Key Drivers:
- Increasing prevalence of infectious diseases.
- Growing demand for rapid and accurate diagnostics.
- Technological advancements in multiplex testing.
- Rising healthcare expenditure and investment in healthcare infrastructure.
Key Challenges:
- High cost of equipment and assays.
- Complex regulatory approval processes.
- Need for skilled personnel to operate the systems.
- Competition from other diagnostic techniques. The high initial investment for the equipment and reagents also presents a barrier for smaller clinics and laboratories.
Emerging Opportunities in Syndromic Multiplex Diagnostic Market
Untapped markets in developing countries present significant growth opportunities. The development of point-of-care diagnostics and user-friendly platforms could revolutionize diagnostics in resource-limited settings. Furthermore, expanding applications in personalized medicine, antimicrobial resistance surveillance, and biothreat detection are set to drive innovation and growth.
Growth Accelerators in the Syndromic Multiplex Diagnostic Market Industry
Strategic partnerships between diagnostic companies and healthcare providers are accelerating market penetration. Technological breakthroughs, such as the development of more sensitive and specific assays, are improving diagnostic accuracy. Expansion into emerging markets and the development of novel diagnostic platforms for specific infectious diseases further contribute to accelerating market growth.
Key Players Shaping the Syndromic Multiplex Diagnostic Market Market
- Becton Dickinson and Company
- DiaSorin S.p.A (Luminex Corporation)
- Accelerate Diagnostic
- Thermo Fisher Scientific Inc.
- F. Hoffmann-La Roche Ltd
- Hologic Inc.
- Abbott Laboratories
- Qiagen
- Accelerate Diagnostics Inc
- Akonni Biosystems
- Applied BioCode
- Abacus Diagnostica Oy
- bioMérieux
Notable Milestones in Syndromic Multiplex Diagnostic Market Sector
- March 2022: Applied BioCode signed a distribution agreement with Hardy Diagnostics for the MDx-3000 System, expanding market access for respiratory and gastrointestinal infection diagnostics.
- January 2022: Seegene Inc. received Health Canada approval for its Allplex SARS-CoV-2 FluA/FluB/RSV Assay, enabling simultaneous detection of multiple respiratory viruses.
In-Depth Syndromic Multiplex Diagnostic Market Outlook
The Syndromic Multiplex Diagnostic market is poised for significant growth driven by technological innovation, increasing demand for rapid diagnostics, and expanding healthcare infrastructure. Strategic partnerships, market expansion into emerging economies, and the development of point-of-care diagnostics will shape the future of the market, offering lucrative opportunities for players to capitalize on this high-growth sector. The market's long-term potential hinges on continued innovation and the successful navigation of regulatory hurdles.
Syndromic Multiplex Diagnostic Market Segmentation
-
1. Type of Syndrome
- 1.1. Respiratory
- 1.2. Gastrointestinal
- 1.3. Central Nervous System
- 1.4. Other Types of Syndromes (cUTI and STDs)
-
2. End-User
- 2.1. Hospitals
- 2.2. Diagnostics Laboratories
- 2.3. Other End Users
Syndromic Multiplex Diagnostic Market Segmentation By Geography
-
1. North America
- 1.1. United States
- 1.2. Canada
- 1.3. Mexico
-
2. Europe
- 2.1. Germany
- 2.2. United Kingdom
- 2.3. France
- 2.4. Italy
- 2.5. Spain
- 2.6. Rest of Europe
-
3. Asia Pacific
- 3.1. China
- 3.2. Japan
- 3.3. India
- 3.4. Australia
- 3.5. South Korea
- 3.6. Rest of Asia Pacific
-
4. Middle East and Africa
- 4.1. GCC
- 4.2. South Africa
- 4.3. Rest of Middle East and Africa
-
5. South America
- 5.1. Brazil
- 5.2. Argentina
- 5.3. Rest of South America
Syndromic Multiplex Diagnostic Market REPORT HIGHLIGHTS
| Aspects | Details |
|---|---|
| Study Period | 2019-2033 |
| Base Year | 2024 |
| Estimated Year | 2025 |
| Forecast Period | 2025-2033 |
| Historical Period | 2019-2024 |
| Growth Rate | CAGR of 7.66% from 2019-2033 |
| Segmentation |
|
Table of Contents
- 1. Introduction
- 1.1. Research Scope
- 1.2. Market Segmentation
- 1.3. Research Methodology
- 1.4. Definitions and Assumptions
- 2. Executive Summary
- 2.1. Introduction
- 3. Market Dynamics
- 3.1. Introduction
- 3.2. Market Drivers
- 3.2.1. Increasing Demand for Accurate and Rapid Results; Quick Access to the Treatment
- 3.3. Market Restrains
- 3.3.1. Lack of Skilled Professional; Inability in Detecting Asymptomatic Cases
- 3.4. Market Trends
- 3.4.1. Gastrointestinal Segment is Expected to Hold a Significant Share in the Market Over the Forecast Period
- 4. Market Factor Analysis
- 4.1. Porters Five Forces
- 4.2. Supply/Value Chain
- 4.3. PESTEL analysis
- 4.4. Market Entropy
- 4.5. Patent/Trademark Analysis
- 5. Global Syndromic Multiplex Diagnostic Market Analysis, Insights and Forecast, 2019-2031
- 5.1. Market Analysis, Insights and Forecast - by Type of Syndrome
- 5.1.1. Respiratory
- 5.1.2. Gastrointestinal
- 5.1.3. Central Nervous System
- 5.1.4. Other Types of Syndromes (cUTI and STDs)
- 5.2. Market Analysis, Insights and Forecast - by End-User
- 5.2.1. Hospitals
- 5.2.2. Diagnostics Laboratories
- 5.2.3. Other End Users
- 5.3. Market Analysis, Insights and Forecast - by Region
- 5.3.1. North America
- 5.3.2. Europe
- 5.3.3. Asia Pacific
- 5.3.4. Middle East and Africa
- 5.3.5. South America
- 5.1. Market Analysis, Insights and Forecast - by Type of Syndrome
- 6. North America Syndromic Multiplex Diagnostic Market Analysis, Insights and Forecast, 2019-2031
- 6.1. Market Analysis, Insights and Forecast - by Type of Syndrome
- 6.1.1. Respiratory
- 6.1.2. Gastrointestinal
- 6.1.3. Central Nervous System
- 6.1.4. Other Types of Syndromes (cUTI and STDs)
- 6.2. Market Analysis, Insights and Forecast - by End-User
- 6.2.1. Hospitals
- 6.2.2. Diagnostics Laboratories
- 6.2.3. Other End Users
- 6.1. Market Analysis, Insights and Forecast - by Type of Syndrome
- 7. Europe Syndromic Multiplex Diagnostic Market Analysis, Insights and Forecast, 2019-2031
- 7.1. Market Analysis, Insights and Forecast - by Type of Syndrome
- 7.1.1. Respiratory
- 7.1.2. Gastrointestinal
- 7.1.3. Central Nervous System
- 7.1.4. Other Types of Syndromes (cUTI and STDs)
- 7.2. Market Analysis, Insights and Forecast - by End-User
- 7.2.1. Hospitals
- 7.2.2. Diagnostics Laboratories
- 7.2.3. Other End Users
- 7.1. Market Analysis, Insights and Forecast - by Type of Syndrome
- 8. Asia Pacific Syndromic Multiplex Diagnostic Market Analysis, Insights and Forecast, 2019-2031
- 8.1. Market Analysis, Insights and Forecast - by Type of Syndrome
- 8.1.1. Respiratory
- 8.1.2. Gastrointestinal
- 8.1.3. Central Nervous System
- 8.1.4. Other Types of Syndromes (cUTI and STDs)
- 8.2. Market Analysis, Insights and Forecast - by End-User
- 8.2.1. Hospitals
- 8.2.2. Diagnostics Laboratories
- 8.2.3. Other End Users
- 8.1. Market Analysis, Insights and Forecast - by Type of Syndrome
- 9. Middle East and Africa Syndromic Multiplex Diagnostic Market Analysis, Insights and Forecast, 2019-2031
- 9.1. Market Analysis, Insights and Forecast - by Type of Syndrome
- 9.1.1. Respiratory
- 9.1.2. Gastrointestinal
- 9.1.3. Central Nervous System
- 9.1.4. Other Types of Syndromes (cUTI and STDs)
- 9.2. Market Analysis, Insights and Forecast - by End-User
- 9.2.1. Hospitals
- 9.2.2. Diagnostics Laboratories
- 9.2.3. Other End Users
- 9.1. Market Analysis, Insights and Forecast - by Type of Syndrome
- 10. South America Syndromic Multiplex Diagnostic Market Analysis, Insights and Forecast, 2019-2031
- 10.1. Market Analysis, Insights and Forecast - by Type of Syndrome
- 10.1.1. Respiratory
- 10.1.2. Gastrointestinal
- 10.1.3. Central Nervous System
- 10.1.4. Other Types of Syndromes (cUTI and STDs)
- 10.2. Market Analysis, Insights and Forecast - by End-User
- 10.2.1. Hospitals
- 10.2.2. Diagnostics Laboratories
- 10.2.3. Other End Users
- 10.1. Market Analysis, Insights and Forecast - by Type of Syndrome
- 11. North America Syndromic Multiplex Diagnostic Market Analysis, Insights and Forecast, 2019-2031
- 11.1. Market Analysis, Insights and Forecast - By Country/Sub-region
- 11.1.1 United States
- 11.1.2 Canada
- 11.1.3 Mexico
- 12. Europe Syndromic Multiplex Diagnostic Market Analysis, Insights and Forecast, 2019-2031
- 12.1. Market Analysis, Insights and Forecast - By Country/Sub-region
- 12.1.1 Germany
- 12.1.2 United Kingdom
- 12.1.3 France
- 12.1.4 Italy
- 12.1.5 Spain
- 12.1.6 Rest of Europe
- 13. Asia Pacific Syndromic Multiplex Diagnostic Market Analysis, Insights and Forecast, 2019-2031
- 13.1. Market Analysis, Insights and Forecast - By Country/Sub-region
- 13.1.1 China
- 13.1.2 Japan
- 13.1.3 India
- 13.1.4 Australia
- 13.1.5 South Korea
- 13.1.6 Rest of Asia Pacific
- 14. Middle East and Africa Syndromic Multiplex Diagnostic Market Analysis, Insights and Forecast, 2019-2031
- 14.1. Market Analysis, Insights and Forecast - By Country/Sub-region
- 14.1.1 GCC
- 14.1.2 South Africa
- 14.1.3 Rest of Middle East and Africa
- 15. South America Syndromic Multiplex Diagnostic Market Analysis, Insights and Forecast, 2019-2031
- 15.1. Market Analysis, Insights and Forecast - By Country/Sub-region
- 15.1.1 Brazil
- 15.1.2 Argentina
- 15.1.3 Rest of South America
- 16. Competitive Analysis
- 16.1. Global Market Share Analysis 2024
- 16.2. Company Profiles
- 16.2.1 Becton Dickinson and Company
- 16.2.1.1. Overview
- 16.2.1.2. Products
- 16.2.1.3. SWOT Analysis
- 16.2.1.4. Recent Developments
- 16.2.1.5. Financials (Based on Availability)
- 16.2.2 DiaSorin S p A (Luminex Corporation)
- 16.2.2.1. Overview
- 16.2.2.2. Products
- 16.2.2.3. SWOT Analysis
- 16.2.2.4. Recent Developments
- 16.2.2.5. Financials (Based on Availability)
- 16.2.3 Accelerate Diagnostic
- 16.2.3.1. Overview
- 16.2.3.2. Products
- 16.2.3.3. SWOT Analysis
- 16.2.3.4. Recent Developments
- 16.2.3.5. Financials (Based on Availability)
- 16.2.4 Thermo Fisher Scientific inc
- 16.2.4.1. Overview
- 16.2.4.2. Products
- 16.2.4.3. SWOT Analysis
- 16.2.4.4. Recent Developments
- 16.2.4.5. Financials (Based on Availability)
- 16.2.5 F Hoffmann-La Roche Ltd
- 16.2.5.1. Overview
- 16.2.5.2. Products
- 16.2.5.3. SWOT Analysis
- 16.2.5.4. Recent Developments
- 16.2.5.5. Financials (Based on Availability)
- 16.2.6 Hologic Inc
- 16.2.6.1. Overview
- 16.2.6.2. Products
- 16.2.6.3. SWOT Analysis
- 16.2.6.4. Recent Developments
- 16.2.6.5. Financials (Based on Availability)
- 16.2.7 Abbott Laboratories
- 16.2.7.1. Overview
- 16.2.7.2. Products
- 16.2.7.3. SWOT Analysis
- 16.2.7.4. Recent Developments
- 16.2.7.5. Financials (Based on Availability)
- 16.2.8 Qiagen
- 16.2.8.1. Overview
- 16.2.8.2. Products
- 16.2.8.3. SWOT Analysis
- 16.2.8.4. Recent Developments
- 16.2.8.5. Financials (Based on Availability)
- 16.2.9 Accelerate Diagnostics Inc
- 16.2.9.1. Overview
- 16.2.9.2. Products
- 16.2.9.3. SWOT Analysis
- 16.2.9.4. Recent Developments
- 16.2.9.5. Financials (Based on Availability)
- 16.2.10 Akonni Biosystems
- 16.2.10.1. Overview
- 16.2.10.2. Products
- 16.2.10.3. SWOT Analysis
- 16.2.10.4. Recent Developments
- 16.2.10.5. Financials (Based on Availability)
- 16.2.11 Applied BioCode
- 16.2.11.1. Overview
- 16.2.11.2. Products
- 16.2.11.3. SWOT Analysis
- 16.2.11.4. Recent Developments
- 16.2.11.5. Financials (Based on Availability)
- 16.2.12 Abacus Diagnostica Oy
- 16.2.12.1. Overview
- 16.2.12.2. Products
- 16.2.12.3. SWOT Analysis
- 16.2.12.4. Recent Developments
- 16.2.12.5. Financials (Based on Availability)
- 16.2.13 bioMerieux
- 16.2.13.1. Overview
- 16.2.13.2. Products
- 16.2.13.3. SWOT Analysis
- 16.2.13.4. Recent Developments
- 16.2.13.5. Financials (Based on Availability)
- 16.2.1 Becton Dickinson and Company
List of Figures
- Figure 1: Global Syndromic Multiplex Diagnostic Market Revenue Breakdown (Million, %) by Region 2024 & 2032
- Figure 2: Global Syndromic Multiplex Diagnostic Market Volume Breakdown (K Unit, %) by Region 2024 & 2032
- Figure 3: North America Syndromic Multiplex Diagnostic Market Revenue (Million), by Country 2024 & 2032
- Figure 4: North America Syndromic Multiplex Diagnostic Market Volume (K Unit), by Country 2024 & 2032
- Figure 5: North America Syndromic Multiplex Diagnostic Market Revenue Share (%), by Country 2024 & 2032
- Figure 6: North America Syndromic Multiplex Diagnostic Market Volume Share (%), by Country 2024 & 2032
- Figure 7: Europe Syndromic Multiplex Diagnostic Market Revenue (Million), by Country 2024 & 2032
- Figure 8: Europe Syndromic Multiplex Diagnostic Market Volume (K Unit), by Country 2024 & 2032
- Figure 9: Europe Syndromic Multiplex Diagnostic Market Revenue Share (%), by Country 2024 & 2032
- Figure 10: Europe Syndromic Multiplex Diagnostic Market Volume Share (%), by Country 2024 & 2032
- Figure 11: Asia Pacific Syndromic Multiplex Diagnostic Market Revenue (Million), by Country 2024 & 2032
- Figure 12: Asia Pacific Syndromic Multiplex Diagnostic Market Volume (K Unit), by Country 2024 & 2032
- Figure 13: Asia Pacific Syndromic Multiplex Diagnostic Market Revenue Share (%), by Country 2024 & 2032
- Figure 14: Asia Pacific Syndromic Multiplex Diagnostic Market Volume Share (%), by Country 2024 & 2032
- Figure 15: Middle East and Africa Syndromic Multiplex Diagnostic Market Revenue (Million), by Country 2024 & 2032
- Figure 16: Middle East and Africa Syndromic Multiplex Diagnostic Market Volume (K Unit), by Country 2024 & 2032
- Figure 17: Middle East and Africa Syndromic Multiplex Diagnostic Market Revenue Share (%), by Country 2024 & 2032
- Figure 18: Middle East and Africa Syndromic Multiplex Diagnostic Market Volume Share (%), by Country 2024 & 2032
- Figure 19: South America Syndromic Multiplex Diagnostic Market Revenue (Million), by Country 2024 & 2032
- Figure 20: South America Syndromic Multiplex Diagnostic Market Volume (K Unit), by Country 2024 & 2032
- Figure 21: South America Syndromic Multiplex Diagnostic Market Revenue Share (%), by Country 2024 & 2032
- Figure 22: South America Syndromic Multiplex Diagnostic Market Volume Share (%), by Country 2024 & 2032
- Figure 23: North America Syndromic Multiplex Diagnostic Market Revenue (Million), by Type of Syndrome 2024 & 2032
- Figure 24: North America Syndromic Multiplex Diagnostic Market Volume (K Unit), by Type of Syndrome 2024 & 2032
- Figure 25: North America Syndromic Multiplex Diagnostic Market Revenue Share (%), by Type of Syndrome 2024 & 2032
- Figure 26: North America Syndromic Multiplex Diagnostic Market Volume Share (%), by Type of Syndrome 2024 & 2032
- Figure 27: North America Syndromic Multiplex Diagnostic Market Revenue (Million), by End-User 2024 & 2032
- Figure 28: North America Syndromic Multiplex Diagnostic Market Volume (K Unit), by End-User 2024 & 2032
- Figure 29: North America Syndromic Multiplex Diagnostic Market Revenue Share (%), by End-User 2024 & 2032
- Figure 30: North America Syndromic Multiplex Diagnostic Market Volume Share (%), by End-User 2024 & 2032
- Figure 31: North America Syndromic Multiplex Diagnostic Market Revenue (Million), by Country 2024 & 2032
- Figure 32: North America Syndromic Multiplex Diagnostic Market Volume (K Unit), by Country 2024 & 2032
- Figure 33: North America Syndromic Multiplex Diagnostic Market Revenue Share (%), by Country 2024 & 2032
- Figure 34: North America Syndromic Multiplex Diagnostic Market Volume Share (%), by Country 2024 & 2032
- Figure 35: Europe Syndromic Multiplex Diagnostic Market Revenue (Million), by Type of Syndrome 2024 & 2032
- Figure 36: Europe Syndromic Multiplex Diagnostic Market Volume (K Unit), by Type of Syndrome 2024 & 2032
- Figure 37: Europe Syndromic Multiplex Diagnostic Market Revenue Share (%), by Type of Syndrome 2024 & 2032
- Figure 38: Europe Syndromic Multiplex Diagnostic Market Volume Share (%), by Type of Syndrome 2024 & 2032
- Figure 39: Europe Syndromic Multiplex Diagnostic Market Revenue (Million), by End-User 2024 & 2032
- Figure 40: Europe Syndromic Multiplex Diagnostic Market Volume (K Unit), by End-User 2024 & 2032
- Figure 41: Europe Syndromic Multiplex Diagnostic Market Revenue Share (%), by End-User 2024 & 2032
- Figure 42: Europe Syndromic Multiplex Diagnostic Market Volume Share (%), by End-User 2024 & 2032
- Figure 43: Europe Syndromic Multiplex Diagnostic Market Revenue (Million), by Country 2024 & 2032
- Figure 44: Europe Syndromic Multiplex Diagnostic Market Volume (K Unit), by Country 2024 & 2032
- Figure 45: Europe Syndromic Multiplex Diagnostic Market Revenue Share (%), by Country 2024 & 2032
- Figure 46: Europe Syndromic Multiplex Diagnostic Market Volume Share (%), by Country 2024 & 2032
- Figure 47: Asia Pacific Syndromic Multiplex Diagnostic Market Revenue (Million), by Type of Syndrome 2024 & 2032
- Figure 48: Asia Pacific Syndromic Multiplex Diagnostic Market Volume (K Unit), by Type of Syndrome 2024 & 2032
- Figure 49: Asia Pacific Syndromic Multiplex Diagnostic Market Revenue Share (%), by Type of Syndrome 2024 & 2032
- Figure 50: Asia Pacific Syndromic Multiplex Diagnostic Market Volume Share (%), by Type of Syndrome 2024 & 2032
- Figure 51: Asia Pacific Syndromic Multiplex Diagnostic Market Revenue (Million), by End-User 2024 & 2032
- Figure 52: Asia Pacific Syndromic Multiplex Diagnostic Market Volume (K Unit), by End-User 2024 & 2032
- Figure 53: Asia Pacific Syndromic Multiplex Diagnostic Market Revenue Share (%), by End-User 2024 & 2032
- Figure 54: Asia Pacific Syndromic Multiplex Diagnostic Market Volume Share (%), by End-User 2024 & 2032
- Figure 55: Asia Pacific Syndromic Multiplex Diagnostic Market Revenue (Million), by Country 2024 & 2032
- Figure 56: Asia Pacific Syndromic Multiplex Diagnostic Market Volume (K Unit), by Country 2024 & 2032
- Figure 57: Asia Pacific Syndromic Multiplex Diagnostic Market Revenue Share (%), by Country 2024 & 2032
- Figure 58: Asia Pacific Syndromic Multiplex Diagnostic Market Volume Share (%), by Country 2024 & 2032
- Figure 59: Middle East and Africa Syndromic Multiplex Diagnostic Market Revenue (Million), by Type of Syndrome 2024 & 2032
- Figure 60: Middle East and Africa Syndromic Multiplex Diagnostic Market Volume (K Unit), by Type of Syndrome 2024 & 2032
- Figure 61: Middle East and Africa Syndromic Multiplex Diagnostic Market Revenue Share (%), by Type of Syndrome 2024 & 2032
- Figure 62: Middle East and Africa Syndromic Multiplex Diagnostic Market Volume Share (%), by Type of Syndrome 2024 & 2032
- Figure 63: Middle East and Africa Syndromic Multiplex Diagnostic Market Revenue (Million), by End-User 2024 & 2032
- Figure 64: Middle East and Africa Syndromic Multiplex Diagnostic Market Volume (K Unit), by End-User 2024 & 2032
- Figure 65: Middle East and Africa Syndromic Multiplex Diagnostic Market Revenue Share (%), by End-User 2024 & 2032
- Figure 66: Middle East and Africa Syndromic Multiplex Diagnostic Market Volume Share (%), by End-User 2024 & 2032
- Figure 67: Middle East and Africa Syndromic Multiplex Diagnostic Market Revenue (Million), by Country 2024 & 2032
- Figure 68: Middle East and Africa Syndromic Multiplex Diagnostic Market Volume (K Unit), by Country 2024 & 2032
- Figure 69: Middle East and Africa Syndromic Multiplex Diagnostic Market Revenue Share (%), by Country 2024 & 2032
- Figure 70: Middle East and Africa Syndromic Multiplex Diagnostic Market Volume Share (%), by Country 2024 & 2032
- Figure 71: South America Syndromic Multiplex Diagnostic Market Revenue (Million), by Type of Syndrome 2024 & 2032
- Figure 72: South America Syndromic Multiplex Diagnostic Market Volume (K Unit), by Type of Syndrome 2024 & 2032
- Figure 73: South America Syndromic Multiplex Diagnostic Market Revenue Share (%), by Type of Syndrome 2024 & 2032
- Figure 74: South America Syndromic Multiplex Diagnostic Market Volume Share (%), by Type of Syndrome 2024 & 2032
- Figure 75: South America Syndromic Multiplex Diagnostic Market Revenue (Million), by End-User 2024 & 2032
- Figure 76: South America Syndromic Multiplex Diagnostic Market Volume (K Unit), by End-User 2024 & 2032
- Figure 77: South America Syndromic Multiplex Diagnostic Market Revenue Share (%), by End-User 2024 & 2032
- Figure 78: South America Syndromic Multiplex Diagnostic Market Volume Share (%), by End-User 2024 & 2032
- Figure 79: South America Syndromic Multiplex Diagnostic Market Revenue (Million), by Country 2024 & 2032
- Figure 80: South America Syndromic Multiplex Diagnostic Market Volume (K Unit), by Country 2024 & 2032
- Figure 81: South America Syndromic Multiplex Diagnostic Market Revenue Share (%), by Country 2024 & 2032
- Figure 82: South America Syndromic Multiplex Diagnostic Market Volume Share (%), by Country 2024 & 2032
List of Tables
- Table 1: Global Syndromic Multiplex Diagnostic Market Revenue Million Forecast, by Region 2019 & 2032
- Table 2: Global Syndromic Multiplex Diagnostic Market Volume K Unit Forecast, by Region 2019 & 2032
- Table 3: Global Syndromic Multiplex Diagnostic Market Revenue Million Forecast, by Type of Syndrome 2019 & 2032
- Table 4: Global Syndromic Multiplex Diagnostic Market Volume K Unit Forecast, by Type of Syndrome 2019 & 2032
- Table 5: Global Syndromic Multiplex Diagnostic Market Revenue Million Forecast, by End-User 2019 & 2032
- Table 6: Global Syndromic Multiplex Diagnostic Market Volume K Unit Forecast, by End-User 2019 & 2032
- Table 7: Global Syndromic Multiplex Diagnostic Market Revenue Million Forecast, by Region 2019 & 2032
- Table 8: Global Syndromic Multiplex Diagnostic Market Volume K Unit Forecast, by Region 2019 & 2032
- Table 9: Global Syndromic Multiplex Diagnostic Market Revenue Million Forecast, by Country 2019 & 2032
- Table 10: Global Syndromic Multiplex Diagnostic Market Volume K Unit Forecast, by Country 2019 & 2032
- Table 11: United States Syndromic Multiplex Diagnostic Market Revenue (Million) Forecast, by Application 2019 & 2032
- Table 12: United States Syndromic Multiplex Diagnostic Market Volume (K Unit) Forecast, by Application 2019 & 2032
- Table 13: Canada Syndromic Multiplex Diagnostic Market Revenue (Million) Forecast, by Application 2019 & 2032
- Table 14: Canada Syndromic Multiplex Diagnostic Market Volume (K Unit) Forecast, by Application 2019 & 2032
- Table 15: Mexico Syndromic Multiplex Diagnostic Market Revenue (Million) Forecast, by Application 2019 & 2032
- Table 16: Mexico Syndromic Multiplex Diagnostic Market Volume (K Unit) Forecast, by Application 2019 & 2032
- Table 17: Global Syndromic Multiplex Diagnostic Market Revenue Million Forecast, by Country 2019 & 2032
- Table 18: Global Syndromic Multiplex Diagnostic Market Volume K Unit Forecast, by Country 2019 & 2032
- Table 19: Germany Syndromic Multiplex Diagnostic Market Revenue (Million) Forecast, by Application 2019 & 2032
- Table 20: Germany Syndromic Multiplex Diagnostic Market Volume (K Unit) Forecast, by Application 2019 & 2032
- Table 21: United Kingdom Syndromic Multiplex Diagnostic Market Revenue (Million) Forecast, by Application 2019 & 2032
- Table 22: United Kingdom Syndromic Multiplex Diagnostic Market Volume (K Unit) Forecast, by Application 2019 & 2032
- Table 23: France Syndromic Multiplex Diagnostic Market Revenue (Million) Forecast, by Application 2019 & 2032
- Table 24: France Syndromic Multiplex Diagnostic Market Volume (K Unit) Forecast, by Application 2019 & 2032
- Table 25: Italy Syndromic Multiplex Diagnostic Market Revenue (Million) Forecast, by Application 2019 & 2032
- Table 26: Italy Syndromic Multiplex Diagnostic Market Volume (K Unit) Forecast, by Application 2019 & 2032
- Table 27: Spain Syndromic Multiplex Diagnostic Market Revenue (Million) Forecast, by Application 2019 & 2032
- Table 28: Spain Syndromic Multiplex Diagnostic Market Volume (K Unit) Forecast, by Application 2019 & 2032
- Table 29: Rest of Europe Syndromic Multiplex Diagnostic Market Revenue (Million) Forecast, by Application 2019 & 2032
- Table 30: Rest of Europe Syndromic Multiplex Diagnostic Market Volume (K Unit) Forecast, by Application 2019 & 2032
- Table 31: Global Syndromic Multiplex Diagnostic Market Revenue Million Forecast, by Country 2019 & 2032
- Table 32: Global Syndromic Multiplex Diagnostic Market Volume K Unit Forecast, by Country 2019 & 2032
- Table 33: China Syndromic Multiplex Diagnostic Market Revenue (Million) Forecast, by Application 2019 & 2032
- Table 34: China Syndromic Multiplex Diagnostic Market Volume (K Unit) Forecast, by Application 2019 & 2032
- Table 35: Japan Syndromic Multiplex Diagnostic Market Revenue (Million) Forecast, by Application 2019 & 2032
- Table 36: Japan Syndromic Multiplex Diagnostic Market Volume (K Unit) Forecast, by Application 2019 & 2032
- Table 37: India Syndromic Multiplex Diagnostic Market Revenue (Million) Forecast, by Application 2019 & 2032
- Table 38: India Syndromic Multiplex Diagnostic Market Volume (K Unit) Forecast, by Application 2019 & 2032
- Table 39: Australia Syndromic Multiplex Diagnostic Market Revenue (Million) Forecast, by Application 2019 & 2032
- Table 40: Australia Syndromic Multiplex Diagnostic Market Volume (K Unit) Forecast, by Application 2019 & 2032
- Table 41: South Korea Syndromic Multiplex Diagnostic Market Revenue (Million) Forecast, by Application 2019 & 2032
- Table 42: South Korea Syndromic Multiplex Diagnostic Market Volume (K Unit) Forecast, by Application 2019 & 2032
- Table 43: Rest of Asia Pacific Syndromic Multiplex Diagnostic Market Revenue (Million) Forecast, by Application 2019 & 2032
- Table 44: Rest of Asia Pacific Syndromic Multiplex Diagnostic Market Volume (K Unit) Forecast, by Application 2019 & 2032
- Table 45: Global Syndromic Multiplex Diagnostic Market Revenue Million Forecast, by Country 2019 & 2032
- Table 46: Global Syndromic Multiplex Diagnostic Market Volume K Unit Forecast, by Country 2019 & 2032
- Table 47: GCC Syndromic Multiplex Diagnostic Market Revenue (Million) Forecast, by Application 2019 & 2032
- Table 48: GCC Syndromic Multiplex Diagnostic Market Volume (K Unit) Forecast, by Application 2019 & 2032
- Table 49: South Africa Syndromic Multiplex Diagnostic Market Revenue (Million) Forecast, by Application 2019 & 2032
- Table 50: South Africa Syndromic Multiplex Diagnostic Market Volume (K Unit) Forecast, by Application 2019 & 2032
- Table 51: Rest of Middle East and Africa Syndromic Multiplex Diagnostic Market Revenue (Million) Forecast, by Application 2019 & 2032
- Table 52: Rest of Middle East and Africa Syndromic Multiplex Diagnostic Market Volume (K Unit) Forecast, by Application 2019 & 2032
- Table 53: Global Syndromic Multiplex Diagnostic Market Revenue Million Forecast, by Country 2019 & 2032
- Table 54: Global Syndromic Multiplex Diagnostic Market Volume K Unit Forecast, by Country 2019 & 2032
- Table 55: Brazil Syndromic Multiplex Diagnostic Market Revenue (Million) Forecast, by Application 2019 & 2032
- Table 56: Brazil Syndromic Multiplex Diagnostic Market Volume (K Unit) Forecast, by Application 2019 & 2032
- Table 57: Argentina Syndromic Multiplex Diagnostic Market Revenue (Million) Forecast, by Application 2019 & 2032
- Table 58: Argentina Syndromic Multiplex Diagnostic Market Volume (K Unit) Forecast, by Application 2019 & 2032
- Table 59: Rest of South America Syndromic Multiplex Diagnostic Market Revenue (Million) Forecast, by Application 2019 & 2032
- Table 60: Rest of South America Syndromic Multiplex Diagnostic Market Volume (K Unit) Forecast, by Application 2019 & 2032
- Table 61: Global Syndromic Multiplex Diagnostic Market Revenue Million Forecast, by Type of Syndrome 2019 & 2032
- Table 62: Global Syndromic Multiplex Diagnostic Market Volume K Unit Forecast, by Type of Syndrome 2019 & 2032
- Table 63: Global Syndromic Multiplex Diagnostic Market Revenue Million Forecast, by End-User 2019 & 2032
- Table 64: Global Syndromic Multiplex Diagnostic Market Volume K Unit Forecast, by End-User 2019 & 2032
- Table 65: Global Syndromic Multiplex Diagnostic Market Revenue Million Forecast, by Country 2019 & 2032
- Table 66: Global Syndromic Multiplex Diagnostic Market Volume K Unit Forecast, by Country 2019 & 2032
- Table 67: United States Syndromic Multiplex Diagnostic Market Revenue (Million) Forecast, by Application 2019 & 2032
- Table 68: United States Syndromic Multiplex Diagnostic Market Volume (K Unit) Forecast, by Application 2019 & 2032
- Table 69: Canada Syndromic Multiplex Diagnostic Market Revenue (Million) Forecast, by Application 2019 & 2032
- Table 70: Canada Syndromic Multiplex Diagnostic Market Volume (K Unit) Forecast, by Application 2019 & 2032
- Table 71: Mexico Syndromic Multiplex Diagnostic Market Revenue (Million) Forecast, by Application 2019 & 2032
- Table 72: Mexico Syndromic Multiplex Diagnostic Market Volume (K Unit) Forecast, by Application 2019 & 2032
- Table 73: Global Syndromic Multiplex Diagnostic Market Revenue Million Forecast, by Type of Syndrome 2019 & 2032
- Table 74: Global Syndromic Multiplex Diagnostic Market Volume K Unit Forecast, by Type of Syndrome 2019 & 2032
- Table 75: Global Syndromic Multiplex Diagnostic Market Revenue Million Forecast, by End-User 2019 & 2032
- Table 76: Global Syndromic Multiplex Diagnostic Market Volume K Unit Forecast, by End-User 2019 & 2032
- Table 77: Global Syndromic Multiplex Diagnostic Market Revenue Million Forecast, by Country 2019 & 2032
- Table 78: Global Syndromic Multiplex Diagnostic Market Volume K Unit Forecast, by Country 2019 & 2032
- Table 79: Germany Syndromic Multiplex Diagnostic Market Revenue (Million) Forecast, by Application 2019 & 2032
- Table 80: Germany Syndromic Multiplex Diagnostic Market Volume (K Unit) Forecast, by Application 2019 & 2032
- Table 81: United Kingdom Syndromic Multiplex Diagnostic Market Revenue (Million) Forecast, by Application 2019 & 2032
- Table 82: United Kingdom Syndromic Multiplex Diagnostic Market Volume (K Unit) Forecast, by Application 2019 & 2032
- Table 83: France Syndromic Multiplex Diagnostic Market Revenue (Million) Forecast, by Application 2019 & 2032
- Table 84: France Syndromic Multiplex Diagnostic Market Volume (K Unit) Forecast, by Application 2019 & 2032
- Table 85: Italy Syndromic Multiplex Diagnostic Market Revenue (Million) Forecast, by Application 2019 & 2032
- Table 86: Italy Syndromic Multiplex Diagnostic Market Volume (K Unit) Forecast, by Application 2019 & 2032
- Table 87: Spain Syndromic Multiplex Diagnostic Market Revenue (Million) Forecast, by Application 2019 & 2032
- Table 88: Spain Syndromic Multiplex Diagnostic Market Volume (K Unit) Forecast, by Application 2019 & 2032
- Table 89: Rest of Europe Syndromic Multiplex Diagnostic Market Revenue (Million) Forecast, by Application 2019 & 2032
- Table 90: Rest of Europe Syndromic Multiplex Diagnostic Market Volume (K Unit) Forecast, by Application 2019 & 2032
- Table 91: Global Syndromic Multiplex Diagnostic Market Revenue Million Forecast, by Type of Syndrome 2019 & 2032
- Table 92: Global Syndromic Multiplex Diagnostic Market Volume K Unit Forecast, by Type of Syndrome 2019 & 2032
- Table 93: Global Syndromic Multiplex Diagnostic Market Revenue Million Forecast, by End-User 2019 & 2032
- Table 94: Global Syndromic Multiplex Diagnostic Market Volume K Unit Forecast, by End-User 2019 & 2032
- Table 95: Global Syndromic Multiplex Diagnostic Market Revenue Million Forecast, by Country 2019 & 2032
- Table 96: Global Syndromic Multiplex Diagnostic Market Volume K Unit Forecast, by Country 2019 & 2032
- Table 97: China Syndromic Multiplex Diagnostic Market Revenue (Million) Forecast, by Application 2019 & 2032
- Table 98: China Syndromic Multiplex Diagnostic Market Volume (K Unit) Forecast, by Application 2019 & 2032
- Table 99: Japan Syndromic Multiplex Diagnostic Market Revenue (Million) Forecast, by Application 2019 & 2032
- Table 100: Japan Syndromic Multiplex Diagnostic Market Volume (K Unit) Forecast, by Application 2019 & 2032
- Table 101: India Syndromic Multiplex Diagnostic Market Revenue (Million) Forecast, by Application 2019 & 2032
- Table 102: India Syndromic Multiplex Diagnostic Market Volume (K Unit) Forecast, by Application 2019 & 2032
- Table 103: Australia Syndromic Multiplex Diagnostic Market Revenue (Million) Forecast, by Application 2019 & 2032
- Table 104: Australia Syndromic Multiplex Diagnostic Market Volume (K Unit) Forecast, by Application 2019 & 2032
- Table 105: South Korea Syndromic Multiplex Diagnostic Market Revenue (Million) Forecast, by Application 2019 & 2032
- Table 106: South Korea Syndromic Multiplex Diagnostic Market Volume (K Unit) Forecast, by Application 2019 & 2032
- Table 107: Rest of Asia Pacific Syndromic Multiplex Diagnostic Market Revenue (Million) Forecast, by Application 2019 & 2032
- Table 108: Rest of Asia Pacific Syndromic Multiplex Diagnostic Market Volume (K Unit) Forecast, by Application 2019 & 2032
- Table 109: Global Syndromic Multiplex Diagnostic Market Revenue Million Forecast, by Type of Syndrome 2019 & 2032
- Table 110: Global Syndromic Multiplex Diagnostic Market Volume K Unit Forecast, by Type of Syndrome 2019 & 2032
- Table 111: Global Syndromic Multiplex Diagnostic Market Revenue Million Forecast, by End-User 2019 & 2032
- Table 112: Global Syndromic Multiplex Diagnostic Market Volume K Unit Forecast, by End-User 2019 & 2032
- Table 113: Global Syndromic Multiplex Diagnostic Market Revenue Million Forecast, by Country 2019 & 2032
- Table 114: Global Syndromic Multiplex Diagnostic Market Volume K Unit Forecast, by Country 2019 & 2032
- Table 115: GCC Syndromic Multiplex Diagnostic Market Revenue (Million) Forecast, by Application 2019 & 2032
- Table 116: GCC Syndromic Multiplex Diagnostic Market Volume (K Unit) Forecast, by Application 2019 & 2032
- Table 117: South Africa Syndromic Multiplex Diagnostic Market Revenue (Million) Forecast, by Application 2019 & 2032
- Table 118: South Africa Syndromic Multiplex Diagnostic Market Volume (K Unit) Forecast, by Application 2019 & 2032
- Table 119: Rest of Middle East and Africa Syndromic Multiplex Diagnostic Market Revenue (Million) Forecast, by Application 2019 & 2032
- Table 120: Rest of Middle East and Africa Syndromic Multiplex Diagnostic Market Volume (K Unit) Forecast, by Application 2019 & 2032
- Table 121: Global Syndromic Multiplex Diagnostic Market Revenue Million Forecast, by Type of Syndrome 2019 & 2032
- Table 122: Global Syndromic Multiplex Diagnostic Market Volume K Unit Forecast, by Type of Syndrome 2019 & 2032
- Table 123: Global Syndromic Multiplex Diagnostic Market Revenue Million Forecast, by End-User 2019 & 2032
- Table 124: Global Syndromic Multiplex Diagnostic Market Volume K Unit Forecast, by End-User 2019 & 2032
- Table 125: Global Syndromic Multiplex Diagnostic Market Revenue Million Forecast, by Country 2019 & 2032
- Table 126: Global Syndromic Multiplex Diagnostic Market Volume K Unit Forecast, by Country 2019 & 2032
- Table 127: Brazil Syndromic Multiplex Diagnostic Market Revenue (Million) Forecast, by Application 2019 & 2032
- Table 128: Brazil Syndromic Multiplex Diagnostic Market Volume (K Unit) Forecast, by Application 2019 & 2032
- Table 129: Argentina Syndromic Multiplex Diagnostic Market Revenue (Million) Forecast, by Application 2019 & 2032
- Table 130: Argentina Syndromic Multiplex Diagnostic Market Volume (K Unit) Forecast, by Application 2019 & 2032
- Table 131: Rest of South America Syndromic Multiplex Diagnostic Market Revenue (Million) Forecast, by Application 2019 & 2032
- Table 132: Rest of South America Syndromic Multiplex Diagnostic Market Volume (K Unit) Forecast, by Application 2019 & 2032
Frequently Asked Questions
1. What is the projected Compound Annual Growth Rate (CAGR) of the Syndromic Multiplex Diagnostic Market?
The projected CAGR is approximately 7.66%.
2. Which companies are prominent players in the Syndromic Multiplex Diagnostic Market?
Key companies in the market include Becton Dickinson and Company, DiaSorin S p A (Luminex Corporation), Accelerate Diagnostic, Thermo Fisher Scientific inc, F Hoffmann-La Roche Ltd, Hologic Inc, Abbott Laboratories, Qiagen, Accelerate Diagnostics Inc, Akonni Biosystems, Applied BioCode, Abacus Diagnostica Oy, bioMerieux.
3. What are the main segments of the Syndromic Multiplex Diagnostic Market?
The market segments include Type of Syndrome, End-User.
4. Can you provide details about the market size?
The market size is estimated to be USD 2.68 Million as of 2022.
5. What are some drivers contributing to market growth?
Increasing Demand for Accurate and Rapid Results; Quick Access to the Treatment.
6. What are the notable trends driving market growth?
Gastrointestinal Segment is Expected to Hold a Significant Share in the Market Over the Forecast Period.
7. Are there any restraints impacting market growth?
Lack of Skilled Professional; Inability in Detecting Asymptomatic Cases.
8. Can you provide examples of recent developments in the market?
In March 2022, Applied BioCode signed an agreement with Hardy Diagnostics for the distribution of the MDx-3000 System and its comprehensive menu for the diagnosis of upper respiratory infections, and gastrointestinal infections as well as a suite of Analyte Specific Reagents (ASRs). Under this agreement, Hardy Diagnostics is responsible to distribute the Automated High Throughput Multiplex Molecular Diagnostic System (MDx-3000) in the United States.
9. What pricing options are available for accessing the report?
Pricing options include single-user, multi-user, and enterprise licenses priced at USD 4750, USD 5250, and USD 8750 respectively.
10. Is the market size provided in terms of value or volume?
The market size is provided in terms of value, measured in Million and volume, measured in K Unit.
11. Are there any specific market keywords associated with the report?
Yes, the market keyword associated with the report is "Syndromic Multiplex Diagnostic Market," which aids in identifying and referencing the specific market segment covered.
12. How do I determine which pricing option suits my needs best?
The pricing options vary based on user requirements and access needs. Individual users may opt for single-user licenses, while businesses requiring broader access may choose multi-user or enterprise licenses for cost-effective access to the report.
13. Are there any additional resources or data provided in the Syndromic Multiplex Diagnostic Market report?
While the report offers comprehensive insights, it's advisable to review the specific contents or supplementary materials provided to ascertain if additional resources or data are available.
14. How can I stay updated on further developments or reports in the Syndromic Multiplex Diagnostic Market?
To stay informed about further developments, trends, and reports in the Syndromic Multiplex Diagnostic Market, consider subscribing to industry newsletters, following relevant companies and organizations, or regularly checking reputable industry news sources and publications.
Methodology
Step 1 - Identification of Relevant Samples Size from Population Database


Step 2 - Approaches for Defining Global Market Size (Value, Volume* & Price*)

Note*: In applicable scenarios
Step 3 - Data Sources
Primary Research
- Web Analytics
- Survey Reports
- Research Institute
- Latest Research Reports
- Opinion Leaders
Secondary Research
- Annual Reports
- White Paper
- Latest Press Release
- Industry Association
- Paid Database
- Investor Presentations

Step 4 - Data Triangulation
Involves using different sources of information in order to increase the validity of a study
These sources are likely to be stakeholders in a program - participants, other researchers, program staff, other community members, and so on.
Then we put all data in single framework & apply various statistical tools to find out the dynamic on the market.
During the analysis stage, feedback from the stakeholder groups would be compared to determine areas of agreement as well as areas of divergence


