
Key Insights
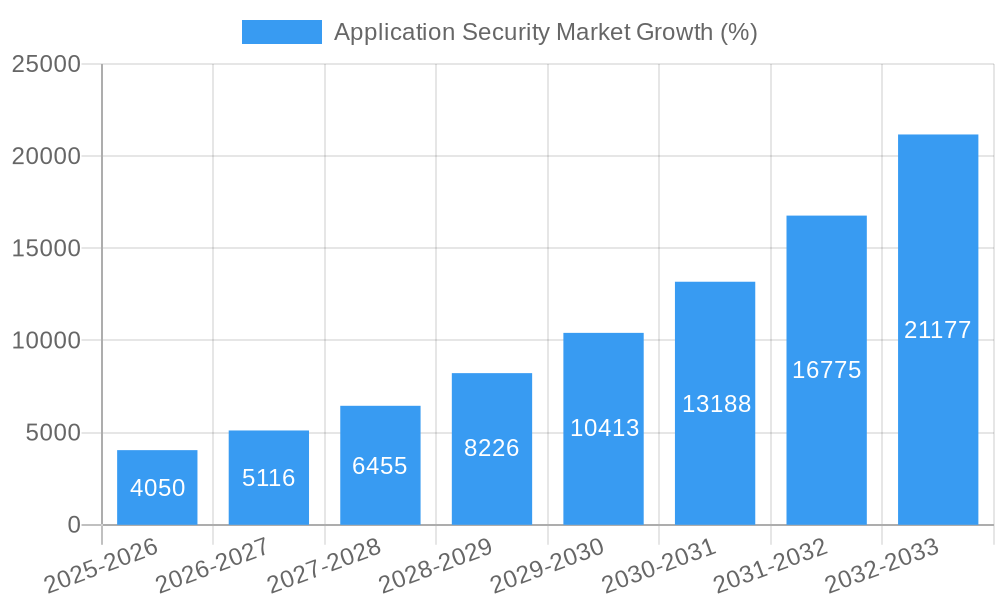
The Application Security market is experiencing robust growth, projected to reach a substantial size due to the increasing frequency and severity of cyberattacks targeting applications. The market's Compound Annual Growth Rate (CAGR) of 26.76% from 2019-2024 indicates significant momentum driven by several key factors. The expanding adoption of cloud computing and mobile technologies necessitates robust application security measures, fueling demand for solutions across various deployment models (on-premise, cloud, hybrid). Furthermore, the rising complexity of software applications and the escalating sophistication of cyber threats necessitate a multi-layered approach to security testing, including Static Application Security Testing (SAST), Dynamic Application Security Testing (DAST), Interactive Application Security Testing (IAST), Runtime Application Self-Protection (RASP), and penetration testing. The diverse range of application types (mobile, web, cloud, enterprise) further contributes to market expansion, as each requires specialized security solutions. Major industry verticals like BFSI, healthcare, and government are significantly investing in application security due to stringent regulatory compliance requirements and the protection of sensitive data.
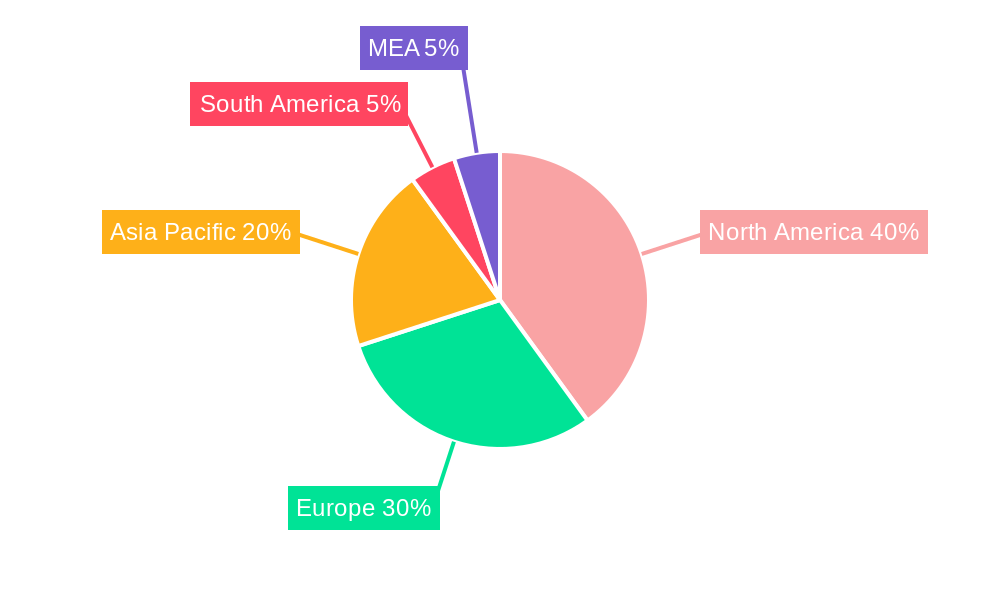
The market segmentation reveals a strong preference for cloud-based solutions, reflecting the broader industry shift towards cloud adoption. Within testing types, SAST and DAST remain dominant, while IAST and RASP are experiencing faster growth, reflecting the need for more comprehensive and real-time security monitoring. The geographic distribution of the market shows strong growth across North America and Asia Pacific, driven by high technology adoption rates and significant investments in cybersecurity infrastructure. Key players like IBM, Accenture, and Veracode are strategically expanding their offerings and market reach through acquisitions, partnerships, and the development of innovative solutions, further intensifying competition and driving innovation within the sector. Overall, the market is poised for continued expansion, propelled by ongoing technological advancements, increasing regulatory pressures, and the persistent threat landscape.

Application Security Market Report: 2019-2033
This comprehensive report provides a detailed analysis of the Application Security Market, encompassing its current state, future trajectory, and key players. With a study period spanning 2019-2033, a base year of 2025, and a forecast period of 2025-2033, this report offers invaluable insights for industry professionals, investors, and strategists. The market is segmented by deployment (On-Premise, Cloud, Hybrid), type (Network Security Testing, Application Security Testing), application type (Mobile, Web, Cloud, Enterprise), testing type (SAST, DAST, IAST, RASP), testing tool, and end-user industry (Government, BFSI, Healthcare, Manufacturing, IT & Telecom, Retail, Others). The report projects a market value of xx Million in 2025, growing at a CAGR of xx% during the forecast period.
Application Security Market Dynamics & Structure
The Application Security Market is characterized by moderate concentration, with a few major players holding significant market share, while numerous smaller firms cater to niche segments. The market is driven by escalating cyber threats, increasing regulatory compliance mandates (like GDPR and CCPA), and the rising adoption of cloud computing and mobile applications. Technological innovations such as AI-powered security solutions and automation are further fueling market growth. However, high implementation costs, skill shortages in cybersecurity professionals, and the constant evolution of attack techniques pose significant challenges. Mergers and acquisitions (M&A) activity within the sector is relatively frequent, indicating a trend towards consolidation and expansion.
- Market Concentration: Moderately concentrated, with top 5 players holding approximately xx% market share in 2025.
- Technological Innovation Drivers: AI-powered threat detection, automation of security testing, and advancements in RASP (Runtime Application Self-Protection).
- Regulatory Frameworks: GDPR, CCPA, HIPAA, and other industry-specific regulations driving demand for robust application security solutions.
- Competitive Product Substitutes: Limited direct substitutes, but alternative security approaches (e.g., focusing on network security) may divert some investment.
- End-User Demographics: Growth driven by increased adoption across all sectors, with BFSI, IT & Telecom, and Healthcare showing significant demand.
- M&A Trends: xx M&A deals recorded in the past 5 years, indicating a trend towards consolidation and expansion of market players.
Application Security Market Growth Trends & Insights
The Application Security Market has experienced significant growth throughout the historical period (2019-2024), driven by the factors outlined above. The market size reached xx Million in 2024, and is projected to reach xx Million by 2025. This growth is primarily fueled by the increasing adoption of cloud-based applications, the proliferation of mobile devices, and growing awareness of data breaches and their associated costs. The CAGR for the forecast period (2025-2033) is projected to be xx%, indicating strong continued growth. Market penetration for application security solutions remains relatively low in certain industry segments, representing a substantial opportunity for expansion. Technological disruptions such as the rise of serverless computing and the increased complexity of software development further underscore the need for advanced application security measures. Shifting consumer behavior towards increased reliance on digital services and the Internet of Things (IoT) is also contributing to higher demand.
Dominant Regions, Countries, or Segments in Application Security Market
North America currently holds the largest market share, driven by high adoption rates in the IT & Telecom and BFSI sectors, strong regulatory environments, and a high concentration of major players. However, the Asia-Pacific region is projected to exhibit the highest growth rate during the forecast period, fueled by rapid technological advancements, increasing digitalization, and expanding government investments in cybersecurity infrastructure. Within the segments, Cloud deployment and Application Security Testing are the fastest-growing areas, reflecting the shift towards cloud-native architectures and the need for comprehensive security testing throughout the software development lifecycle.
- Key Drivers:
- North America: Strong regulatory landscape, high technological maturity, significant investments in cybersecurity.
- Asia-Pacific: Rapid digitalization, growing IT spending, and government initiatives to bolster cybersecurity.
- Europe: Stringent data privacy regulations (GDPR), increasing cyber threats, and a strong focus on compliance.
- Dominant Segments: Cloud Deployment (projected xx% market share by 2033), Application Security Testing (projected xx% market share by 2033).
Application Security Market Product Landscape
The Application Security Market boasts a wide range of products, including SAST (Static Application Security Testing), DAST (Dynamic Application Security Testing), IAST (Interactive Application Security Testing), and RASP (Runtime Application Self-Protection) solutions. These products are constantly evolving, incorporating advanced features such as AI-powered threat detection, automated vulnerability remediation, and integration with DevOps pipelines. The key selling propositions include improved accuracy, reduced false positives, and streamlined integration into existing workflows. Recent advancements focus on enhancing scalability, improving usability, and expanding coverage across diverse application architectures and platforms.
Key Drivers, Barriers & Challenges in Application Security Market
Key Drivers: The increasing sophistication and frequency of cyberattacks, stringent regulatory compliance requirements, rising adoption of cloud and mobile technologies, and the growing awareness of data breaches are the primary drivers propelling the market. Government initiatives promoting cybersecurity awareness and investment also contribute significantly.
Challenges & Restraints: High implementation and maintenance costs can be prohibitive for smaller organizations. The shortage of skilled cybersecurity professionals poses a significant bottleneck. The constant evolution of attack techniques requires continuous adaptation and updates to security solutions. Integration complexities with existing systems can create implementation hurdles, particularly in legacy environments. Finally, concerns about the potential impact on application performance can hinder adoption.
Emerging Opportunities in Application Security Market
Significant opportunities exist in the expanding IoT market, the growing adoption of serverless computing, and the increasing demand for security solutions tailored to specific industry verticals (e.g., healthcare, finance). The development of AI-powered security tools capable of proactively identifying and mitigating threats presents significant potential. Furthermore, the market for managed security services, which provide outsourced security expertise, is experiencing substantial growth.
Growth Accelerators in the Application Security Market Industry
Strategic partnerships between application security vendors and cloud providers are accelerating market growth by seamlessly integrating security solutions into cloud platforms. Technological breakthroughs such as AI and machine learning are significantly enhancing the accuracy and efficiency of vulnerability detection and remediation. Market expansion into untapped regions, particularly in developing economies, presents significant growth potential. Finally, the increased focus on DevSecOps practices, integrating security into the software development lifecycle, is accelerating the adoption of automated security testing solutions.
Key Players Shaping the Application Security Market Market
- iViZ Security Inc
- Accenture PLC
- Core Security Technologies Inc
- IBM Corporation
- Applause App Quality Inc
- Offensive Security LLC
- Veracode Inc
- Hewlett Packard Enterprise Company
- McAfee LLC
- Checkmarx Ltd
- Cisco Systems Inc
- Maveric Systems Ltd
- Paladion Networks Pvt Ltd
- ControlCase LLC
Notable Milestones in Application Security Market Sector
- July 2023: Hewlett Packard Enterprise's partnership with Fastweb S.p.A highlights the growing adoption of edge-to-cloud platforms and the increasing importance of security in modernizing IT infrastructure. This strengthens HPE’s position in the market and underscores the demand for secure cloud solutions.
- April 2023: McAfee's extended partnership with Samsung signifies the increasing integration of security solutions into consumer devices, enhancing end-user protection and expanding McAfee's market reach. This partnership further demonstrates the growing importance of pre-installed security features in the mobile market.
In-Depth Application Security Market Market Outlook
The Application Security Market is poised for sustained growth, driven by ongoing technological advancements, increasing cyber threats, and the growing adoption of digital technologies across all sectors. Strategic partnerships, investments in R&D, and expansion into new markets will continue to fuel this growth. The market presents significant opportunities for innovation, particularly in the areas of AI-powered security, automation, and the development of comprehensive solutions for emerging technologies such as IoT and serverless computing. Companies that can effectively address the evolving security needs of businesses and consumers will be well-positioned to capture significant market share.
Application Security Market Segmentation
-
1. Deployment
- 1.1. On Premise
- 1.2. Cloud
- 1.3. Hybrid
-
2. Type
-
2.1. Network Security Testing
- 2.1.1. VPN Testing
- 2.1.2. Firewall Testing
- 2.1.3. Other Service Types
-
2.2. Application Security Testing
-
2.2.1. Application Type
- 2.2.1.1. Mobile Application Security Testing
- 2.2.1.2. Web Application Security Testing
- 2.2.1.3. Cloud Application Security Testing
- 2.2.1.4. Enterprise Application Security Testing
-
2.2.2. Testing Type
- 2.2.2.1. SAST
- 2.2.2.2. DAST
- 2.2.2.3. IAST
- 2.2.2.4. RASP
-
2.2.1. Application Type
-
2.1. Network Security Testing
-
3. Testing Tool
- 3.1. Web Application Testing Tool
- 3.2. Code Review Tool
- 3.3. Penetration Testing Tool
- 3.4. Software Testing Tool
- 3.5. Other Testing Tools
-
4. End user Industry
- 4.1. Government
- 4.2. BFSI
- 4.3. Healthcare
- 4.4. Manufacturing
- 4.5. IT and Telecom
- 4.6. Retail
- 4.7. Other End user Industries
Application Security Market Segmentation By Geography
- 1. North America
- 2. Europe
- 3. Asia
- 4. Latin America
- 5. Middle East and Africa
Application Security Market REPORT HIGHLIGHTS
| Aspects | Details |
|---|---|
| Study Period | 2019-2033 |
| Base Year | 2024 |
| Estimated Year | 2025 |
| Forecast Period | 2025-2033 |
| Historical Period | 2019-2024 |
| Growth Rate | CAGR of 26.76% from 2019-2033 |
| Segmentation |
|
Table of Contents
- 1. Introduction
- 1.1. Research Scope
- 1.2. Market Segmentation
- 1.3. Research Methodology
- 1.4. Definitions and Assumptions
- 2. Executive Summary
- 2.1. Introduction
- 3. Market Dynamics
- 3.1. Introduction
- 3.2. Market Drivers
- 3.2.1. Increasing Security Threats; Government Regulations Driving Security Needs
- 3.3. Market Restrains
- 3.3.1. Lack of Awareness About Security Testing
- 3.4. Market Trends
- 3.4.1. Cloud Segment to Gain Significant Importance over the Forecast Period
- 4. Market Factor Analysis
- 4.1. Porters Five Forces
- 4.2. Supply/Value Chain
- 4.3. PESTEL analysis
- 4.4. Market Entropy
- 4.5. Patent/Trademark Analysis
- 5. Global Application Security Market Analysis, Insights and Forecast, 2019-2031
- 5.1. Market Analysis, Insights and Forecast - by Deployment
- 5.1.1. On Premise
- 5.1.2. Cloud
- 5.1.3. Hybrid
- 5.2. Market Analysis, Insights and Forecast - by Type
- 5.2.1. Network Security Testing
- 5.2.1.1. VPN Testing
- 5.2.1.2. Firewall Testing
- 5.2.1.3. Other Service Types
- 5.2.2. Application Security Testing
- 5.2.2.1. Application Type
- 5.2.2.1.1. Mobile Application Security Testing
- 5.2.2.1.2. Web Application Security Testing
- 5.2.2.1.3. Cloud Application Security Testing
- 5.2.2.1.4. Enterprise Application Security Testing
- 5.2.2.2. Testing Type
- 5.2.2.2.1. SAST
- 5.2.2.2.2. DAST
- 5.2.2.2.3. IAST
- 5.2.2.2.4. RASP
- 5.2.2.1. Application Type
- 5.2.1. Network Security Testing
- 5.3. Market Analysis, Insights and Forecast - by Testing Tool
- 5.3.1. Web Application Testing Tool
- 5.3.2. Code Review Tool
- 5.3.3. Penetration Testing Tool
- 5.3.4. Software Testing Tool
- 5.3.5. Other Testing Tools
- 5.4. Market Analysis, Insights and Forecast - by End user Industry
- 5.4.1. Government
- 5.4.2. BFSI
- 5.4.3. Healthcare
- 5.4.4. Manufacturing
- 5.4.5. IT and Telecom
- 5.4.6. Retail
- 5.4.7. Other End user Industries
- 5.5. Market Analysis, Insights and Forecast - by Region
- 5.5.1. North America
- 5.5.2. Europe
- 5.5.3. Asia
- 5.5.4. Latin America
- 5.5.5. Middle East and Africa
- 5.1. Market Analysis, Insights and Forecast - by Deployment
- 6. North America Application Security Market Analysis, Insights and Forecast, 2019-2031
- 6.1. Market Analysis, Insights and Forecast - by Deployment
- 6.1.1. On Premise
- 6.1.2. Cloud
- 6.1.3. Hybrid
- 6.2. Market Analysis, Insights and Forecast - by Type
- 6.2.1. Network Security Testing
- 6.2.1.1. VPN Testing
- 6.2.1.2. Firewall Testing
- 6.2.1.3. Other Service Types
- 6.2.2. Application Security Testing
- 6.2.2.1. Application Type
- 6.2.2.1.1. Mobile Application Security Testing
- 6.2.2.1.2. Web Application Security Testing
- 6.2.2.1.3. Cloud Application Security Testing
- 6.2.2.1.4. Enterprise Application Security Testing
- 6.2.2.2. Testing Type
- 6.2.2.2.1. SAST
- 6.2.2.2.2. DAST
- 6.2.2.2.3. IAST
- 6.2.2.2.4. RASP
- 6.2.2.1. Application Type
- 6.2.1. Network Security Testing
- 6.3. Market Analysis, Insights and Forecast - by Testing Tool
- 6.3.1. Web Application Testing Tool
- 6.3.2. Code Review Tool
- 6.3.3. Penetration Testing Tool
- 6.3.4. Software Testing Tool
- 6.3.5. Other Testing Tools
- 6.4. Market Analysis, Insights and Forecast - by End user Industry
- 6.4.1. Government
- 6.4.2. BFSI
- 6.4.3. Healthcare
- 6.4.4. Manufacturing
- 6.4.5. IT and Telecom
- 6.4.6. Retail
- 6.4.7. Other End user Industries
- 6.1. Market Analysis, Insights and Forecast - by Deployment
- 7. Europe Application Security Market Analysis, Insights and Forecast, 2019-2031
- 7.1. Market Analysis, Insights and Forecast - by Deployment
- 7.1.1. On Premise
- 7.1.2. Cloud
- 7.1.3. Hybrid
- 7.2. Market Analysis, Insights and Forecast - by Type
- 7.2.1. Network Security Testing
- 7.2.1.1. VPN Testing
- 7.2.1.2. Firewall Testing
- 7.2.1.3. Other Service Types
- 7.2.2. Application Security Testing
- 7.2.2.1. Application Type
- 7.2.2.1.1. Mobile Application Security Testing
- 7.2.2.1.2. Web Application Security Testing
- 7.2.2.1.3. Cloud Application Security Testing
- 7.2.2.1.4. Enterprise Application Security Testing
- 7.2.2.2. Testing Type
- 7.2.2.2.1. SAST
- 7.2.2.2.2. DAST
- 7.2.2.2.3. IAST
- 7.2.2.2.4. RASP
- 7.2.2.1. Application Type
- 7.2.1. Network Security Testing
- 7.3. Market Analysis, Insights and Forecast - by Testing Tool
- 7.3.1. Web Application Testing Tool
- 7.3.2. Code Review Tool
- 7.3.3. Penetration Testing Tool
- 7.3.4. Software Testing Tool
- 7.3.5. Other Testing Tools
- 7.4. Market Analysis, Insights and Forecast - by End user Industry
- 7.4.1. Government
- 7.4.2. BFSI
- 7.4.3. Healthcare
- 7.4.4. Manufacturing
- 7.4.5. IT and Telecom
- 7.4.6. Retail
- 7.4.7. Other End user Industries
- 7.1. Market Analysis, Insights and Forecast - by Deployment
- 8. Asia Application Security Market Analysis, Insights and Forecast, 2019-2031
- 8.1. Market Analysis, Insights and Forecast - by Deployment
- 8.1.1. On Premise
- 8.1.2. Cloud
- 8.1.3. Hybrid
- 8.2. Market Analysis, Insights and Forecast - by Type
- 8.2.1. Network Security Testing
- 8.2.1.1. VPN Testing
- 8.2.1.2. Firewall Testing
- 8.2.1.3. Other Service Types
- 8.2.2. Application Security Testing
- 8.2.2.1. Application Type
- 8.2.2.1.1. Mobile Application Security Testing
- 8.2.2.1.2. Web Application Security Testing
- 8.2.2.1.3. Cloud Application Security Testing
- 8.2.2.1.4. Enterprise Application Security Testing
- 8.2.2.2. Testing Type
- 8.2.2.2.1. SAST
- 8.2.2.2.2. DAST
- 8.2.2.2.3. IAST
- 8.2.2.2.4. RASP
- 8.2.2.1. Application Type
- 8.2.1. Network Security Testing
- 8.3. Market Analysis, Insights and Forecast - by Testing Tool
- 8.3.1. Web Application Testing Tool
- 8.3.2. Code Review Tool
- 8.3.3. Penetration Testing Tool
- 8.3.4. Software Testing Tool
- 8.3.5. Other Testing Tools
- 8.4. Market Analysis, Insights and Forecast - by End user Industry
- 8.4.1. Government
- 8.4.2. BFSI
- 8.4.3. Healthcare
- 8.4.4. Manufacturing
- 8.4.5. IT and Telecom
- 8.4.6. Retail
- 8.4.7. Other End user Industries
- 8.1. Market Analysis, Insights and Forecast - by Deployment
- 9. Latin America Application Security Market Analysis, Insights and Forecast, 2019-2031
- 9.1. Market Analysis, Insights and Forecast - by Deployment
- 9.1.1. On Premise
- 9.1.2. Cloud
- 9.1.3. Hybrid
- 9.2. Market Analysis, Insights and Forecast - by Type
- 9.2.1. Network Security Testing
- 9.2.1.1. VPN Testing
- 9.2.1.2. Firewall Testing
- 9.2.1.3. Other Service Types
- 9.2.2. Application Security Testing
- 9.2.2.1. Application Type
- 9.2.2.1.1. Mobile Application Security Testing
- 9.2.2.1.2. Web Application Security Testing
- 9.2.2.1.3. Cloud Application Security Testing
- 9.2.2.1.4. Enterprise Application Security Testing
- 9.2.2.2. Testing Type
- 9.2.2.2.1. SAST
- 9.2.2.2.2. DAST
- 9.2.2.2.3. IAST
- 9.2.2.2.4. RASP
- 9.2.2.1. Application Type
- 9.2.1. Network Security Testing
- 9.3. Market Analysis, Insights and Forecast - by Testing Tool
- 9.3.1. Web Application Testing Tool
- 9.3.2. Code Review Tool
- 9.3.3. Penetration Testing Tool
- 9.3.4. Software Testing Tool
- 9.3.5. Other Testing Tools
- 9.4. Market Analysis, Insights and Forecast - by End user Industry
- 9.4.1. Government
- 9.4.2. BFSI
- 9.4.3. Healthcare
- 9.4.4. Manufacturing
- 9.4.5. IT and Telecom
- 9.4.6. Retail
- 9.4.7. Other End user Industries
- 9.1. Market Analysis, Insights and Forecast - by Deployment
- 10. Middle East and Africa Application Security Market Analysis, Insights and Forecast, 2019-2031
- 10.1. Market Analysis, Insights and Forecast - by Deployment
- 10.1.1. On Premise
- 10.1.2. Cloud
- 10.1.3. Hybrid
- 10.2. Market Analysis, Insights and Forecast - by Type
- 10.2.1. Network Security Testing
- 10.2.1.1. VPN Testing
- 10.2.1.2. Firewall Testing
- 10.2.1.3. Other Service Types
- 10.2.2. Application Security Testing
- 10.2.2.1. Application Type
- 10.2.2.1.1. Mobile Application Security Testing
- 10.2.2.1.2. Web Application Security Testing
- 10.2.2.1.3. Cloud Application Security Testing
- 10.2.2.1.4. Enterprise Application Security Testing
- 10.2.2.2. Testing Type
- 10.2.2.2.1. SAST
- 10.2.2.2.2. DAST
- 10.2.2.2.3. IAST
- 10.2.2.2.4. RASP
- 10.2.2.1. Application Type
- 10.2.1. Network Security Testing
- 10.3. Market Analysis, Insights and Forecast - by Testing Tool
- 10.3.1. Web Application Testing Tool
- 10.3.2. Code Review Tool
- 10.3.3. Penetration Testing Tool
- 10.3.4. Software Testing Tool
- 10.3.5. Other Testing Tools
- 10.4. Market Analysis, Insights and Forecast - by End user Industry
- 10.4.1. Government
- 10.4.2. BFSI
- 10.4.3. Healthcare
- 10.4.4. Manufacturing
- 10.4.5. IT and Telecom
- 10.4.6. Retail
- 10.4.7. Other End user Industries
- 10.1. Market Analysis, Insights and Forecast - by Deployment
- 11. North America Application Security Market Analysis, Insights and Forecast, 2019-2031
- 11.1. Market Analysis, Insights and Forecast - By Country/Sub-region
- 11.1.1 United States
- 11.1.2 Canada
- 11.1.3 Mexico
- 12. Europe Application Security Market Analysis, Insights and Forecast, 2019-2031
- 12.1. Market Analysis, Insights and Forecast - By Country/Sub-region
- 12.1.1 Germany
- 12.1.2 United Kingdom
- 12.1.3 France
- 12.1.4 Spain
- 12.1.5 Italy
- 12.1.6 Spain
- 12.1.7 Belgium
- 12.1.8 Netherland
- 12.1.9 Nordics
- 12.1.10 Rest of Europe
- 13. Asia Pacific Application Security Market Analysis, Insights and Forecast, 2019-2031
- 13.1. Market Analysis, Insights and Forecast - By Country/Sub-region
- 13.1.1 China
- 13.1.2 Japan
- 13.1.3 India
- 13.1.4 South Korea
- 13.1.5 Southeast Asia
- 13.1.6 Australia
- 13.1.7 Indonesia
- 13.1.8 Phillipes
- 13.1.9 Singapore
- 13.1.10 Thailandc
- 13.1.11 Rest of Asia Pacific
- 14. South America Application Security Market Analysis, Insights and Forecast, 2019-2031
- 14.1. Market Analysis, Insights and Forecast - By Country/Sub-region
- 14.1.1 Brazil
- 14.1.2 Argentina
- 14.1.3 Peru
- 14.1.4 Chile
- 14.1.5 Colombia
- 14.1.6 Ecuador
- 14.1.7 Venezuela
- 14.1.8 Rest of South America
- 15. North America Application Security Market Analysis, Insights and Forecast, 2019-2031
- 15.1. Market Analysis, Insights and Forecast - By Country/Sub-region
- 15.1.1 United States
- 15.1.2 Canada
- 15.1.3 Mexico
- 16. MEA Application Security Market Analysis, Insights and Forecast, 2019-2031
- 16.1. Market Analysis, Insights and Forecast - By Country/Sub-region
- 16.1.1 United Arab Emirates
- 16.1.2 Saudi Arabia
- 16.1.3 South Africa
- 16.1.4 Rest of Middle East and Africa
- 17. Competitive Analysis
- 17.1. Global Market Share Analysis 2024
- 17.2. Company Profiles
- 17.2.1 iViZ Security Inc
- 17.2.1.1. Overview
- 17.2.1.2. Products
- 17.2.1.3. SWOT Analysis
- 17.2.1.4. Recent Developments
- 17.2.1.5. Financials (Based on Availability)
- 17.2.2 Accenture PLC
- 17.2.2.1. Overview
- 17.2.2.2. Products
- 17.2.2.3. SWOT Analysis
- 17.2.2.4. Recent Developments
- 17.2.2.5. Financials (Based on Availability)
- 17.2.3 Core Security Technologies Inc
- 17.2.3.1. Overview
- 17.2.3.2. Products
- 17.2.3.3. SWOT Analysis
- 17.2.3.4. Recent Developments
- 17.2.3.5. Financials (Based on Availability)
- 17.2.4 IBM Corporation
- 17.2.4.1. Overview
- 17.2.4.2. Products
- 17.2.4.3. SWOT Analysis
- 17.2.4.4. Recent Developments
- 17.2.4.5. Financials (Based on Availability)
- 17.2.5 Applause App Quality Inc
- 17.2.5.1. Overview
- 17.2.5.2. Products
- 17.2.5.3. SWOT Analysis
- 17.2.5.4. Recent Developments
- 17.2.5.5. Financials (Based on Availability)
- 17.2.6 Offensive Security LLC
- 17.2.6.1. Overview
- 17.2.6.2. Products
- 17.2.6.3. SWOT Analysis
- 17.2.6.4. Recent Developments
- 17.2.6.5. Financials (Based on Availability)
- 17.2.7 Veracode Inc
- 17.2.7.1. Overview
- 17.2.7.2. Products
- 17.2.7.3. SWOT Analysis
- 17.2.7.4. Recent Developments
- 17.2.7.5. Financials (Based on Availability)
- 17.2.8 Hewlett Packard Enterprise Company
- 17.2.8.1. Overview
- 17.2.8.2. Products
- 17.2.8.3. SWOT Analysis
- 17.2.8.4. Recent Developments
- 17.2.8.5. Financials (Based on Availability)
- 17.2.9 McAfee LLC
- 17.2.9.1. Overview
- 17.2.9.2. Products
- 17.2.9.3. SWOT Analysis
- 17.2.9.4. Recent Developments
- 17.2.9.5. Financials (Based on Availability)
- 17.2.10 Checkmarx Ltd
- 17.2.10.1. Overview
- 17.2.10.2. Products
- 17.2.10.3. SWOT Analysis
- 17.2.10.4. Recent Developments
- 17.2.10.5. Financials (Based on Availability)
- 17.2.11 Cisco Systems Inc
- 17.2.11.1. Overview
- 17.2.11.2. Products
- 17.2.11.3. SWOT Analysis
- 17.2.11.4. Recent Developments
- 17.2.11.5. Financials (Based on Availability)
- 17.2.12 Maveric Systems Ltd
- 17.2.12.1. Overview
- 17.2.12.2. Products
- 17.2.12.3. SWOT Analysis
- 17.2.12.4. Recent Developments
- 17.2.12.5. Financials (Based on Availability)
- 17.2.13 Paladion Networks Pvt Ltd
- 17.2.13.1. Overview
- 17.2.13.2. Products
- 17.2.13.3. SWOT Analysis
- 17.2.13.4. Recent Developments
- 17.2.13.5. Financials (Based on Availability)
- 17.2.14 ControlCase LLC
- 17.2.14.1. Overview
- 17.2.14.2. Products
- 17.2.14.3. SWOT Analysis
- 17.2.14.4. Recent Developments
- 17.2.14.5. Financials (Based on Availability)
- 17.2.1 iViZ Security Inc
List of Figures
- Figure 1: Global Application Security Market Revenue Breakdown (Million, %) by Region 2024 & 2032
- Figure 2: North America Application Security Market Revenue (Million), by Country 2024 & 2032
- Figure 3: North America Application Security Market Revenue Share (%), by Country 2024 & 2032
- Figure 4: Europe Application Security Market Revenue (Million), by Country 2024 & 2032
- Figure 5: Europe Application Security Market Revenue Share (%), by Country 2024 & 2032
- Figure 6: Asia Pacific Application Security Market Revenue (Million), by Country 2024 & 2032
- Figure 7: Asia Pacific Application Security Market Revenue Share (%), by Country 2024 & 2032
- Figure 8: South America Application Security Market Revenue (Million), by Country 2024 & 2032
- Figure 9: South America Application Security Market Revenue Share (%), by Country 2024 & 2032
- Figure 10: North America Application Security Market Revenue (Million), by Country 2024 & 2032
- Figure 11: North America Application Security Market Revenue Share (%), by Country 2024 & 2032
- Figure 12: MEA Application Security Market Revenue (Million), by Country 2024 & 2032
- Figure 13: MEA Application Security Market Revenue Share (%), by Country 2024 & 2032
- Figure 14: North America Application Security Market Revenue (Million), by Deployment 2024 & 2032
- Figure 15: North America Application Security Market Revenue Share (%), by Deployment 2024 & 2032
- Figure 16: North America Application Security Market Revenue (Million), by Type 2024 & 2032
- Figure 17: North America Application Security Market Revenue Share (%), by Type 2024 & 2032
- Figure 18: North America Application Security Market Revenue (Million), by Testing Tool 2024 & 2032
- Figure 19: North America Application Security Market Revenue Share (%), by Testing Tool 2024 & 2032
- Figure 20: North America Application Security Market Revenue (Million), by End user Industry 2024 & 2032
- Figure 21: North America Application Security Market Revenue Share (%), by End user Industry 2024 & 2032
- Figure 22: North America Application Security Market Revenue (Million), by Country 2024 & 2032
- Figure 23: North America Application Security Market Revenue Share (%), by Country 2024 & 2032
- Figure 24: Europe Application Security Market Revenue (Million), by Deployment 2024 & 2032
- Figure 25: Europe Application Security Market Revenue Share (%), by Deployment 2024 & 2032
- Figure 26: Europe Application Security Market Revenue (Million), by Type 2024 & 2032
- Figure 27: Europe Application Security Market Revenue Share (%), by Type 2024 & 2032
- Figure 28: Europe Application Security Market Revenue (Million), by Testing Tool 2024 & 2032
- Figure 29: Europe Application Security Market Revenue Share (%), by Testing Tool 2024 & 2032
- Figure 30: Europe Application Security Market Revenue (Million), by End user Industry 2024 & 2032
- Figure 31: Europe Application Security Market Revenue Share (%), by End user Industry 2024 & 2032
- Figure 32: Europe Application Security Market Revenue (Million), by Country 2024 & 2032
- Figure 33: Europe Application Security Market Revenue Share (%), by Country 2024 & 2032
- Figure 34: Asia Application Security Market Revenue (Million), by Deployment 2024 & 2032
- Figure 35: Asia Application Security Market Revenue Share (%), by Deployment 2024 & 2032
- Figure 36: Asia Application Security Market Revenue (Million), by Type 2024 & 2032
- Figure 37: Asia Application Security Market Revenue Share (%), by Type 2024 & 2032
- Figure 38: Asia Application Security Market Revenue (Million), by Testing Tool 2024 & 2032
- Figure 39: Asia Application Security Market Revenue Share (%), by Testing Tool 2024 & 2032
- Figure 40: Asia Application Security Market Revenue (Million), by End user Industry 2024 & 2032
- Figure 41: Asia Application Security Market Revenue Share (%), by End user Industry 2024 & 2032
- Figure 42: Asia Application Security Market Revenue (Million), by Country 2024 & 2032
- Figure 43: Asia Application Security Market Revenue Share (%), by Country 2024 & 2032
- Figure 44: Latin America Application Security Market Revenue (Million), by Deployment 2024 & 2032
- Figure 45: Latin America Application Security Market Revenue Share (%), by Deployment 2024 & 2032
- Figure 46: Latin America Application Security Market Revenue (Million), by Type 2024 & 2032
- Figure 47: Latin America Application Security Market Revenue Share (%), by Type 2024 & 2032
- Figure 48: Latin America Application Security Market Revenue (Million), by Testing Tool 2024 & 2032
- Figure 49: Latin America Application Security Market Revenue Share (%), by Testing Tool 2024 & 2032
- Figure 50: Latin America Application Security Market Revenue (Million), by End user Industry 2024 & 2032
- Figure 51: Latin America Application Security Market Revenue Share (%), by End user Industry 2024 & 2032
- Figure 52: Latin America Application Security Market Revenue (Million), by Country 2024 & 2032
- Figure 53: Latin America Application Security Market Revenue Share (%), by Country 2024 & 2032
- Figure 54: Middle East and Africa Application Security Market Revenue (Million), by Deployment 2024 & 2032
- Figure 55: Middle East and Africa Application Security Market Revenue Share (%), by Deployment 2024 & 2032
- Figure 56: Middle East and Africa Application Security Market Revenue (Million), by Type 2024 & 2032
- Figure 57: Middle East and Africa Application Security Market Revenue Share (%), by Type 2024 & 2032
- Figure 58: Middle East and Africa Application Security Market Revenue (Million), by Testing Tool 2024 & 2032
- Figure 59: Middle East and Africa Application Security Market Revenue Share (%), by Testing Tool 2024 & 2032
- Figure 60: Middle East and Africa Application Security Market Revenue (Million), by End user Industry 2024 & 2032
- Figure 61: Middle East and Africa Application Security Market Revenue Share (%), by End user Industry 2024 & 2032
- Figure 62: Middle East and Africa Application Security Market Revenue (Million), by Country 2024 & 2032
- Figure 63: Middle East and Africa Application Security Market Revenue Share (%), by Country 2024 & 2032
List of Tables
- Table 1: Global Application Security Market Revenue Million Forecast, by Region 2019 & 2032
- Table 2: Global Application Security Market Revenue Million Forecast, by Deployment 2019 & 2032
- Table 3: Global Application Security Market Revenue Million Forecast, by Type 2019 & 2032
- Table 4: Global Application Security Market Revenue Million Forecast, by Testing Tool 2019 & 2032
- Table 5: Global Application Security Market Revenue Million Forecast, by End user Industry 2019 & 2032
- Table 6: Global Application Security Market Revenue Million Forecast, by Region 2019 & 2032
- Table 7: Global Application Security Market Revenue Million Forecast, by Country 2019 & 2032
- Table 8: United States Application Security Market Revenue (Million) Forecast, by Application 2019 & 2032
- Table 9: Canada Application Security Market Revenue (Million) Forecast, by Application 2019 & 2032
- Table 10: Mexico Application Security Market Revenue (Million) Forecast, by Application 2019 & 2032
- Table 11: Global Application Security Market Revenue Million Forecast, by Country 2019 & 2032
- Table 12: Germany Application Security Market Revenue (Million) Forecast, by Application 2019 & 2032
- Table 13: United Kingdom Application Security Market Revenue (Million) Forecast, by Application 2019 & 2032
- Table 14: France Application Security Market Revenue (Million) Forecast, by Application 2019 & 2032
- Table 15: Spain Application Security Market Revenue (Million) Forecast, by Application 2019 & 2032
- Table 16: Italy Application Security Market Revenue (Million) Forecast, by Application 2019 & 2032
- Table 17: Spain Application Security Market Revenue (Million) Forecast, by Application 2019 & 2032
- Table 18: Belgium Application Security Market Revenue (Million) Forecast, by Application 2019 & 2032
- Table 19: Netherland Application Security Market Revenue (Million) Forecast, by Application 2019 & 2032
- Table 20: Nordics Application Security Market Revenue (Million) Forecast, by Application 2019 & 2032
- Table 21: Rest of Europe Application Security Market Revenue (Million) Forecast, by Application 2019 & 2032
- Table 22: Global Application Security Market Revenue Million Forecast, by Country 2019 & 2032
- Table 23: China Application Security Market Revenue (Million) Forecast, by Application 2019 & 2032
- Table 24: Japan Application Security Market Revenue (Million) Forecast, by Application 2019 & 2032
- Table 25: India Application Security Market Revenue (Million) Forecast, by Application 2019 & 2032
- Table 26: South Korea Application Security Market Revenue (Million) Forecast, by Application 2019 & 2032
- Table 27: Southeast Asia Application Security Market Revenue (Million) Forecast, by Application 2019 & 2032
- Table 28: Australia Application Security Market Revenue (Million) Forecast, by Application 2019 & 2032
- Table 29: Indonesia Application Security Market Revenue (Million) Forecast, by Application 2019 & 2032
- Table 30: Phillipes Application Security Market Revenue (Million) Forecast, by Application 2019 & 2032
- Table 31: Singapore Application Security Market Revenue (Million) Forecast, by Application 2019 & 2032
- Table 32: Thailandc Application Security Market Revenue (Million) Forecast, by Application 2019 & 2032
- Table 33: Rest of Asia Pacific Application Security Market Revenue (Million) Forecast, by Application 2019 & 2032
- Table 34: Global Application Security Market Revenue Million Forecast, by Country 2019 & 2032
- Table 35: Brazil Application Security Market Revenue (Million) Forecast, by Application 2019 & 2032
- Table 36: Argentina Application Security Market Revenue (Million) Forecast, by Application 2019 & 2032
- Table 37: Peru Application Security Market Revenue (Million) Forecast, by Application 2019 & 2032
- Table 38: Chile Application Security Market Revenue (Million) Forecast, by Application 2019 & 2032
- Table 39: Colombia Application Security Market Revenue (Million) Forecast, by Application 2019 & 2032
- Table 40: Ecuador Application Security Market Revenue (Million) Forecast, by Application 2019 & 2032
- Table 41: Venezuela Application Security Market Revenue (Million) Forecast, by Application 2019 & 2032
- Table 42: Rest of South America Application Security Market Revenue (Million) Forecast, by Application 2019 & 2032
- Table 43: Global Application Security Market Revenue Million Forecast, by Country 2019 & 2032
- Table 44: United States Application Security Market Revenue (Million) Forecast, by Application 2019 & 2032
- Table 45: Canada Application Security Market Revenue (Million) Forecast, by Application 2019 & 2032
- Table 46: Mexico Application Security Market Revenue (Million) Forecast, by Application 2019 & 2032
- Table 47: Global Application Security Market Revenue Million Forecast, by Country 2019 & 2032
- Table 48: United Arab Emirates Application Security Market Revenue (Million) Forecast, by Application 2019 & 2032
- Table 49: Saudi Arabia Application Security Market Revenue (Million) Forecast, by Application 2019 & 2032
- Table 50: South Africa Application Security Market Revenue (Million) Forecast, by Application 2019 & 2032
- Table 51: Rest of Middle East and Africa Application Security Market Revenue (Million) Forecast, by Application 2019 & 2032
- Table 52: Global Application Security Market Revenue Million Forecast, by Deployment 2019 & 2032
- Table 53: Global Application Security Market Revenue Million Forecast, by Type 2019 & 2032
- Table 54: Global Application Security Market Revenue Million Forecast, by Testing Tool 2019 & 2032
- Table 55: Global Application Security Market Revenue Million Forecast, by End user Industry 2019 & 2032
- Table 56: Global Application Security Market Revenue Million Forecast, by Country 2019 & 2032
- Table 57: Global Application Security Market Revenue Million Forecast, by Deployment 2019 & 2032
- Table 58: Global Application Security Market Revenue Million Forecast, by Type 2019 & 2032
- Table 59: Global Application Security Market Revenue Million Forecast, by Testing Tool 2019 & 2032
- Table 60: Global Application Security Market Revenue Million Forecast, by End user Industry 2019 & 2032
- Table 61: Global Application Security Market Revenue Million Forecast, by Country 2019 & 2032
- Table 62: Global Application Security Market Revenue Million Forecast, by Deployment 2019 & 2032
- Table 63: Global Application Security Market Revenue Million Forecast, by Type 2019 & 2032
- Table 64: Global Application Security Market Revenue Million Forecast, by Testing Tool 2019 & 2032
- Table 65: Global Application Security Market Revenue Million Forecast, by End user Industry 2019 & 2032
- Table 66: Global Application Security Market Revenue Million Forecast, by Country 2019 & 2032
- Table 67: Global Application Security Market Revenue Million Forecast, by Deployment 2019 & 2032
- Table 68: Global Application Security Market Revenue Million Forecast, by Type 2019 & 2032
- Table 69: Global Application Security Market Revenue Million Forecast, by Testing Tool 2019 & 2032
- Table 70: Global Application Security Market Revenue Million Forecast, by End user Industry 2019 & 2032
- Table 71: Global Application Security Market Revenue Million Forecast, by Country 2019 & 2032
- Table 72: Global Application Security Market Revenue Million Forecast, by Deployment 2019 & 2032
- Table 73: Global Application Security Market Revenue Million Forecast, by Type 2019 & 2032
- Table 74: Global Application Security Market Revenue Million Forecast, by Testing Tool 2019 & 2032
- Table 75: Global Application Security Market Revenue Million Forecast, by End user Industry 2019 & 2032
- Table 76: Global Application Security Market Revenue Million Forecast, by Country 2019 & 2032
Frequently Asked Questions
1. What is the projected Compound Annual Growth Rate (CAGR) of the Application Security Market?
The projected CAGR is approximately 26.76%.
2. Which companies are prominent players in the Application Security Market?
Key companies in the market include iViZ Security Inc, Accenture PLC, Core Security Technologies Inc, IBM Corporation, Applause App Quality Inc, Offensive Security LLC, Veracode Inc, Hewlett Packard Enterprise Company, McAfee LLC, Checkmarx Ltd, Cisco Systems Inc, Maveric Systems Ltd, Paladion Networks Pvt Ltd, ControlCase LLC.
3. What are the main segments of the Application Security Market?
The market segments include Deployment, Type, Testing Tool, End user Industry.
4. Can you provide details about the market size?
The market size is estimated to be USD XX Million as of 2022.
5. What are some drivers contributing to market growth?
Increasing Security Threats; Government Regulations Driving Security Needs.
6. What are the notable trends driving market growth?
Cloud Segment to Gain Significant Importance over the Forecast Period.
7. Are there any restraints impacting market growth?
Lack of Awareness About Security Testing.
8. Can you provide examples of recent developments in the market?
July 2023: Hewlett Packard Enterprise has announced that Fastweb S.p.A, one of the leading telecom operators in Italy, has selected the HPE Green Lake edge-to-cloud platform, the market-leading cloud services platform from Hewlett Packard Enterprise (HPE) to modernize its Fastcloud Business Unit to accelerate new service deployment and improve agility. The new platform also enhances governance, security, and operations with improved visibility of utilization and costs.
9. What pricing options are available for accessing the report?
Pricing options include single-user, multi-user, and enterprise licenses priced at USD 4750, USD 5250, and USD 8750 respectively.
10. Is the market size provided in terms of value or volume?
The market size is provided in terms of value, measured in Million.
11. Are there any specific market keywords associated with the report?
Yes, the market keyword associated with the report is "Application Security Market," which aids in identifying and referencing the specific market segment covered.
12. How do I determine which pricing option suits my needs best?
The pricing options vary based on user requirements and access needs. Individual users may opt for single-user licenses, while businesses requiring broader access may choose multi-user or enterprise licenses for cost-effective access to the report.
13. Are there any additional resources or data provided in the Application Security Market report?
While the report offers comprehensive insights, it's advisable to review the specific contents or supplementary materials provided to ascertain if additional resources or data are available.
14. How can I stay updated on further developments or reports in the Application Security Market?
To stay informed about further developments, trends, and reports in the Application Security Market, consider subscribing to industry newsletters, following relevant companies and organizations, or regularly checking reputable industry news sources and publications.
Methodology
Step 1 - Identification of Relevant Samples Size from Population Database


Step 2 - Approaches for Defining Global Market Size (Value, Volume* & Price*)

Note*: In applicable scenarios
Step 3 - Data Sources
Primary Research
- Web Analytics
- Survey Reports
- Research Institute
- Latest Research Reports
- Opinion Leaders
Secondary Research
- Annual Reports
- White Paper
- Latest Press Release
- Industry Association
- Paid Database
- Investor Presentations

Step 4 - Data Triangulation
Involves using different sources of information in order to increase the validity of a study
These sources are likely to be stakeholders in a program - participants, other researchers, program staff, other community members, and so on.
Then we put all data in single framework & apply various statistical tools to find out the dynamic on the market.
During the analysis stage, feedback from the stakeholder groups would be compared to determine areas of agreement as well as areas of divergence


