

Key Insights
The online board game sector is poised for substantial expansion, driven by amplified internet access, the pervasive appeal of mobile gaming, and a growing consumer appetite for digital entertainment. The market, estimated at $15.82 billion in 2025, is projected to experience a Compound Annual Growth Rate (CAGR) of 10.58%. This robust growth is underpinned by several critical drivers. The inherent convenience and global accessibility of online platforms facilitate social interaction and community building, expanding the player base significantly. Furthermore, the integration of cutting-edge features, including immersive virtual reality experiences and sophisticated social engagement tools, continuously elevates the player experience and attracts new demographics. The rapid advancement of mobile gaming technology also enhances accessibility and user-friendliness, with developers optimizing online board games for a wide array of devices. The diverse spectrum of game genres, from strategic classics to modern interpretations, further broadens the market's appeal.
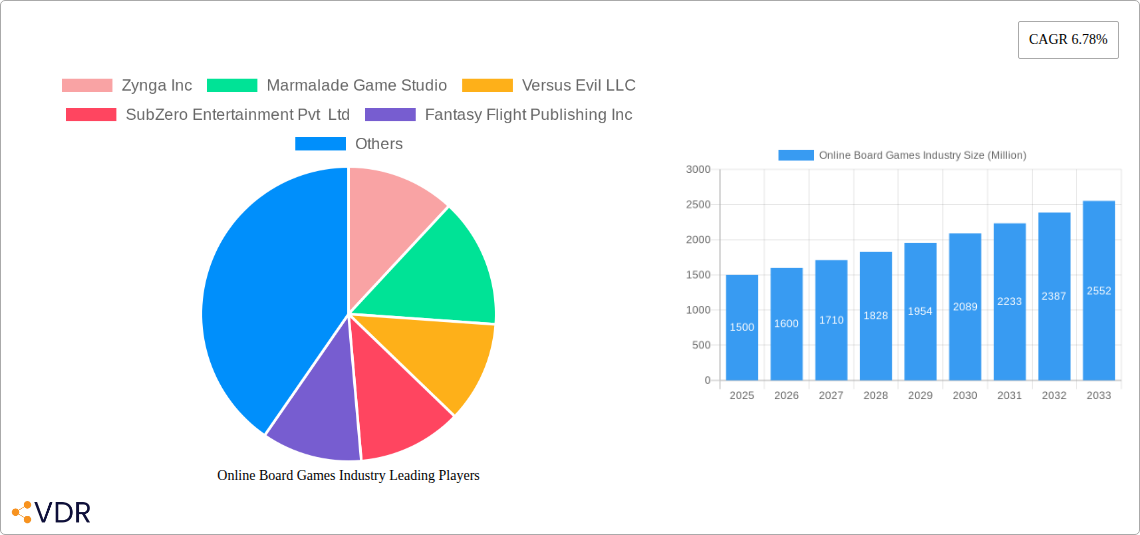
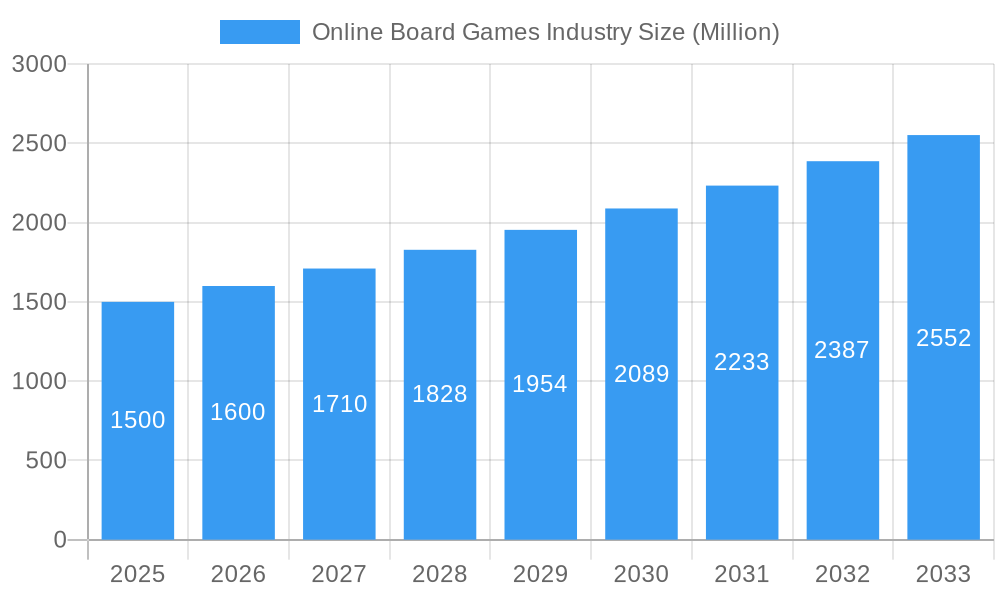
Online Board Games Industry Market Size (In Billion)
Despite this positive outlook, the market encounters challenges. Intensifying competition among developers and publishers mandates continuous innovation and superior content to secure market share. Additionally, responsible management of in-app purchases and the potential for addictive gameplay are crucial for sustainable growth and maintaining a healthy gaming ecosystem. Market segmentation by revenue models, including advertising, in-app purchases, and premium app sales, reveals distinct monetization strategies and potential niche opportunities. Companies that effectively balance revenue generation with player engagement, delivering compelling value without alienating users, are best positioned for success. Emerging markets, particularly the Asia-Pacific region, offer significant expansion potential due to substantial populations and increasing internet penetration.
Online Board Games Industry Company Market Share
Online Board Games Industry: Market Report 2019-2033
This comprehensive report provides an in-depth analysis of the online board games industry, encompassing market dynamics, growth trends, regional performance, and key players. With a study period spanning 2019-2033, a base year of 2025, and a forecast period of 2025-2033, this report offers invaluable insights for industry professionals, investors, and strategic decision-makers. The report covers both the parent market of online gaming and the child market of online board games, providing a holistic view of market segmentation (By Type: Advertising, In-App Purchase, App Purchase) and its evolution.
Online Board Games Industry Market Dynamics & Structure
The online board games market exhibits a dynamic interplay of factors shaping its structure and growth. Market concentration is moderate, with several prominent players vying for market share, while a significant portion of the market is occupied by smaller, niche developers. Technological advancements, especially in mobile gaming technology and social features, are key innovation drivers. Regulatory frameworks vary across jurisdictions, impacting monetization strategies and data privacy compliance. Competitive substitutes include other online games and entertainment options, highlighting the need for continuous innovation and engagement. End-user demographics are diverse, spanning age groups and gaming preferences, necessitating targeted marketing strategies. Mergers and acquisitions (M&A) activity is relatively active, with larger companies consolidating their market positions and expanding their portfolios.
- Market Concentration: Moderate, with a mix of large and small players. Top 5 players hold approximately xx% market share (2024).
- Technological Innovation: Mobile gaming technology, social features, AI integration, cross-platform compatibility.
- Regulatory Frameworks: Data privacy, age ratings, monetization regulations impacting market accessibility in various regions.
- Competitive Substitutes: Other online games, streaming services, social media.
- End-User Demographics: Diverse, spanning ages, gaming experience levels, and preferences.
- M&A Trends: xx M&A deals in the online gaming sector (2019-2024), with increasing strategic acquisitions observed in recent years.
Online Board Games Industry Growth Trends & Insights
The online board games market experienced significant growth during the historical period (2019-2024), driven by increased smartphone penetration, improved internet access, and the rising popularity of casual gaming. The market size expanded from xx million units in 2019 to xx million units in 2024, registering a CAGR of xx%. Technological disruptions, such as the rise of mobile gaming and social features, profoundly impacted adoption rates and consumer behavior. The shift towards casual, readily accessible games influenced the development of shorter, more streamlined online board games. This trend is expected to continue, with a projected CAGR of xx% during the forecast period (2025-2033), reaching an estimated market size of xx million units by 2033. Market penetration, particularly in developing economies with rapidly expanding internet access, remains a significant growth driver.
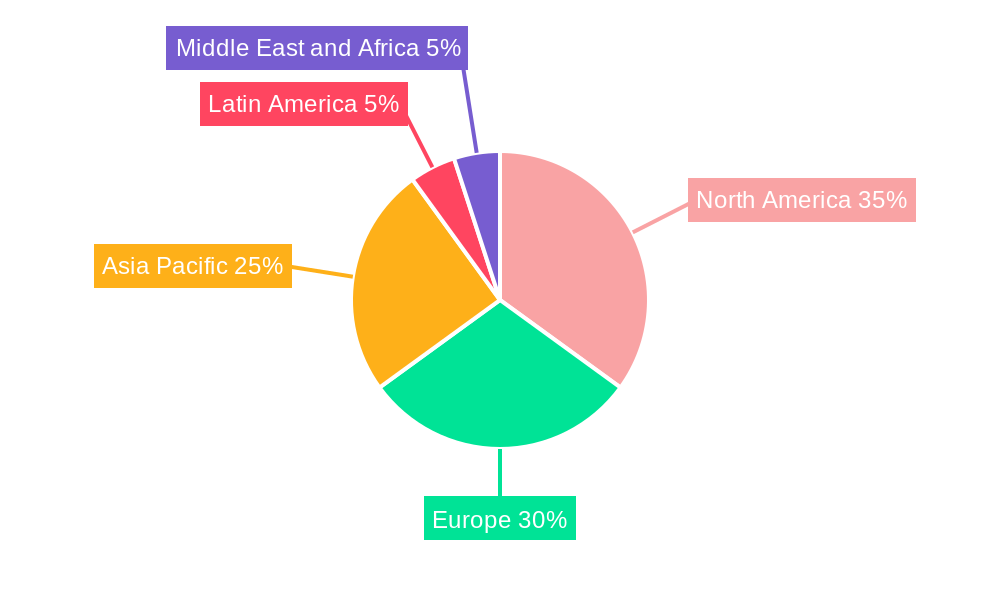
Dominant Regions, Countries, or Segments in Online Board Games Industry
North America currently holds the largest market share in the online board games industry, driven by high internet penetration, strong consumer spending power, and a well-established gaming culture. However, the Asia-Pacific region demonstrates remarkable growth potential, fuelled by rapid smartphone adoption, increasing internet usage, and a large, young population. Within the segment breakdown, In-App Purchases currently contribute the largest revenue share (xx%), followed by Advertising (xx%) and App Purchases (xx%). This dominance is attributed to the freemium model’s success in engaging a broader player base and generating recurring revenue.
- North America: High internet penetration, strong consumer spending, established gaming culture.
- Asia-Pacific: Rapid smartphone adoption, increasing internet access, large young population.
- In-App Purchases: Dominant monetization strategy leveraging freemium models.
- Advertising: Growing revenue segment, attracting gamers through targeted ads.
- App Purchases: Niche segment catering to premium games and one-time purchases.
Online Board Games Industry Product Landscape
The online board games market showcases a diverse range of products, from classic adaptations to innovative original titles. These games utilize various monetization models, including freemium (in-app purchases), premium purchases, and advertising. Technological advancements, such as enhanced graphics, realistic game mechanics, and seamless social integration, significantly enhance the gaming experience. Unique selling propositions include cross-platform compatibility, engaging narratives, and competitive multiplayer modes.
Key Drivers, Barriers & Challenges in Online Board Games Industry
Key Drivers: Increased smartphone penetration and internet access, rising popularity of casual gaming, technological advancements enhancing gaming experience, and innovative game designs captivating new audiences.
Key Barriers & Challenges: Intense competition among developers, reliance on in-app purchases creating potential for negative user perception, regulatory challenges concerning data privacy and age ratings, and piracy and unauthorized distribution impacting revenue. These challenges contribute to xx% revenue loss annually (estimated).
Emerging Opportunities in Online Board Games Industry
Emerging opportunities include the integration of virtual reality (VR) and augmented reality (AR) technologies, exploring new monetization strategies, expanding into untapped markets (e.g., emerging economies), and leveraging esports and competitive gaming aspects to enhance engagement. Personalized game experiences catering to individual preferences, also hold significant potential.
Growth Accelerators in the Online Board Games Industry Industry
Strategic partnerships between game developers and intellectual property holders can unlock access to established franchises and boost brand recognition. Technological innovation, including AI-powered game AI and improved cross-platform compatibility, are crucial for attracting a broader audience and enhancing engagement. Expansion into emerging markets and new platforms (e.g., VR/AR) are also critical for driving long-term growth.
Key Players Shaping the Online Board Games Industry Market
- Zynga Inc
- Marmalade Game Studio
- Versus Evil LLC
- SubZero Entertainment Pvt Ltd
- Fantasy Flight Publishing Inc
- GungHo Online Entertainment Inc ( SoftBank Group)
- Tencent Holdings Limited
- Chess.com
- Nintendo Co Ltd
- Handelabra Games
- Czech Games Edition
- Asmodee Digital
- Hurrican Edition SA
Notable Milestones in Online Board Games Industry Sector
- June 2022: Zynga Inc. launched "Clubs" in Words With Friends 2, enhancing social interaction.
- June 2022: Hasbro partnered with the New York Times to create "Wordle: The Party Game," capitalizing on Wordle's popularity.
In-Depth Online Board Games Industry Market Outlook
The online board games industry is poised for sustained growth, driven by technological advancements, innovative game designs, and expansion into new markets. Strategic partnerships and targeted marketing initiatives will be crucial for capitalizing on the increasing demand for engaging and accessible online gaming experiences. The market’s future potential lies in seamlessly integrating new technologies, fostering a strong community, and delivering high-quality, innovative gameplay.
Online Board Games Industry Segmentation
-
1. Type
- 1.1. Advertising
- 1.2. In-App Purchase
Online Board Games Industry Segmentation By Geography
-
1. North America
- 1.1. United States
- 1.2. Canada
-
2. Europe
- 2.1. United Kingdom
- 2.2. Germany
- 2.3. Spain
- 2.4. France
- 2.5. Rest of Europe
-
3. Asia Pacific
- 3.1. China
- 3.2. India
- 3.3. Japan
- 3.4. South Korea
- 3.5. Rest of Asia Pacific
-
4. Latin America
- 4.1. Brazil
- 4.2. Mexico
-
5. Middle East and Africa
- 5.1. Saudi Arabia
- 5.2. South Africa
- 5.3. Nigeria
Online Board Games Industry Regional Market Share
Geographic Coverage of Online Board Games Industry
Online Board Games Industry REPORT HIGHLIGHTS
| Aspects | Details |
|---|---|
| Study Period | 2020-2034 |
| Base Year | 2025 |
| Estimated Year | 2026 |
| Forecast Period | 2026-2034 |
| Historical Period | 2020-2025 |
| Growth Rate | CAGR of 10.58% from 2020-2034 |
| Segmentation |
|
Table of Contents
- 1. Introduction
- 1.1. Research Scope
- 1.2. Market Segmentation
- 1.3. Research Objective
- 1.4. Definitions and Assumptions
- 2. Executive Summary
- 2.1. Market Snapshot
- 3. Market Dynamics
- 3.1. Market Drivers
- 3.2. Market Restrains
- 3.3. Market Trends
- 3.4. Market Opportunities
- 4. Market Factor Analysis
- 4.1. Porters Five Forces
- 4.1.1. Bargaining Power of Suppliers
- 4.1.2. Bargaining Power of Buyers
- 4.1.3. Threat of New Entrants
- 4.1.4. Threat of Substitutes
- 4.1.5. Competitive Rivalry
- 4.2. PESTEL analysis
- 4.3. BCG Analysis
- 4.3.1. Stars (High Growth, High Market Share)
- 4.3.2. Cash Cows (Low Growth, High Market Share)
- 4.3.3. Question Mark (High Growth, Low Market Share)
- 4.3.4. Dogs (Low Growth, Low Market Share)
- 4.4. Ansoff Matrix Analysis
- 4.5. Supply Chain Analysis
- 4.6. Regulatory Landscape
- 4.7. Current Market Potential and Opportunity Assessment (TAM–SAM–SOM Framework)
- 4.8. VDR Analyst Note
- 4.1. Porters Five Forces
- 5. Market Analysis, Insights and Forecast 2021-2033
- 5.1. Market Analysis, Insights and Forecast - by Type
- 5.1.1. Advertising
- 5.1.2. In-App Purchase
- 5.2. Market Analysis, Insights and Forecast - by Region
- 5.2.1. North America
- 5.2.2. Europe
- 5.2.3. Asia Pacific
- 5.2.4. Latin America
- 5.2.5. Middle East and Africa
- 5.1. Market Analysis, Insights and Forecast - by Type
- 6. Global Online Board Games Industry Analysis, Insights and Forecast, 2021-2033
- 6.1. Market Analysis, Insights and Forecast - by Type
- 6.1.1. Advertising
- 6.1.2. In-App Purchase
- 6.1. Market Analysis, Insights and Forecast - by Type
- 7. North America Online Board Games Industry Analysis, Insights and Forecast, 2021-2033
- 7.1. Market Analysis, Insights and Forecast - by Type
- 7.1.1. Advertising
- 7.1.2. In-App Purchase
- 7.1. Market Analysis, Insights and Forecast - by Type
- 8. Europe Online Board Games Industry Analysis, Insights and Forecast, 2021-2033
- 8.1. Market Analysis, Insights and Forecast - by Type
- 8.1.1. Advertising
- 8.1.2. In-App Purchase
- 8.1. Market Analysis, Insights and Forecast - by Type
- 9. Asia Pacific Online Board Games Industry Analysis, Insights and Forecast, 2021-2033
- 9.1. Market Analysis, Insights and Forecast - by Type
- 9.1.1. Advertising
- 9.1.2. In-App Purchase
- 9.1. Market Analysis, Insights and Forecast - by Type
- 10. Latin America Online Board Games Industry Analysis, Insights and Forecast, 2021-2033
- 10.1. Market Analysis, Insights and Forecast - by Type
- 10.1.1. Advertising
- 10.1.2. In-App Purchase
- 10.1. Market Analysis, Insights and Forecast - by Type
- 11. Middle East and Africa Online Board Games Industry Analysis, Insights and Forecast, 2021-2033
- 11.1. Market Analysis, Insights and Forecast - by Type
- 11.1.1. Advertising
- 11.1.2. In-App Purchase
- 11.1. Market Analysis, Insights and Forecast - by Type
- 12. Competitive Analysis
- 12.1. Company Profiles
- 12.1.1 Zynga Inc
- 12.1.1.1. Company Overview
- 12.1.1.2. Products
- 12.1.1.3. Company Financials
- 12.1.1.4. SWOT Analysis
- 12.1.2 Marmalade Game Studio
- 12.1.2.1. Company Overview
- 12.1.2.2. Products
- 12.1.2.3. Company Financials
- 12.1.2.4. SWOT Analysis
- 12.1.3 Versus Evil LLC
- 12.1.3.1. Company Overview
- 12.1.3.2. Products
- 12.1.3.3. Company Financials
- 12.1.3.4. SWOT Analysis
- 12.1.4 SubZero Entertainment Pvt Ltd
- 12.1.4.1. Company Overview
- 12.1.4.2. Products
- 12.1.4.3. Company Financials
- 12.1.4.4. SWOT Analysis
- 12.1.5 Fantasy Flight Publishing Inc
- 12.1.5.1. Company Overview
- 12.1.5.2. Products
- 12.1.5.3. Company Financials
- 12.1.5.4. SWOT Analysis
- 12.1.6 GungHo Online Entertainment Inc ( SoftBank Group)
- 12.1.6.1. Company Overview
- 12.1.6.2. Products
- 12.1.6.3. Company Financials
- 12.1.6.4. SWOT Analysis
- 12.1.7 Tencent Holdings Limited
- 12.1.7.1. Company Overview
- 12.1.7.2. Products
- 12.1.7.3. Company Financials
- 12.1.7.4. SWOT Analysis
- 12.1.8 Chess com*List Not Exhaustive
- 12.1.8.1. Company Overview
- 12.1.8.2. Products
- 12.1.8.3. Company Financials
- 12.1.8.4. SWOT Analysis
- 12.1.9 Nintendo Co Ltd
- 12.1.9.1. Company Overview
- 12.1.9.2. Products
- 12.1.9.3. Company Financials
- 12.1.9.4. SWOT Analysis
- 12.1.10 Handelabra Games
- 12.1.10.1. Company Overview
- 12.1.10.2. Products
- 12.1.10.3. Company Financials
- 12.1.10.4. SWOT Analysis
- 12.1.11 Czech Games Edition
- 12.1.11.1. Company Overview
- 12.1.11.2. Products
- 12.1.11.3. Company Financials
- 12.1.11.4. SWOT Analysis
- 12.1.12 Asmodee Digital
- 12.1.12.1. Company Overview
- 12.1.12.2. Products
- 12.1.12.3. Company Financials
- 12.1.12.4. SWOT Analysis
- 12.1.13 Hurrican Edition SA
- 12.1.13.1. Company Overview
- 12.1.13.2. Products
- 12.1.13.3. Company Financials
- 12.1.13.4. SWOT Analysis
- 12.1.1 Zynga Inc
- 12.2. Market Entropy
- 12.2.1 Company's Key Areas Served
- 12.2.2 Recent Developments
- 12.3. Company Market Share Analysis 2025
- 12.3.1 Top 5 Companies Market Share Analysis
- 12.3.2 Top 3 Companies Market Share Analysis
- 12.4. List of Potential Customers
- 13. Research Methodology
List of Figures
- Figure 1: Global Online Board Games Industry Revenue Breakdown (billion, %) by Region 2025 & 2033
- Figure 2: North America Online Board Games Industry Revenue (billion), by Type 2025 & 2033
- Figure 3: North America Online Board Games Industry Revenue Share (%), by Type 2025 & 2033
- Figure 4: North America Online Board Games Industry Revenue (billion), by Country 2025 & 2033
- Figure 5: North America Online Board Games Industry Revenue Share (%), by Country 2025 & 2033
- Figure 6: Europe Online Board Games Industry Revenue (billion), by Type 2025 & 2033
- Figure 7: Europe Online Board Games Industry Revenue Share (%), by Type 2025 & 2033
- Figure 8: Europe Online Board Games Industry Revenue (billion), by Country 2025 & 2033
- Figure 9: Europe Online Board Games Industry Revenue Share (%), by Country 2025 & 2033
- Figure 10: Asia Pacific Online Board Games Industry Revenue (billion), by Type 2025 & 2033
- Figure 11: Asia Pacific Online Board Games Industry Revenue Share (%), by Type 2025 & 2033
- Figure 12: Asia Pacific Online Board Games Industry Revenue (billion), by Country 2025 & 2033
- Figure 13: Asia Pacific Online Board Games Industry Revenue Share (%), by Country 2025 & 2033
- Figure 14: Latin America Online Board Games Industry Revenue (billion), by Type 2025 & 2033
- Figure 15: Latin America Online Board Games Industry Revenue Share (%), by Type 2025 & 2033
- Figure 16: Latin America Online Board Games Industry Revenue (billion), by Country 2025 & 2033
- Figure 17: Latin America Online Board Games Industry Revenue Share (%), by Country 2025 & 2033
- Figure 18: Middle East and Africa Online Board Games Industry Revenue (billion), by Type 2025 & 2033
- Figure 19: Middle East and Africa Online Board Games Industry Revenue Share (%), by Type 2025 & 2033
- Figure 20: Middle East and Africa Online Board Games Industry Revenue (billion), by Country 2025 & 2033
- Figure 21: Middle East and Africa Online Board Games Industry Revenue Share (%), by Country 2025 & 2033
List of Tables
- Table 1: Global Online Board Games Industry Revenue billion Forecast, by Type 2020 & 2033
- Table 2: Global Online Board Games Industry Revenue billion Forecast, by Region 2020 & 2033
- Table 3: Global Online Board Games Industry Revenue billion Forecast, by Type 2020 & 2033
- Table 4: Global Online Board Games Industry Revenue billion Forecast, by Country 2020 & 2033
- Table 5: United States Online Board Games Industry Revenue (billion) Forecast, by Application 2020 & 2033
- Table 6: Canada Online Board Games Industry Revenue (billion) Forecast, by Application 2020 & 2033
- Table 7: Global Online Board Games Industry Revenue billion Forecast, by Type 2020 & 2033
- Table 8: Global Online Board Games Industry Revenue billion Forecast, by Country 2020 & 2033
- Table 9: United Kingdom Online Board Games Industry Revenue (billion) Forecast, by Application 2020 & 2033
- Table 10: Germany Online Board Games Industry Revenue (billion) Forecast, by Application 2020 & 2033
- Table 11: Spain Online Board Games Industry Revenue (billion) Forecast, by Application 2020 & 2033
- Table 12: France Online Board Games Industry Revenue (billion) Forecast, by Application 2020 & 2033
- Table 13: Rest of Europe Online Board Games Industry Revenue (billion) Forecast, by Application 2020 & 2033
- Table 14: Global Online Board Games Industry Revenue billion Forecast, by Type 2020 & 2033
- Table 15: Global Online Board Games Industry Revenue billion Forecast, by Country 2020 & 2033
- Table 16: China Online Board Games Industry Revenue (billion) Forecast, by Application 2020 & 2033
- Table 17: India Online Board Games Industry Revenue (billion) Forecast, by Application 2020 & 2033
- Table 18: Japan Online Board Games Industry Revenue (billion) Forecast, by Application 2020 & 2033
- Table 19: South Korea Online Board Games Industry Revenue (billion) Forecast, by Application 2020 & 2033
- Table 20: Rest of Asia Pacific Online Board Games Industry Revenue (billion) Forecast, by Application 2020 & 2033
- Table 21: Global Online Board Games Industry Revenue billion Forecast, by Type 2020 & 2033
- Table 22: Global Online Board Games Industry Revenue billion Forecast, by Country 2020 & 2033
- Table 23: Brazil Online Board Games Industry Revenue (billion) Forecast, by Application 2020 & 2033
- Table 24: Mexico Online Board Games Industry Revenue (billion) Forecast, by Application 2020 & 2033
- Table 25: Global Online Board Games Industry Revenue billion Forecast, by Type 2020 & 2033
- Table 26: Global Online Board Games Industry Revenue billion Forecast, by Country 2020 & 2033
- Table 27: Saudi Arabia Online Board Games Industry Revenue (billion) Forecast, by Application 2020 & 2033
- Table 28: South Africa Online Board Games Industry Revenue (billion) Forecast, by Application 2020 & 2033
- Table 29: Nigeria Online Board Games Industry Revenue (billion) Forecast, by Application 2020 & 2033
Frequently Asked Questions
1. What is the projected Compound Annual Growth Rate (CAGR) of the Online Board Games Industry?
The projected CAGR is approximately 10.58%.
2. Which companies are prominent players in the Online Board Games Industry?
Key companies in the market include Zynga Inc, Marmalade Game Studio, Versus Evil LLC, SubZero Entertainment Pvt Ltd, Fantasy Flight Publishing Inc, GungHo Online Entertainment Inc ( SoftBank Group), Tencent Holdings Limited, Chess com*List Not Exhaustive, Nintendo Co Ltd, Handelabra Games, Czech Games Edition, Asmodee Digital, Hurrican Edition SA.
3. What are the main segments of the Online Board Games Industry?
The market segments include Type.
4. Can you provide details about the market size?
The market size is estimated to be USD 15.82 billion as of 2022.
5. What are some drivers contributing to market growth?
Growing Internet penetration; Increasing Users of Smartphones.
6. What are the notable trends driving market growth?
Increasing Users of Smartphones.
7. Are there any restraints impacting market growth?
High complexity in designing and manufacturing emerging non-volatile memory devices.
8. Can you provide examples of recent developments in the market?
June 2022: Zynga Inc., a wholly-owned brand label of Take-Two Interactive, announced that Words With Friends 2 is introducing Clubs. This new feature expands the word game's social experience by offering shared spaces that players use together.
9. What pricing options are available for accessing the report?
Pricing options include single-user, multi-user, and enterprise licenses priced at USD 4750, USD 5250, and USD 8750 respectively.
10. Is the market size provided in terms of value or volume?
The market size is provided in terms of value, measured in billion.
11. Are there any specific market keywords associated with the report?
Yes, the market keyword associated with the report is "Online Board Games Industry," which aids in identifying and referencing the specific market segment covered.
12. How do I determine which pricing option suits my needs best?
The pricing options vary based on user requirements and access needs. Individual users may opt for single-user licenses, while businesses requiring broader access may choose multi-user or enterprise licenses for cost-effective access to the report.
13. Are there any additional resources or data provided in the Online Board Games Industry report?
While the report offers comprehensive insights, it's advisable to review the specific contents or supplementary materials provided to ascertain if additional resources or data are available.
14. How can I stay updated on further developments or reports in the Online Board Games Industry?
To stay informed about further developments, trends, and reports in the Online Board Games Industry, consider subscribing to industry newsletters, following relevant companies and organizations, or regularly checking reputable industry news sources and publications.
Methodology
Step 1 - Identification of Relevant Samples Size from Population Database


Step 2 - Approaches for Defining Global Market Size (Value, Volume* & Price*)

Note*: In applicable scenarios
Step 3 - Data Sources
Primary Research
- Web Analytics
- Survey Reports
- Research Institute
- Latest Research Reports
- Opinion Leaders
Secondary Research
- Annual Reports
- White Paper
- Latest Press Release
- Industry Association
- Paid Database
- Investor Presentations

Step 4 - Data Triangulation
Involves using different sources of information in order to increase the validity of a study
These sources are likely to be stakeholders in a program - participants, other researchers, program staff, other community members, and so on.
Then we put all data in single framework & apply various statistical tools to find out the dynamic on the market.
During the analysis stage, feedback from the stakeholder groups would be compared to determine areas of agreement as well as areas of divergence