

Key Insights
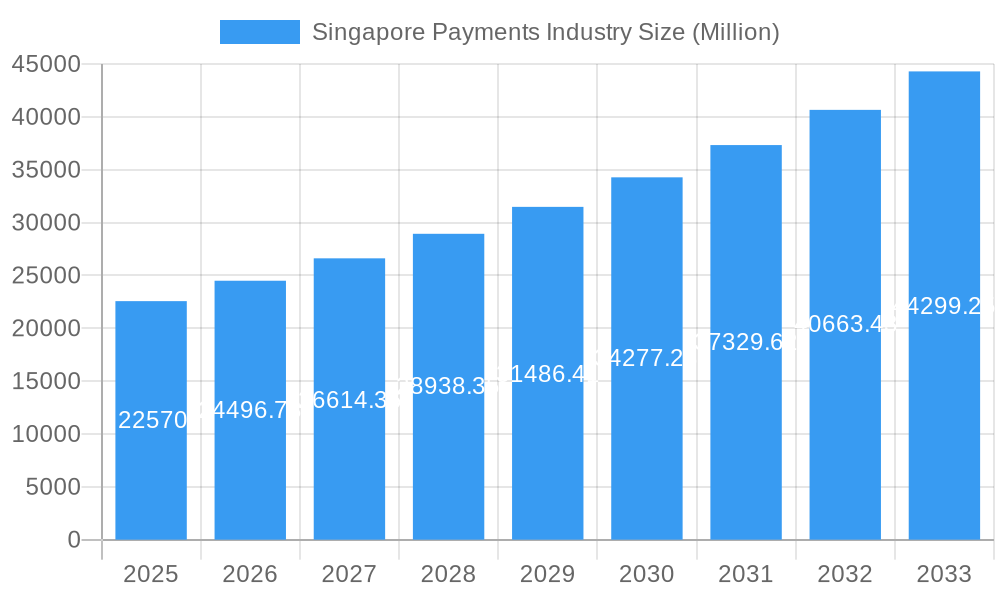
The Singapore payments industry, valued at $22.57 billion in 2025, is projected to experience robust growth, driven by a Compound Annual Growth Rate (CAGR) of 8.74% from 2025 to 2033. This expansion is fueled by several key factors. The rising adoption of e-commerce and digital wallets, coupled with increasing smartphone penetration and a government push towards a cashless society, are significantly boosting the demand for convenient and secure payment solutions. Furthermore, the growth of fintech companies offering innovative payment technologies and services, such as mobile payment apps and Buy Now Pay Later (BNPL) options, is disrupting the traditional banking landscape and fostering competition. Specific industry segments, like retail and entertainment, are showing particularly strong growth, as consumers increasingly prefer contactless payments and digital transactions for their daily purchases and entertainment experiences. While the industry faces certain challenges, such as addressing cybersecurity concerns and maintaining data privacy, the overall outlook remains extremely positive. Growth is expected across all payment modes, with online sales showing especially strong potential. The expanding use of mobile payment platforms, offered by companies like Grab, Alipay, Google Pay, and Apple Pay, further accelerates the industry’s momentum.
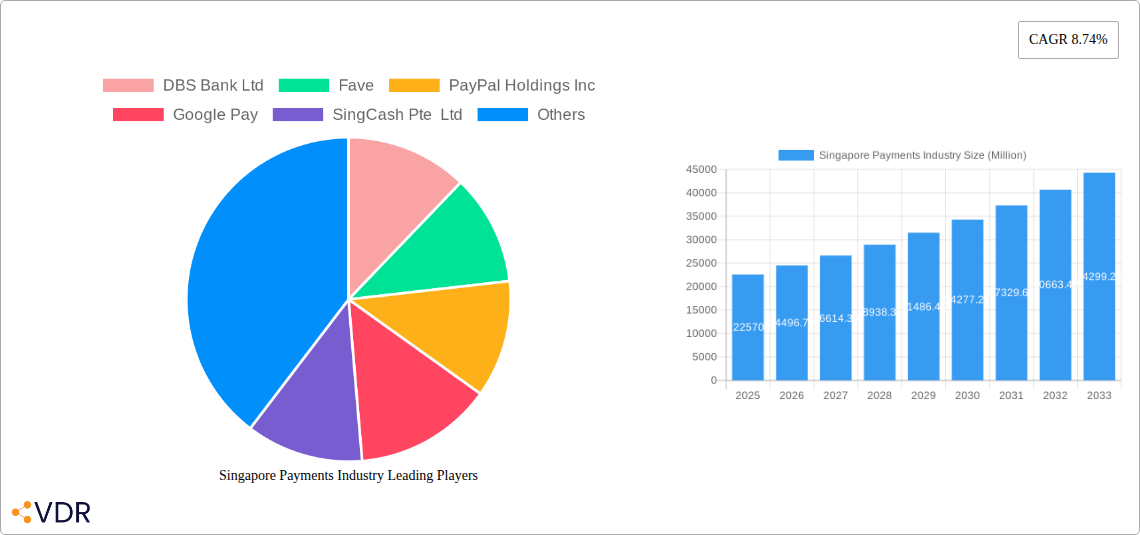
Singapore Payments Industry Market Size (In Billion)
The forecast for the Singapore payments market indicates continued upward trajectory, exceeding $40 billion by 2033. This substantial growth is anticipated across various end-user industries. The retail sector will remain a major driver, followed by entertainment, healthcare, and hospitality, all exhibiting increasing reliance on digital payment systems. The ongoing development of robust regulatory frameworks to support digital transactions, combined with the increasing sophistication of payment technologies, will solidify Singapore's position as a leading hub for innovative payment solutions in Southeast Asia. The competitive landscape, characterized by both established financial institutions and agile fintech players, will continue to stimulate innovation and improve user experience.
Singapore Payments Industry Company Market Share
Singapore Payments Industry: Market Report 2019-2033
This comprehensive report provides a detailed analysis of the Singapore payments industry, covering market dynamics, growth trends, dominant segments, key players, and future outlook. The study period spans from 2019 to 2033, with 2025 serving as the base and estimated year. This report is essential for businesses, investors, and industry professionals seeking to understand and navigate this rapidly evolving market.
Keywords: Singapore payments industry, digital payments, mobile payments, fintech, e-commerce payments, point-of-sale (POS), online payments, DBS Bank, PayPal, Grab, Alipay, Google Pay, Apple Pay, Samsung Pay, market size, market share, growth rate, CAGR, market trends, competitive landscape, regulatory landscape.
Singapore Payments Industry Market Dynamics & Structure
The Singapore payments industry is characterized by high market concentration amongst established players like DBS Bank Ltd, and rapid technological innovation driven by fintech startups and global giants like PayPal Holdings Inc and Alipay. Stringent regulatory frameworks from the Monetary Authority of Singapore (MAS) ensure stability and consumer protection. The market experiences intense competition, with established players facing challenges from disruptive technologies and new entrants. Consumer demographics are largely tech-savvy, driving the adoption of digital payment methods. Mergers and acquisitions (M&A) are prevalent, with larger players acquiring smaller fintech companies to expand their capabilities and market share.
- Market Concentration: High, with top 5 players holding approximately xx% of the market share in 2025.
- Technological Innovation: Rapid, driven by mobile wallets, contactless payments, and blockchain technologies.
- Regulatory Framework: Stringent, overseen by MAS, promoting security and consumer protection.
- Competitive Substitutes: Cash, checks, and other traditional payment methods.
- End-user Demographics: Highly digitally literate population with high smartphone penetration.
- M&A Trends: Significant activity, with an estimated xx M&A deals in the historical period (2019-2024).
Singapore Payments Industry Growth Trends & Insights
The Singapore payments industry experienced robust growth from 2019 to 2024, driven by the increasing adoption of digital and mobile payment solutions. The market is projected to maintain a strong CAGR of xx% during the forecast period (2025-2033), exceeding xx Million in 2033. This growth is fueled by technological advancements, rising e-commerce penetration, and evolving consumer preferences towards contactless and cashless transactions. The shift towards digital payment solutions is accompanied by increased transaction values and frequency.
- Market Size Evolution: From xx Million in 2019 to xx Million in 2024, projected to reach xx Million in 2033.
- Adoption Rates: High and increasing across all segments, particularly among younger demographics.
- Technological Disruptions: Continued innovation in areas like biometrics, AI, and blockchain.
- Consumer Behavior Shifts: Preference shifting towards contactless, mobile, and online payment options.
Dominant Regions, Countries, or Segments in Singapore Payments Industry
The retail segment under the end-user industry, along with the Point of Sale (POS) and Online Sale modes of payment are the dominant growth drivers within the Singapore payments industry. The high concentration of retail businesses, coupled with increased e-commerce activity, necessitates robust and efficient payment solutions. Government initiatives promoting digitalization and a tech-savvy population further propel this dominance.
- By Mode of Payment:
- Point of Sale (POS): Dominant due to widespread adoption of contactless payments and mobile wallets.
- Online Sale: Rapid growth driven by e-commerce boom and increasing online transactions.
- By End-user Industry:
- Retail: Largest segment due to high transaction volume and diverse payment preferences.
- Entertainment: Significant growth due to online ticketing and digital content consumption.
- Healthcare: Increasing adoption of digital payment solutions for medical services.
- Hospitality: Growing adoption of contactless payments and mobile wallets.
Singapore Payments Industry Product Landscape
The Singapore payments landscape is characterized by a diverse range of products, including mobile wallets (e.g., Google Pay, Samsung Pay, Apple Pay), digital payment platforms (e.g., PayPal, GrabPay), and online payment gateways. These solutions offer varying features such as contactless payments, peer-to-peer (P2P) transfers, and loyalty program integration. Innovation focuses on improving security, user experience, and interoperability.
Key Drivers, Barriers & Challenges in Singapore Payments Industry
Key Drivers:
- Growing smartphone penetration and internet usage.
- Increasing e-commerce adoption and online shopping.
- Government initiatives promoting digitalization and cashless transactions.
- Technological advancements in payment processing and security.
Challenges:
- Maintaining robust cybersecurity measures against fraud and data breaches. (Estimated cost of cybercrime impacting xx Million in 2024).
- Ensuring seamless interoperability between different payment systems.
- Addressing concerns related to data privacy and consumer protection.
- Competition from established players and new entrants.
Emerging Opportunities in Singapore Payments Industry
- Expansion of mobile payment solutions into underserved segments.
- Growth of Buy Now, Pay Later (BNPL) services.
- Increasing adoption of blockchain technology for secure transactions.
- Development of innovative solutions for micropayments and cross-border transactions.
Growth Accelerators in the Singapore Payments Industry
The long-term growth of the Singapore payments industry will be significantly driven by continuous technological advancements, strategic collaborations between established players and fintech startups, and the expansion of payment solutions into new sectors and markets. Government policies promoting a cashless society will further accelerate market expansion.
Key Players Shaping the Singapore Payments Industry Market
- DBS Bank Ltd
- Fave
- PayPal Holdings Inc
- Google Pay
- SingCash Pte Ltd
- Amazon com Inc
- Grab
- Alipay
- Apple Inc
- Samsung
Notable Milestones in Singapore Payments Industry Sector
- July 2022: Google Wallet launched in Singapore, complementing Google Pay.
- January 2023: Samsung Wallet app expanded to Singapore.
In-Depth Singapore Payments Industry Market Outlook
The Singapore payments industry is poised for continued growth, driven by factors such as increasing digitalization, technological innovation, and supportive government policies. Strategic partnerships and expansion into new market segments will further unlock growth potential. The market is expected to witness further consolidation, with established players and fintech companies vying for market share. The future holds significant opportunities for players who can adapt to evolving consumer preferences and technological advancements.
Singapore Payments Industry Segmentation
-
1. Mode of Payment
-
1.1. Point of Sale
- 1.1.1. Card Pay
- 1.1.2. Digital Wallet (includes Mobile Wallets)
- 1.1.3. Cash
- 1.1.4. Other Point of Sales
-
1.2. Online Sale
- 1.2.1. Other
-
1.1. Point of Sale
-
2. End-user Industry
- 2.1. Retail
- 2.2. Entertainment
- 2.3. Healthcare
- 2.4. Hospitality
- 2.5. Other End-user Industries
Singapore Payments Industry Segmentation By Geography
- 1. Singapore
Singapore Payments Industry Regional Market Share
Geographic Coverage of Singapore Payments Industry
Singapore Payments Industry REPORT HIGHLIGHTS
| Aspects | Details |
|---|---|
| Study Period | 2020-2034 |
| Base Year | 2025 |
| Estimated Year | 2026 |
| Forecast Period | 2026-2034 |
| Historical Period | 2020-2025 |
| Growth Rate | CAGR of 8.74% from 2020-2034 |
| Segmentation |
|
Table of Contents
- 1. Introduction
- 1.1. Research Scope
- 1.2. Market Segmentation
- 1.3. Research Objective
- 1.4. Definitions and Assumptions
- 2. Executive Summary
- 2.1. Market Snapshot
- 3. Market Dynamics
- 3.1. Market Drivers
- 3.2. Market Restrains
- 3.3. Market Trends
- 3.4. Market Opportunities
- 4. Market Factor Analysis
- 4.1. Porters Five Forces
- 4.1.1. Bargaining Power of Suppliers
- 4.1.2. Bargaining Power of Buyers
- 4.1.3. Threat of New Entrants
- 4.1.4. Threat of Substitutes
- 4.1.5. Competitive Rivalry
- 4.2. PESTEL analysis
- 4.3. BCG Analysis
- 4.3.1. Stars (High Growth, High Market Share)
- 4.3.2. Cash Cows (Low Growth, High Market Share)
- 4.3.3. Question Mark (High Growth, Low Market Share)
- 4.3.4. Dogs (Low Growth, Low Market Share)
- 4.4. Ansoff Matrix Analysis
- 4.5. Supply Chain Analysis
- 4.6. Regulatory Landscape
- 4.7. Current Market Potential and Opportunity Assessment (TAM–SAM–SOM Framework)
- 4.8. VDR Analyst Note
- 4.1. Porters Five Forces
- 5. Market Analysis, Insights and Forecast 2021-2033
- 5.1. Market Analysis, Insights and Forecast - by Mode of Payment
- 5.1.1. Point of Sale
- 5.1.1.1. Card Pay
- 5.1.1.2. Digital Wallet (includes Mobile Wallets)
- 5.1.1.3. Cash
- 5.1.1.4. Other Point of Sales
- 5.1.2. Online Sale
- 5.1.2.1. Other
- 5.1.1. Point of Sale
- 5.2. Market Analysis, Insights and Forecast - by End-user Industry
- 5.2.1. Retail
- 5.2.2. Entertainment
- 5.2.3. Healthcare
- 5.2.4. Hospitality
- 5.2.5. Other End-user Industries
- 5.3. Market Analysis, Insights and Forecast - by Region
- 5.3.1. Singapore
- 5.1. Market Analysis, Insights and Forecast - by Mode of Payment
- 6. Singapore Payments Industry Analysis, Insights and Forecast, 2021-2033
- 6.1. Market Analysis, Insights and Forecast - by Mode of Payment
- 6.1.1. Point of Sale
- 6.1.1.1. Card Pay
- 6.1.1.2. Digital Wallet (includes Mobile Wallets)
- 6.1.1.3. Cash
- 6.1.1.4. Other Point of Sales
- 6.1.2. Online Sale
- 6.1.2.1. Other
- 6.1.1. Point of Sale
- 6.2. Market Analysis, Insights and Forecast - by End-user Industry
- 6.2.1. Retail
- 6.2.2. Entertainment
- 6.2.3. Healthcare
- 6.2.4. Hospitality
- 6.2.5. Other End-user Industries
- 6.1. Market Analysis, Insights and Forecast - by Mode of Payment
- 7. Competitive Analysis
- 7.1. Company Profiles
- 7.1.1 DBS Bank Ltd
- 7.1.1.1. Company Overview
- 7.1.1.2. Products
- 7.1.1.3. Company Financials
- 7.1.1.4. SWOT Analysis
- 7.1.2 Fave
- 7.1.2.1. Company Overview
- 7.1.2.2. Products
- 7.1.2.3. Company Financials
- 7.1.2.4. SWOT Analysis
- 7.1.3 PayPal Holdings Inc
- 7.1.3.1. Company Overview
- 7.1.3.2. Products
- 7.1.3.3. Company Financials
- 7.1.3.4. SWOT Analysis
- 7.1.4 Google Pay
- 7.1.4.1. Company Overview
- 7.1.4.2. Products
- 7.1.4.3. Company Financials
- 7.1.4.4. SWOT Analysis
- 7.1.5 SingCash Pte Ltd
- 7.1.5.1. Company Overview
- 7.1.5.2. Products
- 7.1.5.3. Company Financials
- 7.1.5.4. SWOT Analysis
- 7.1.6 Amazon com Inc
- 7.1.6.1. Company Overview
- 7.1.6.2. Products
- 7.1.6.3. Company Financials
- 7.1.6.4. SWOT Analysis
- 7.1.7 Grab
- 7.1.7.1. Company Overview
- 7.1.7.2. Products
- 7.1.7.3. Company Financials
- 7.1.7.4. SWOT Analysis
- 7.1.8 Alipay
- 7.1.8.1. Company Overview
- 7.1.8.2. Products
- 7.1.8.3. Company Financials
- 7.1.8.4. SWOT Analysis
- 7.1.9 Apple Inc
- 7.1.9.1. Company Overview
- 7.1.9.2. Products
- 7.1.9.3. Company Financials
- 7.1.9.4. SWOT Analysis
- 7.1.10 Samsung
- 7.1.10.1. Company Overview
- 7.1.10.2. Products
- 7.1.10.3. Company Financials
- 7.1.10.4. SWOT Analysis
- 7.1.1 DBS Bank Ltd
- 7.2. Market Entropy
- 7.2.1 Company's Key Areas Served
- 7.2.2 Recent Developments
- 7.3. Company Market Share Analysis 2025
- 7.3.1 Top 5 Companies Market Share Analysis
- 7.3.2 Top 3 Companies Market Share Analysis
- 7.4. List of Potential Customers
- 8. Research Methodology
List of Figures
- Figure 1: Singapore Payments Industry Revenue Breakdown (Million, %) by Product 2025 & 2033
- Figure 2: Singapore Payments Industry Share (%) by Company 2025
List of Tables
- Table 1: Singapore Payments Industry Revenue Million Forecast, by Mode of Payment 2020 & 2033
- Table 2: Singapore Payments Industry Revenue Million Forecast, by End-user Industry 2020 & 2033
- Table 3: Singapore Payments Industry Revenue Million Forecast, by Region 2020 & 2033
- Table 4: Singapore Payments Industry Revenue Million Forecast, by Mode of Payment 2020 & 2033
- Table 5: Singapore Payments Industry Revenue Million Forecast, by End-user Industry 2020 & 2033
- Table 6: Singapore Payments Industry Revenue Million Forecast, by Country 2020 & 2033
Frequently Asked Questions
1. What is the projected Compound Annual Growth Rate (CAGR) of the Singapore Payments Industry?
The projected CAGR is approximately 8.74%.
2. Which companies are prominent players in the Singapore Payments Industry?
Key companies in the market include DBS Bank Ltd, Fave, PayPal Holdings Inc, Google Pay, SingCash Pte Ltd, Amazon com Inc, Grab, Alipay, Apple Inc, Samsung.
3. What are the main segments of the Singapore Payments Industry?
The market segments include Mode of Payment, End-user Industry.
4. Can you provide details about the market size?
The market size is estimated to be USD 22.57 Million as of 2022.
5. What are some drivers contributing to market growth?
The payments market in Singapore is driven by boom in the e-commerce industry; Major retailers and the government are promoting Market Digitization through activation programs.; Increased use of real-time payments. specifically Buy Now Pay Later..
6. What are the notable trends driving market growth?
The payments market in Singapore is driven by boom in the e-commerce industry.
7. Are there any restraints impacting market growth?
High Costs of Equipment.
8. Can you provide examples of recent developments in the market?
January 2023: Samsung unveiled plans to expand the availability of the Samsung Wallet app to eight additional countries, with Singapore being among them. This versatile wallet application was introduced as a unified platform, offering users a secure storage solution for their digital keys, boarding passes, identification cards, and various other documents on their mobile devices.
9. What pricing options are available for accessing the report?
Pricing options include single-user, multi-user, and enterprise licenses priced at USD 3800, USD 4500, and USD 5800 respectively.
10. Is the market size provided in terms of value or volume?
The market size is provided in terms of value, measured in Million.
11. Are there any specific market keywords associated with the report?
Yes, the market keyword associated with the report is "Singapore Payments Industry," which aids in identifying and referencing the specific market segment covered.
12. How do I determine which pricing option suits my needs best?
The pricing options vary based on user requirements and access needs. Individual users may opt for single-user licenses, while businesses requiring broader access may choose multi-user or enterprise licenses for cost-effective access to the report.
13. Are there any additional resources or data provided in the Singapore Payments Industry report?
While the report offers comprehensive insights, it's advisable to review the specific contents or supplementary materials provided to ascertain if additional resources or data are available.
14. How can I stay updated on further developments or reports in the Singapore Payments Industry?
To stay informed about further developments, trends, and reports in the Singapore Payments Industry, consider subscribing to industry newsletters, following relevant companies and organizations, or regularly checking reputable industry news sources and publications.
Methodology
Step 1 - Identification of Relevant Samples Size from Population Database


Step 2 - Approaches for Defining Global Market Size (Value, Volume* & Price*)

Note*: In applicable scenarios
Step 3 - Data Sources
Primary Research
- Web Analytics
- Survey Reports
- Research Institute
- Latest Research Reports
- Opinion Leaders
Secondary Research
- Annual Reports
- White Paper
- Latest Press Release
- Industry Association
- Paid Database
- Investor Presentations

Step 4 - Data Triangulation
Involves using different sources of information in order to increase the validity of a study
These sources are likely to be stakeholders in a program - participants, other researchers, program staff, other community members, and so on.
Then we put all data in single framework & apply various statistical tools to find out the dynamic on the market.
During the analysis stage, feedback from the stakeholder groups would be compared to determine areas of agreement as well as areas of divergence