
Key Insights
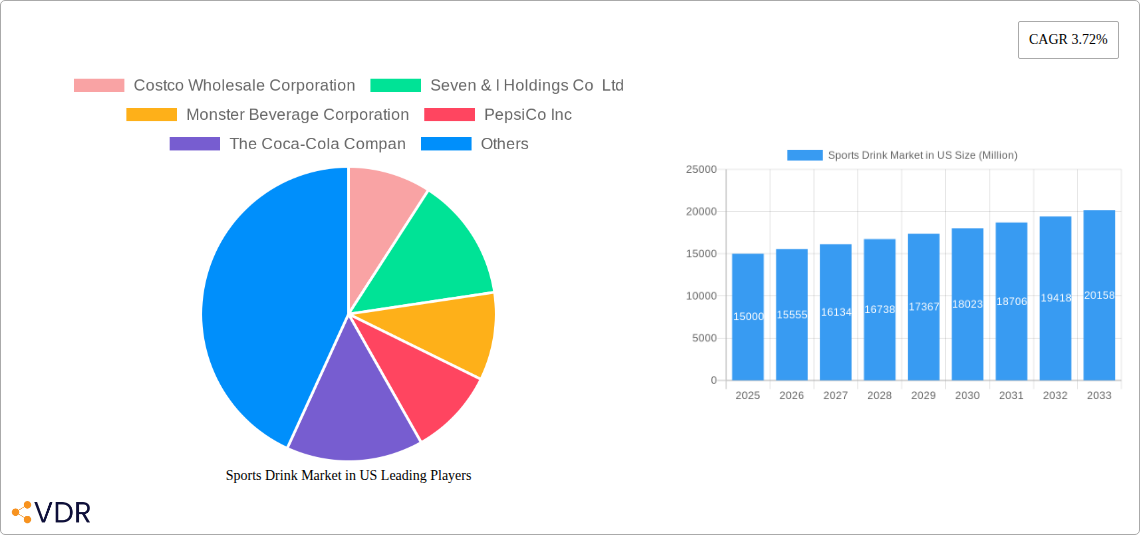
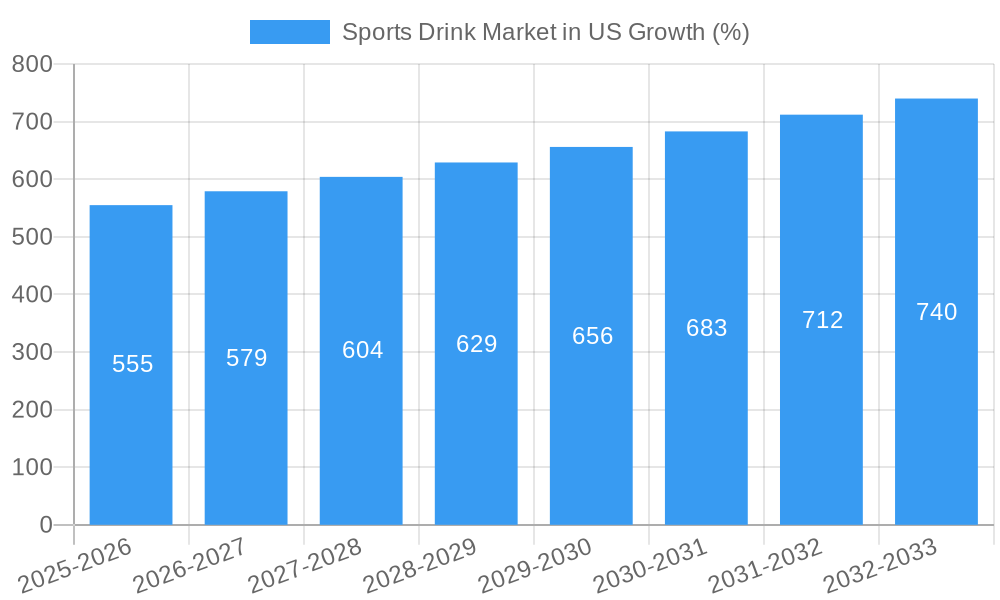
The US sports drink market, valued at approximately $15 billion in 2025, is projected to experience steady growth, driven by increasing health consciousness, rising participation in sports and fitness activities, and the expanding popularity of functional beverages. The 3.72% CAGR suggests a consistent expansion over the forecast period (2025-2033), reaching an estimated market value exceeding $20 billion by 2033. Key growth drivers include the introduction of innovative product formulations, such as electrolyte-enhanced waters and protein-based sports drinks catering to diverse consumer needs and preferences. The market is segmented by drink type (isotonic, hypotonic, hypertonic, electrolyte-enhanced water, protein-based), packaging (PET bottles, metal cans, aseptic packages), and distribution channels (convenience stores, supermarkets, online retail, specialty stores). While the dominance of established players like Coca-Cola, PepsiCo, and Monster Beverage is undeniable, smaller brands are gaining traction by focusing on niche segments and emphasizing natural ingredients and sustainable packaging. The increasing demand for healthier, low-sugar options presents both opportunities and challenges for existing players. Competition is fierce, requiring brands to invest heavily in marketing and product innovation to maintain market share and attract new consumers.
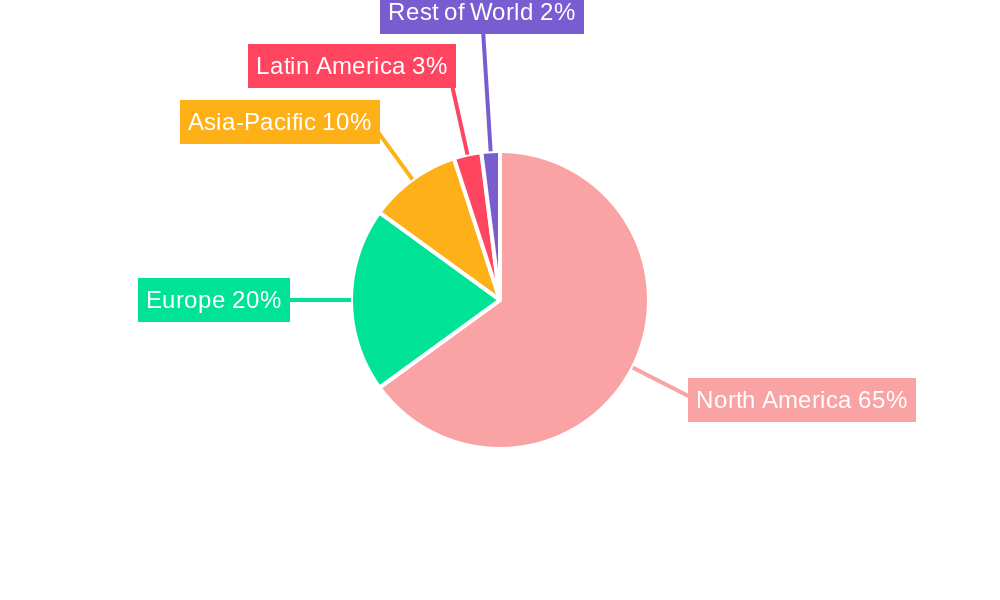
The North American market, particularly the United States, represents a significant portion of the global sports drink market, benefiting from high disposable incomes and a strong fitness culture. However, growing concerns about added sugar and artificial ingredients are prompting consumers to seek healthier alternatives, impacting the demand for traditional, high-sugar sports drinks. This shift creates an opportunity for brands offering low-sugar, natural, and functional options. The rise of e-commerce also presents a significant distribution channel, allowing brands to reach a wider audience and potentially bypass traditional retail margins. Competition will continue to intensify, with established players and emerging brands vying for market share through product innovation, strategic partnerships, and targeted marketing campaigns aimed at specific consumer demographics. Packaging trends are also shifting towards sustainable and convenient options, such as recyclable PET bottles and aseptic packaging for extended shelf life.
Sports Drink Market in US: A Comprehensive Report (2019-2033)
This in-depth report provides a comprehensive analysis of the US sports drink market, covering market dynamics, growth trends, dominant segments, product landscape, key players, and future outlook. The report uses data from the historical period (2019-2024), base year (2025), and forecast period (2025-2033) to offer valuable insights for industry professionals. The total market size is projected at xx Million units in 2025.
Sports Drink Market in US Market Dynamics & Structure
The US sports drink market is a dynamic landscape characterized by intense competition, rapid innovation, and evolving consumer preferences. Market concentration is moderate, with several large players dominating alongside smaller niche brands. Technological advancements, particularly in formulation and packaging, are key drivers of growth. Stringent regulatory frameworks surrounding labeling and ingredients impact product development. Healthy lifestyle trends fuel demand, while the rise of alternative beverages (e.g., functional waters) presents competitive pressure. M&A activity has been significant in recent years, with larger companies acquiring smaller players to expand their market share and product portfolios.
- Market Concentration: Moderate, with a few major players holding significant share.
- Technological Innovation: Focus on natural ingredients, enhanced functionality (e.g., electrolytes, protein), and sustainable packaging.
- Regulatory Landscape: Stringent regulations on labeling and ingredient claims.
- Competitive Substitutes: Functional waters, energy drinks, and other hydration beverages.
- End-User Demographics: Primarily active individuals, athletes, and health-conscious consumers.
- M&A Trends: Significant consolidation activity, with larger companies acquiring smaller brands. Estimated xx M&A deals in the last 5 years.
Sports Drink Market in US Growth Trends & Insights
The US sports drink market has witnessed substantial growth over the past few years, driven by increasing health consciousness and rising participation in sports and fitness activities. The market is expected to continue its expansion, although at a slightly moderated pace compared to previous years. Consumer preference shifts towards healthier, functional beverages with natural ingredients are influencing product development. Technological disruptions, such as improved packaging and enhanced formulation techniques, contribute to market expansion. Adoption rates are high among target demographics, with ongoing market penetration amongst younger consumers and those engaging in regular physical activity.
- Market Size Evolution: Steady growth from xx Million units in 2019 to a projected xx Million units in 2025.
- CAGR (2019-2025): xx%
- Market Penetration: High among active individuals, with room for growth in niche segments.
- Technological Disruptions: Advancements in formulation, packaging (e.g., recyclable materials), and distribution channels.
- Consumer Behavior Shifts: Increased demand for natural ingredients, reduced sugar content, and functional benefits.
Dominant Regions, Countries, or Segments in Sports Drink Market in US
The US sports drink market exhibits regional variations in consumption patterns, with higher demand concentrated in areas with higher levels of fitness participation. Within the product segments, electrolyte-enhanced waters and isotonic drinks enjoy significant market share due to their hydration benefits. PET bottles are the dominant packaging type, driven by convenience and cost-effectiveness. Convenience stores are the leading distribution channel, leveraging their wide accessibility.
- Leading Region: West Coast (California, Oregon, Washington) shows strong demand due to health-conscious population and active lifestyle.
- Leading Segment (Soft Drink Type): Electrolyte-enhanced water, driven by its perceived health benefits and broader appeal.
- Leading Segment (Packaging Type): PET Bottles due to cost-effectiveness and convenience for consumers.
- Leading Segment (Distribution Channel): Convenience Stores due to wide reach and impulse purchases.
- Growth Drivers: Health and wellness trends, increasing fitness participation rates, and innovative product launches.
Sports Drink Market in US Product Landscape
Product innovation in the US sports drink market is characterized by a focus on natural ingredients, functional benefits, and improved taste profiles. Electrolyte-enhanced waters are gaining popularity due to their clean label and health benefits. Protein-based sport drinks target athletes seeking post-workout recovery solutions. Brands are increasingly emphasizing natural sweeteners and reduced sugar content to cater to health-conscious consumers. Technological advancements in packaging aim for greater sustainability and convenience, with a move towards recyclable and eco-friendly materials.
Key Drivers, Barriers & Challenges in Sports Drink Market in US
Key Drivers:
- Growing health and wellness awareness.
- Rising participation in sports and fitness activities.
- Increasing demand for functional beverages with added health benefits.
- Technological advancements in product formulation and packaging.
Key Challenges:
- Intense competition from established brands and emerging players.
- Consumer preference shifts towards natural and low-sugar options.
- Regulatory hurdles concerning labeling and ingredient claims.
- Supply chain disruptions affecting raw material availability and costs. Increased transportation costs impacted the market by xx Million units in 2024.
Emerging Opportunities in Sports Drink Market in US
- Expansion into niche segments, such as plant-based sports drinks.
- Development of personalized sports nutrition solutions based on individual needs.
- Growing demand for convenient and sustainable packaging options.
- Focus on emerging markets and underpenetrated regions.
Growth Accelerators in the Sports Drink Market in US Industry
Strategic partnerships and collaborations between beverage companies and fitness brands can fuel growth by reaching new customer bases. Investing in research and development for innovative product formulations, focusing on natural ingredients and functional benefits, is crucial. Exploring sustainable packaging solutions to meet environmentally conscious consumer preferences will drive long-term market expansion.
Key Players Shaping the Sports Drink Market in US Market
- Costco Wholesale Corporation
- Seven & I Holdings Co Ltd
- Monster Beverage Corporation
- PepsiCo Inc
- The Coca-Cola Company
- Abbott Laboratories
- Suntory Holdings Limited
- Keurig Dr Pepper Inc
- Pisa Global S A de C V
- Otsuka Holdings Co Ltd
- Bluetriton Brands Holdings Inc
- Congo Brands
Notable Milestones in Sports Drink Market in US Sector
- December 2023: Spar partners with Congo Brands to introduce Prime drinks, expanding distribution within the convenience store channel.
- April 2023: Congo LLC expands its Louisville headquarters, investing USD 8.25 million and creating 500 jobs, signaling increased production capacity.
- February 2023: Core Hydration launches Core Hydration+, a line of nutrient-enhanced waters, expanding the functional beverage category.
In-Depth Sports Drink Market in US Market Outlook
The US sports drink market is poised for continued growth, driven by the increasing demand for healthier and functional beverages. Strategic partnerships, innovative product development, and sustainable packaging solutions will be key factors in shaping future market dynamics. The focus on natural ingredients, enhanced functionality, and convenient consumption will continue to attract health-conscious consumers, leading to a positive market outlook.
Sports Drink Market in US Segmentation
-
1. Soft Drink Type
- 1.1. Electrolyte-Enhanced Water
- 1.2. Hypertonic
- 1.3. Hypotonic
- 1.4. Isotonic
- 1.5. Protein-based Sport Drinks
-
2. Packaging Type
- 2.1. Aseptic packages
- 2.2. Metal Can
- 2.3. PET Bottles
-
3. Sub Distribution Channel
- 3.1. Convenience Stores
- 3.2. Online Retail
- 3.3. Specialty Stores
- 3.4. Supermarket/Hypermarket
- 3.5. Others
Sports Drink Market in US Segmentation By Geography
-
1. North America
- 1.1. United States
- 1.2. Canada
- 1.3. Mexico
-
2. South America
- 2.1. Brazil
- 2.2. Argentina
- 2.3. Rest of South America
-
3. Europe
- 3.1. United Kingdom
- 3.2. Germany
- 3.3. France
- 3.4. Italy
- 3.5. Spain
- 3.6. Russia
- 3.7. Benelux
- 3.8. Nordics
- 3.9. Rest of Europe
-
4. Middle East & Africa
- 4.1. Turkey
- 4.2. Israel
- 4.3. GCC
- 4.4. North Africa
- 4.5. South Africa
- 4.6. Rest of Middle East & Africa
-
5. Asia Pacific
- 5.1. China
- 5.2. India
- 5.3. Japan
- 5.4. South Korea
- 5.5. ASEAN
- 5.6. Oceania
- 5.7. Rest of Asia Pacific
Sports Drink Market in US REPORT HIGHLIGHTS
| Aspects | Details |
|---|---|
| Study Period | 2019-2033 |
| Base Year | 2024 |
| Estimated Year | 2025 |
| Forecast Period | 2025-2033 |
| Historical Period | 2019-2024 |
| Growth Rate | CAGR of 3.72% from 2019-2033 |
| Segmentation |
|
Table of Contents
- 1. Introduction
- 1.1. Research Scope
- 1.2. Market Segmentation
- 1.3. Research Methodology
- 1.4. Definitions and Assumptions
- 2. Executive Summary
- 2.1. Introduction
- 3. Market Dynamics
- 3.1. Introduction
- 3.2. Market Drivers
- 3.2.1. Rising Consumer Awareness about Health and Fitness; Increasing the Use of Casein and Caseinate in Food and Beverage Industry
- 3.3. Market Restrains
- 3.3.1. High Competition From Alternative Protein Sources
- 3.4. Market Trends
- 3.4.1. OTHER KEY INDUSTRY TRENDS COVERED IN THE REPORT
- 4. Market Factor Analysis
- 4.1. Porters Five Forces
- 4.2. Supply/Value Chain
- 4.3. PESTEL analysis
- 4.4. Market Entropy
- 4.5. Patent/Trademark Analysis
- 5. Global Sports Drink Market in US Analysis, Insights and Forecast, 2019-2031
- 5.1. Market Analysis, Insights and Forecast - by Soft Drink Type
- 5.1.1. Electrolyte-Enhanced Water
- 5.1.2. Hypertonic
- 5.1.3. Hypotonic
- 5.1.4. Isotonic
- 5.1.5. Protein-based Sport Drinks
- 5.2. Market Analysis, Insights and Forecast - by Packaging Type
- 5.2.1. Aseptic packages
- 5.2.2. Metal Can
- 5.2.3. PET Bottles
- 5.3. Market Analysis, Insights and Forecast - by Sub Distribution Channel
- 5.3.1. Convenience Stores
- 5.3.2. Online Retail
- 5.3.3. Specialty Stores
- 5.3.4. Supermarket/Hypermarket
- 5.3.5. Others
- 5.4. Market Analysis, Insights and Forecast - by Region
- 5.4.1. North America
- 5.4.2. South America
- 5.4.3. Europe
- 5.4.4. Middle East & Africa
- 5.4.5. Asia Pacific
- 5.1. Market Analysis, Insights and Forecast - by Soft Drink Type
- 6. North America Sports Drink Market in US Analysis, Insights and Forecast, 2019-2031
- 6.1. Market Analysis, Insights and Forecast - by Soft Drink Type
- 6.1.1. Electrolyte-Enhanced Water
- 6.1.2. Hypertonic
- 6.1.3. Hypotonic
- 6.1.4. Isotonic
- 6.1.5. Protein-based Sport Drinks
- 6.2. Market Analysis, Insights and Forecast - by Packaging Type
- 6.2.1. Aseptic packages
- 6.2.2. Metal Can
- 6.2.3. PET Bottles
- 6.3. Market Analysis, Insights and Forecast - by Sub Distribution Channel
- 6.3.1. Convenience Stores
- 6.3.2. Online Retail
- 6.3.3. Specialty Stores
- 6.3.4. Supermarket/Hypermarket
- 6.3.5. Others
- 6.1. Market Analysis, Insights and Forecast - by Soft Drink Type
- 7. South America Sports Drink Market in US Analysis, Insights and Forecast, 2019-2031
- 7.1. Market Analysis, Insights and Forecast - by Soft Drink Type
- 7.1.1. Electrolyte-Enhanced Water
- 7.1.2. Hypertonic
- 7.1.3. Hypotonic
- 7.1.4. Isotonic
- 7.1.5. Protein-based Sport Drinks
- 7.2. Market Analysis, Insights and Forecast - by Packaging Type
- 7.2.1. Aseptic packages
- 7.2.2. Metal Can
- 7.2.3. PET Bottles
- 7.3. Market Analysis, Insights and Forecast - by Sub Distribution Channel
- 7.3.1. Convenience Stores
- 7.3.2. Online Retail
- 7.3.3. Specialty Stores
- 7.3.4. Supermarket/Hypermarket
- 7.3.5. Others
- 7.1. Market Analysis, Insights and Forecast - by Soft Drink Type
- 8. Europe Sports Drink Market in US Analysis, Insights and Forecast, 2019-2031
- 8.1. Market Analysis, Insights and Forecast - by Soft Drink Type
- 8.1.1. Electrolyte-Enhanced Water
- 8.1.2. Hypertonic
- 8.1.3. Hypotonic
- 8.1.4. Isotonic
- 8.1.5. Protein-based Sport Drinks
- 8.2. Market Analysis, Insights and Forecast - by Packaging Type
- 8.2.1. Aseptic packages
- 8.2.2. Metal Can
- 8.2.3. PET Bottles
- 8.3. Market Analysis, Insights and Forecast - by Sub Distribution Channel
- 8.3.1. Convenience Stores
- 8.3.2. Online Retail
- 8.3.3. Specialty Stores
- 8.3.4. Supermarket/Hypermarket
- 8.3.5. Others
- 8.1. Market Analysis, Insights and Forecast - by Soft Drink Type
- 9. Middle East & Africa Sports Drink Market in US Analysis, Insights and Forecast, 2019-2031
- 9.1. Market Analysis, Insights and Forecast - by Soft Drink Type
- 9.1.1. Electrolyte-Enhanced Water
- 9.1.2. Hypertonic
- 9.1.3. Hypotonic
- 9.1.4. Isotonic
- 9.1.5. Protein-based Sport Drinks
- 9.2. Market Analysis, Insights and Forecast - by Packaging Type
- 9.2.1. Aseptic packages
- 9.2.2. Metal Can
- 9.2.3. PET Bottles
- 9.3. Market Analysis, Insights and Forecast - by Sub Distribution Channel
- 9.3.1. Convenience Stores
- 9.3.2. Online Retail
- 9.3.3. Specialty Stores
- 9.3.4. Supermarket/Hypermarket
- 9.3.5. Others
- 9.1. Market Analysis, Insights and Forecast - by Soft Drink Type
- 10. Asia Pacific Sports Drink Market in US Analysis, Insights and Forecast, 2019-2031
- 10.1. Market Analysis, Insights and Forecast - by Soft Drink Type
- 10.1.1. Electrolyte-Enhanced Water
- 10.1.2. Hypertonic
- 10.1.3. Hypotonic
- 10.1.4. Isotonic
- 10.1.5. Protein-based Sport Drinks
- 10.2. Market Analysis, Insights and Forecast - by Packaging Type
- 10.2.1. Aseptic packages
- 10.2.2. Metal Can
- 10.2.3. PET Bottles
- 10.3. Market Analysis, Insights and Forecast - by Sub Distribution Channel
- 10.3.1. Convenience Stores
- 10.3.2. Online Retail
- 10.3.3. Specialty Stores
- 10.3.4. Supermarket/Hypermarket
- 10.3.5. Others
- 10.1. Market Analysis, Insights and Forecast - by Soft Drink Type
- 11. United States Sports Drink Market in US Analysis, Insights and Forecast, 2019-2031
- 12. Canada Sports Drink Market in US Analysis, Insights and Forecast, 2019-2031
- 13. Mexico Sports Drink Market in US Analysis, Insights and Forecast, 2019-2031
- 14. Competitive Analysis
- 14.1. Global Market Share Analysis 2024
- 14.2. Company Profiles
- 14.2.1 Costco Wholesale Corporation
- 14.2.1.1. Overview
- 14.2.1.2. Products
- 14.2.1.3. SWOT Analysis
- 14.2.1.4. Recent Developments
- 14.2.1.5. Financials (Based on Availability)
- 14.2.2 Seven & I Holdings Co Ltd
- 14.2.2.1. Overview
- 14.2.2.2. Products
- 14.2.2.3. SWOT Analysis
- 14.2.2.4. Recent Developments
- 14.2.2.5. Financials (Based on Availability)
- 14.2.3 Monster Beverage Corporation
- 14.2.3.1. Overview
- 14.2.3.2. Products
- 14.2.3.3. SWOT Analysis
- 14.2.3.4. Recent Developments
- 14.2.3.5. Financials (Based on Availability)
- 14.2.4 PepsiCo Inc
- 14.2.4.1. Overview
- 14.2.4.2. Products
- 14.2.4.3. SWOT Analysis
- 14.2.4.4. Recent Developments
- 14.2.4.5. Financials (Based on Availability)
- 14.2.5 The Coca-Cola Compan
- 14.2.5.1. Overview
- 14.2.5.2. Products
- 14.2.5.3. SWOT Analysis
- 14.2.5.4. Recent Developments
- 14.2.5.5. Financials (Based on Availability)
- 14.2.6 Abbott Laboratories
- 14.2.6.1. Overview
- 14.2.6.2. Products
- 14.2.6.3. SWOT Analysis
- 14.2.6.4. Recent Developments
- 14.2.6.5. Financials (Based on Availability)
- 14.2.7 Suntory Holdings Limited
- 14.2.7.1. Overview
- 14.2.7.2. Products
- 14.2.7.3. SWOT Analysis
- 14.2.7.4. Recent Developments
- 14.2.7.5. Financials (Based on Availability)
- 14.2.8 Keurig Dr Pepper Inc
- 14.2.8.1. Overview
- 14.2.8.2. Products
- 14.2.8.3. SWOT Analysis
- 14.2.8.4. Recent Developments
- 14.2.8.5. Financials (Based on Availability)
- 14.2.9 Pisa Global S A de C V
- 14.2.9.1. Overview
- 14.2.9.2. Products
- 14.2.9.3. SWOT Analysis
- 14.2.9.4. Recent Developments
- 14.2.9.5. Financials (Based on Availability)
- 14.2.10 Otsuka Holdings Co Ltd
- 14.2.10.1. Overview
- 14.2.10.2. Products
- 14.2.10.3. SWOT Analysis
- 14.2.10.4. Recent Developments
- 14.2.10.5. Financials (Based on Availability)
- 14.2.11 Bluetriton Brands Holdings Inc
- 14.2.11.1. Overview
- 14.2.11.2. Products
- 14.2.11.3. SWOT Analysis
- 14.2.11.4. Recent Developments
- 14.2.11.5. Financials (Based on Availability)
- 14.2.12 Congo Brands
- 14.2.12.1. Overview
- 14.2.12.2. Products
- 14.2.12.3. SWOT Analysis
- 14.2.12.4. Recent Developments
- 14.2.12.5. Financials (Based on Availability)
- 14.2.1 Costco Wholesale Corporation
List of Figures
- Figure 1: Global Sports Drink Market in US Revenue Breakdown (Million, %) by Region 2024 & 2032
- Figure 2: North America Sports Drink Market in US Revenue (Million), by Country 2024 & 2032
- Figure 3: North America Sports Drink Market in US Revenue Share (%), by Country 2024 & 2032
- Figure 4: North America Sports Drink Market in US Revenue (Million), by Soft Drink Type 2024 & 2032
- Figure 5: North America Sports Drink Market in US Revenue Share (%), by Soft Drink Type 2024 & 2032
- Figure 6: North America Sports Drink Market in US Revenue (Million), by Packaging Type 2024 & 2032
- Figure 7: North America Sports Drink Market in US Revenue Share (%), by Packaging Type 2024 & 2032
- Figure 8: North America Sports Drink Market in US Revenue (Million), by Sub Distribution Channel 2024 & 2032
- Figure 9: North America Sports Drink Market in US Revenue Share (%), by Sub Distribution Channel 2024 & 2032
- Figure 10: North America Sports Drink Market in US Revenue (Million), by Country 2024 & 2032
- Figure 11: North America Sports Drink Market in US Revenue Share (%), by Country 2024 & 2032
- Figure 12: South America Sports Drink Market in US Revenue (Million), by Soft Drink Type 2024 & 2032
- Figure 13: South America Sports Drink Market in US Revenue Share (%), by Soft Drink Type 2024 & 2032
- Figure 14: South America Sports Drink Market in US Revenue (Million), by Packaging Type 2024 & 2032
- Figure 15: South America Sports Drink Market in US Revenue Share (%), by Packaging Type 2024 & 2032
- Figure 16: South America Sports Drink Market in US Revenue (Million), by Sub Distribution Channel 2024 & 2032
- Figure 17: South America Sports Drink Market in US Revenue Share (%), by Sub Distribution Channel 2024 & 2032
- Figure 18: South America Sports Drink Market in US Revenue (Million), by Country 2024 & 2032
- Figure 19: South America Sports Drink Market in US Revenue Share (%), by Country 2024 & 2032
- Figure 20: Europe Sports Drink Market in US Revenue (Million), by Soft Drink Type 2024 & 2032
- Figure 21: Europe Sports Drink Market in US Revenue Share (%), by Soft Drink Type 2024 & 2032
- Figure 22: Europe Sports Drink Market in US Revenue (Million), by Packaging Type 2024 & 2032
- Figure 23: Europe Sports Drink Market in US Revenue Share (%), by Packaging Type 2024 & 2032
- Figure 24: Europe Sports Drink Market in US Revenue (Million), by Sub Distribution Channel 2024 & 2032
- Figure 25: Europe Sports Drink Market in US Revenue Share (%), by Sub Distribution Channel 2024 & 2032
- Figure 26: Europe Sports Drink Market in US Revenue (Million), by Country 2024 & 2032
- Figure 27: Europe Sports Drink Market in US Revenue Share (%), by Country 2024 & 2032
- Figure 28: Middle East & Africa Sports Drink Market in US Revenue (Million), by Soft Drink Type 2024 & 2032
- Figure 29: Middle East & Africa Sports Drink Market in US Revenue Share (%), by Soft Drink Type 2024 & 2032
- Figure 30: Middle East & Africa Sports Drink Market in US Revenue (Million), by Packaging Type 2024 & 2032
- Figure 31: Middle East & Africa Sports Drink Market in US Revenue Share (%), by Packaging Type 2024 & 2032
- Figure 32: Middle East & Africa Sports Drink Market in US Revenue (Million), by Sub Distribution Channel 2024 & 2032
- Figure 33: Middle East & Africa Sports Drink Market in US Revenue Share (%), by Sub Distribution Channel 2024 & 2032
- Figure 34: Middle East & Africa Sports Drink Market in US Revenue (Million), by Country 2024 & 2032
- Figure 35: Middle East & Africa Sports Drink Market in US Revenue Share (%), by Country 2024 & 2032
- Figure 36: Asia Pacific Sports Drink Market in US Revenue (Million), by Soft Drink Type 2024 & 2032
- Figure 37: Asia Pacific Sports Drink Market in US Revenue Share (%), by Soft Drink Type 2024 & 2032
- Figure 38: Asia Pacific Sports Drink Market in US Revenue (Million), by Packaging Type 2024 & 2032
- Figure 39: Asia Pacific Sports Drink Market in US Revenue Share (%), by Packaging Type 2024 & 2032
- Figure 40: Asia Pacific Sports Drink Market in US Revenue (Million), by Sub Distribution Channel 2024 & 2032
- Figure 41: Asia Pacific Sports Drink Market in US Revenue Share (%), by Sub Distribution Channel 2024 & 2032
- Figure 42: Asia Pacific Sports Drink Market in US Revenue (Million), by Country 2024 & 2032
- Figure 43: Asia Pacific Sports Drink Market in US Revenue Share (%), by Country 2024 & 2032
List of Tables
- Table 1: Global Sports Drink Market in US Revenue Million Forecast, by Region 2019 & 2032
- Table 2: Global Sports Drink Market in US Revenue Million Forecast, by Soft Drink Type 2019 & 2032
- Table 3: Global Sports Drink Market in US Revenue Million Forecast, by Packaging Type 2019 & 2032
- Table 4: Global Sports Drink Market in US Revenue Million Forecast, by Sub Distribution Channel 2019 & 2032
- Table 5: Global Sports Drink Market in US Revenue Million Forecast, by Region 2019 & 2032
- Table 6: Global Sports Drink Market in US Revenue Million Forecast, by Country 2019 & 2032
- Table 7: United States Sports Drink Market in US Revenue (Million) Forecast, by Application 2019 & 2032
- Table 8: Canada Sports Drink Market in US Revenue (Million) Forecast, by Application 2019 & 2032
- Table 9: Mexico Sports Drink Market in US Revenue (Million) Forecast, by Application 2019 & 2032
- Table 10: Global Sports Drink Market in US Revenue Million Forecast, by Soft Drink Type 2019 & 2032
- Table 11: Global Sports Drink Market in US Revenue Million Forecast, by Packaging Type 2019 & 2032
- Table 12: Global Sports Drink Market in US Revenue Million Forecast, by Sub Distribution Channel 2019 & 2032
- Table 13: Global Sports Drink Market in US Revenue Million Forecast, by Country 2019 & 2032
- Table 14: United States Sports Drink Market in US Revenue (Million) Forecast, by Application 2019 & 2032
- Table 15: Canada Sports Drink Market in US Revenue (Million) Forecast, by Application 2019 & 2032
- Table 16: Mexico Sports Drink Market in US Revenue (Million) Forecast, by Application 2019 & 2032
- Table 17: Global Sports Drink Market in US Revenue Million Forecast, by Soft Drink Type 2019 & 2032
- Table 18: Global Sports Drink Market in US Revenue Million Forecast, by Packaging Type 2019 & 2032
- Table 19: Global Sports Drink Market in US Revenue Million Forecast, by Sub Distribution Channel 2019 & 2032
- Table 20: Global Sports Drink Market in US Revenue Million Forecast, by Country 2019 & 2032
- Table 21: Brazil Sports Drink Market in US Revenue (Million) Forecast, by Application 2019 & 2032
- Table 22: Argentina Sports Drink Market in US Revenue (Million) Forecast, by Application 2019 & 2032
- Table 23: Rest of South America Sports Drink Market in US Revenue (Million) Forecast, by Application 2019 & 2032
- Table 24: Global Sports Drink Market in US Revenue Million Forecast, by Soft Drink Type 2019 & 2032
- Table 25: Global Sports Drink Market in US Revenue Million Forecast, by Packaging Type 2019 & 2032
- Table 26: Global Sports Drink Market in US Revenue Million Forecast, by Sub Distribution Channel 2019 & 2032
- Table 27: Global Sports Drink Market in US Revenue Million Forecast, by Country 2019 & 2032
- Table 28: United Kingdom Sports Drink Market in US Revenue (Million) Forecast, by Application 2019 & 2032
- Table 29: Germany Sports Drink Market in US Revenue (Million) Forecast, by Application 2019 & 2032
- Table 30: France Sports Drink Market in US Revenue (Million) Forecast, by Application 2019 & 2032
- Table 31: Italy Sports Drink Market in US Revenue (Million) Forecast, by Application 2019 & 2032
- Table 32: Spain Sports Drink Market in US Revenue (Million) Forecast, by Application 2019 & 2032
- Table 33: Russia Sports Drink Market in US Revenue (Million) Forecast, by Application 2019 & 2032
- Table 34: Benelux Sports Drink Market in US Revenue (Million) Forecast, by Application 2019 & 2032
- Table 35: Nordics Sports Drink Market in US Revenue (Million) Forecast, by Application 2019 & 2032
- Table 36: Rest of Europe Sports Drink Market in US Revenue (Million) Forecast, by Application 2019 & 2032
- Table 37: Global Sports Drink Market in US Revenue Million Forecast, by Soft Drink Type 2019 & 2032
- Table 38: Global Sports Drink Market in US Revenue Million Forecast, by Packaging Type 2019 & 2032
- Table 39: Global Sports Drink Market in US Revenue Million Forecast, by Sub Distribution Channel 2019 & 2032
- Table 40: Global Sports Drink Market in US Revenue Million Forecast, by Country 2019 & 2032
- Table 41: Turkey Sports Drink Market in US Revenue (Million) Forecast, by Application 2019 & 2032
- Table 42: Israel Sports Drink Market in US Revenue (Million) Forecast, by Application 2019 & 2032
- Table 43: GCC Sports Drink Market in US Revenue (Million) Forecast, by Application 2019 & 2032
- Table 44: North Africa Sports Drink Market in US Revenue (Million) Forecast, by Application 2019 & 2032
- Table 45: South Africa Sports Drink Market in US Revenue (Million) Forecast, by Application 2019 & 2032
- Table 46: Rest of Middle East & Africa Sports Drink Market in US Revenue (Million) Forecast, by Application 2019 & 2032
- Table 47: Global Sports Drink Market in US Revenue Million Forecast, by Soft Drink Type 2019 & 2032
- Table 48: Global Sports Drink Market in US Revenue Million Forecast, by Packaging Type 2019 & 2032
- Table 49: Global Sports Drink Market in US Revenue Million Forecast, by Sub Distribution Channel 2019 & 2032
- Table 50: Global Sports Drink Market in US Revenue Million Forecast, by Country 2019 & 2032
- Table 51: China Sports Drink Market in US Revenue (Million) Forecast, by Application 2019 & 2032
- Table 52: India Sports Drink Market in US Revenue (Million) Forecast, by Application 2019 & 2032
- Table 53: Japan Sports Drink Market in US Revenue (Million) Forecast, by Application 2019 & 2032
- Table 54: South Korea Sports Drink Market in US Revenue (Million) Forecast, by Application 2019 & 2032
- Table 55: ASEAN Sports Drink Market in US Revenue (Million) Forecast, by Application 2019 & 2032
- Table 56: Oceania Sports Drink Market in US Revenue (Million) Forecast, by Application 2019 & 2032
- Table 57: Rest of Asia Pacific Sports Drink Market in US Revenue (Million) Forecast, by Application 2019 & 2032
Frequently Asked Questions
1. What is the projected Compound Annual Growth Rate (CAGR) of the Sports Drink Market in US?
The projected CAGR is approximately 3.72%.
2. Which companies are prominent players in the Sports Drink Market in US?
Key companies in the market include Costco Wholesale Corporation, Seven & I Holdings Co Ltd, Monster Beverage Corporation, PepsiCo Inc, The Coca-Cola Compan, Abbott Laboratories, Suntory Holdings Limited, Keurig Dr Pepper Inc, Pisa Global S A de C V, Otsuka Holdings Co Ltd, Bluetriton Brands Holdings Inc, Congo Brands.
3. What are the main segments of the Sports Drink Market in US?
The market segments include Soft Drink Type, Packaging Type, Sub Distribution Channel.
4. Can you provide details about the market size?
The market size is estimated to be USD XX Million as of 2022.
5. What are some drivers contributing to market growth?
Rising Consumer Awareness about Health and Fitness; Increasing the Use of Casein and Caseinate in Food and Beverage Industry.
6. What are the notable trends driving market growth?
OTHER KEY INDUSTRY TRENDS COVERED IN THE REPORT.
7. Are there any restraints impacting market growth?
High Competition From Alternative Protein Sources.
8. Can you provide examples of recent developments in the market?
December 2023: Spar works with US distributor Congo Brands to bring Prime drinks to stores. The move makes Spar the first symbol group in the convenience channel to stock PrimeApril 2023: Congo LLC to relocate, expand Louisville headquarters with USD 8.25 million investment, creating 500 high-wage jobs. The company will relocate its Louisville headquarters to an existing 110,000-square-foot location at 13551 Triton Park Blvd., moving from its current 18,000-square-foot facility.February 2023: Premium pH-balanced water brand Core Hydration expanded with Core Hydration+, a series of nutrient-enhanced waters, each formulated to support overall health with functional ingredients. The brand is available in three flavors under the names Core Hydration+Immunity, Core Hydartion+Vibrance, and Core Hydration+ Calm.
9. What pricing options are available for accessing the report?
Pricing options include single-user, multi-user, and enterprise licenses priced at USD 3800, USD 4500, and USD 5800 respectively.
10. Is the market size provided in terms of value or volume?
The market size is provided in terms of value, measured in Million.
11. Are there any specific market keywords associated with the report?
Yes, the market keyword associated with the report is "Sports Drink Market in US," which aids in identifying and referencing the specific market segment covered.
12. How do I determine which pricing option suits my needs best?
The pricing options vary based on user requirements and access needs. Individual users may opt for single-user licenses, while businesses requiring broader access may choose multi-user or enterprise licenses for cost-effective access to the report.
13. Are there any additional resources or data provided in the Sports Drink Market in US report?
While the report offers comprehensive insights, it's advisable to review the specific contents or supplementary materials provided to ascertain if additional resources or data are available.
14. How can I stay updated on further developments or reports in the Sports Drink Market in US?
To stay informed about further developments, trends, and reports in the Sports Drink Market in US, consider subscribing to industry newsletters, following relevant companies and organizations, or regularly checking reputable industry news sources and publications.
Methodology
Step 1 - Identification of Relevant Samples Size from Population Database


Step 2 - Approaches for Defining Global Market Size (Value, Volume* & Price*)

Note*: In applicable scenarios
Step 3 - Data Sources
Primary Research
- Web Analytics
- Survey Reports
- Research Institute
- Latest Research Reports
- Opinion Leaders
Secondary Research
- Annual Reports
- White Paper
- Latest Press Release
- Industry Association
- Paid Database
- Investor Presentations

Step 4 - Data Triangulation
Involves using different sources of information in order to increase the validity of a study
These sources are likely to be stakeholders in a program - participants, other researchers, program staff, other community members, and so on.
Then we put all data in single framework & apply various statistical tools to find out the dynamic on the market.
During the analysis stage, feedback from the stakeholder groups would be compared to determine areas of agreement as well as areas of divergence


