
Key Insights
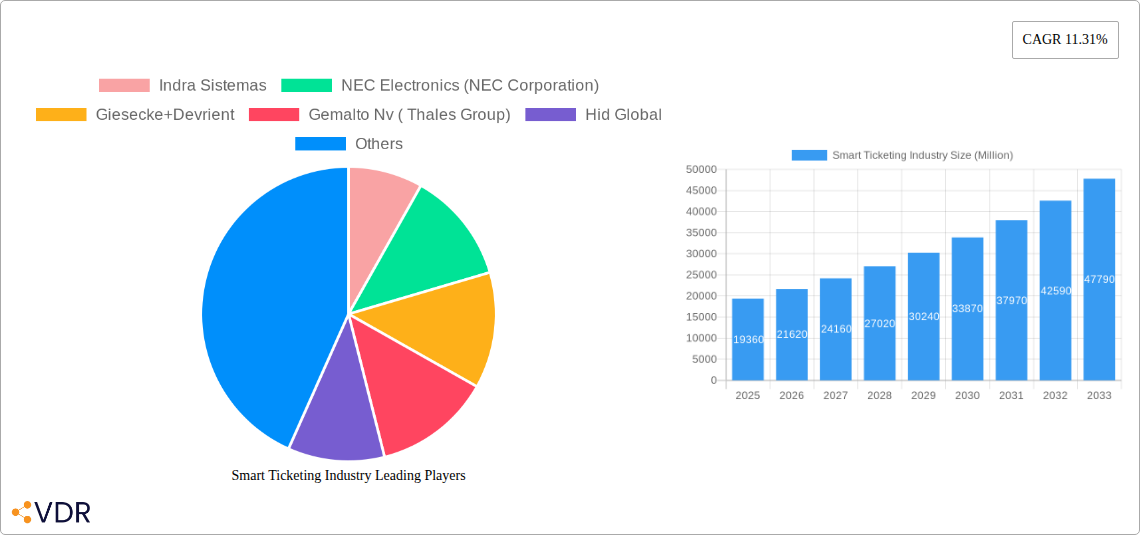
The global smart ticketing market, valued at $19.36 billion in 2025, is projected to experience robust growth, driven by the increasing adoption of contactless payment technologies and the rising demand for seamless and efficient public transportation systems. The market's Compound Annual Growth Rate (CAGR) of 11.31% from 2019 to 2024 indicates a strong upward trajectory, expected to continue throughout the forecast period (2025-2033). Key drivers include the growing urbanization leading to increased congestion and the need for optimized transit management. Furthermore, governments worldwide are investing heavily in smart city initiatives, further fueling the demand for advanced ticketing solutions. The shift towards digitalization and the integration of smart ticketing systems with mobile applications contribute significantly to market expansion. Technological advancements, such as near-field communication (NFC) and blockchain technology, are enhancing security and improving user experience. While challenges such as initial investment costs and potential cybersecurity threats exist, the overall market outlook remains positive, supported by continuous innovation and government support for smart transportation infrastructure.
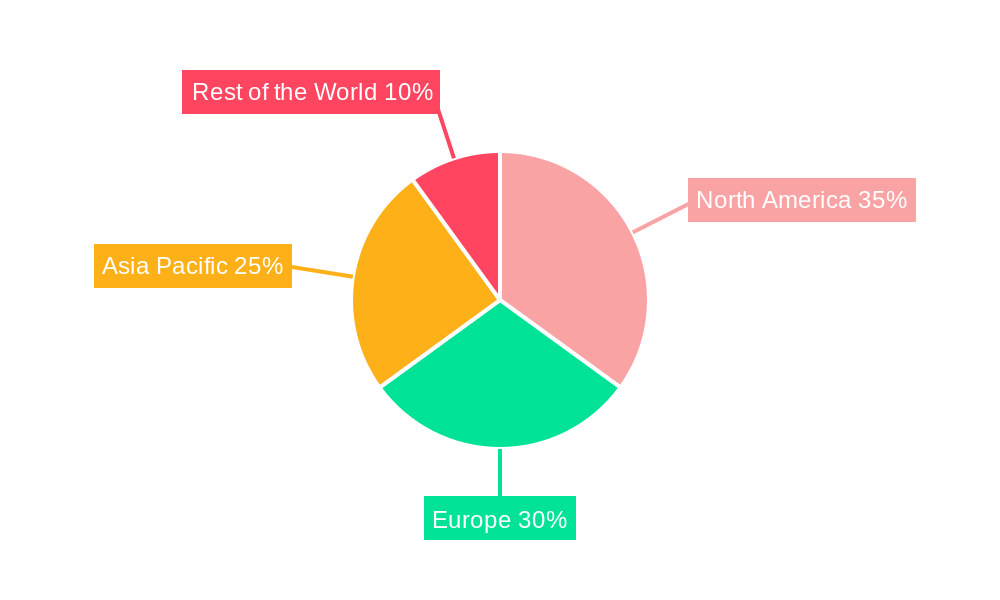
The market is segmented by offering (smart cards, wearables, readers, others) and application (transportation, including roadways, and sports & entertainment). The transportation segment is the largest contributor, owing to its extensive application in public transit systems like buses, trains, and subways. Growth in the wearables segment is particularly noteworthy, as consumers increasingly prefer convenient and contactless payment options. Leading players such as Indra Sistemas, NEC Electronics, Giesecke+Devrient, and Gemalto (Thales Group) are actively engaged in developing and deploying innovative smart ticketing solutions, fostering competition and driving market growth. Regional analysis reveals strong growth in North America and Asia Pacific, fueled by substantial investments in smart city infrastructure and expanding public transportation networks. The European market also displays considerable growth potential, driven by government initiatives to modernize transportation systems and improve passenger experience. The continuous integration of data analytics and artificial intelligence within smart ticketing systems will further enhance efficiency and personalization, bolstering the market's future prospects.
Smart Ticketing Industry Market Report: 2019-2033
This comprehensive report provides an in-depth analysis of the Smart Ticketing Industry, encompassing market dynamics, growth trends, competitive landscape, and future outlook. With a focus on key segments – including Smart Cards, Wearables, Readers, and other technologies within the Transportation, Roadways, and Sports & Entertainment sectors – this report offers invaluable insights for industry professionals, investors, and strategic decision-makers. The study period covers 2019-2033, with a base year of 2025 and a forecast period of 2025-2033. The market is estimated at xx Million units in 2025.
Smart Ticketing Industry Market Dynamics & Structure
The Smart Ticketing market is characterized by moderate concentration, with several key players vying for market share. Technological innovation, particularly in areas like contactless payments and mobile ticketing, is a major driver of growth. Regulatory frameworks and interoperability standards significantly influence market dynamics, while competitive pressures from alternative payment methods (e.g., cash, general-purpose credit/debit cards) impact adoption rates. End-user demographics, particularly the growing preference for contactless and mobile solutions among younger generations, further shapes market demand. M&A activity in the sector is relatively moderate, with xx deals recorded between 2019-2024, representing a xx% increase compared to the previous period.
- Market Concentration: Moderately concentrated, with top 5 players holding approximately xx% market share in 2024.
- Technological Innovation: Driven by advancements in NFC, biometric authentication, and mobile payment technologies.
- Regulatory Frameworks: Vary significantly across regions, impacting interoperability and market access.
- Competitive Substitutes: Traditional ticketing methods (paper tickets, cash) pose a competitive challenge, especially in less developed markets.
- End-User Demographics: Growing preference for contactless and mobile solutions, especially among younger demographics.
- M&A Trends: Moderate activity, with focus on expanding technological capabilities and geographical reach. Innovation barriers include high initial investment costs for infrastructure upgrades and challenges in integrating legacy systems.
Smart Ticketing Industry Growth Trends & Insights
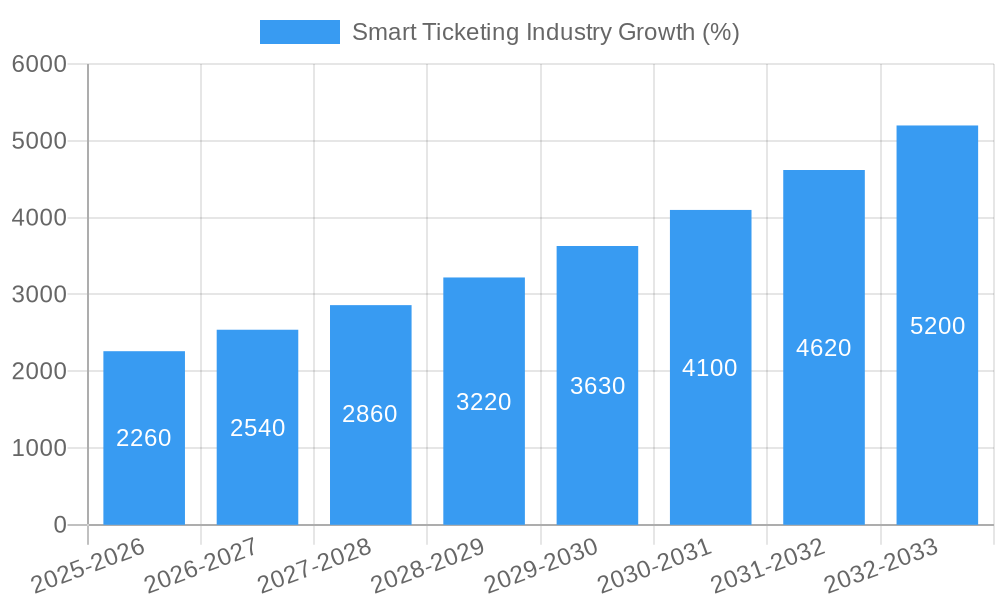
The Smart Ticketing market experienced significant growth between 2019 and 2024, expanding from xx Million units to xx Million units. This translates to a CAGR of xx% during the historical period. Market penetration remains relatively low in many regions, indicating significant untapped potential. Technological disruptions, such as the rise of mobile payments and the integration of smart ticketing into broader mobility platforms, are accelerating market growth. Consumer behavior is shifting towards increased preference for contactless, convenient, and integrated ticketing solutions. The forecast period (2025-2033) projects sustained growth, with an anticipated CAGR of xx%, driven by increased adoption across various applications and regions. The market is expected to reach xx Million units by 2033.
Dominant Regions, Countries, or Segments in Smart Ticketing Industry
The Transportation segment dominates the Smart Ticketing market, representing approximately xx% of the total market value in 2024. Within transportation, the public transit sector is the largest application, followed by roadways. Geographically, North America and Europe currently lead in market adoption and revenue generation, owing to advanced infrastructure and higher consumer adoption rates. However, regions like Asia-Pacific are experiencing rapid growth, driven by significant investments in public transportation infrastructure and increasing urbanization. The Smart Cards segment holds the largest share within the "By Offering" category, while the "Others" category (including validators and ticketing machines) demonstrates significant growth potential.
- Key Drivers (Transportation): Increasing urbanization, government initiatives promoting public transport, and growing demand for seamless travel experiences.
- Key Drivers (Roadways): Toll collection systems and parking management solutions utilizing smart ticketing technologies.
- Key Drivers (Sports & Entertainment): Demand for contactless entry, improved queue management, and enhanced event experience.
- Market Share: Transportation segment holds xx% market share, followed by Sports & Entertainment at xx%.
- Growth Potential: Asia-Pacific and Latin America exhibit significant growth potential due to expanding infrastructure and increasing adoption.
Smart Ticketing Industry Product Landscape
The Smart Ticketing market offers a diverse range of products, from simple smart cards to sophisticated wearable devices and integrated mobile applications. Recent innovations focus on enhanced security features, improved interoperability, and personalized user experiences. Key features include contactless payment capabilities, integration with mobile wallets, and advanced data analytics for optimized transit planning. The growing trend toward multimodal transport requires seamless integration across various transport modes. Products are differentiated by features such as security levels, battery life (for wearables), and ease of use. The latest technologies are driving advancements in secure element technologies and biometrics integration for enhanced security.
Key Drivers, Barriers & Challenges in Smart Ticketing Industry
Key Drivers:
- Increasing adoption of contactless payment technologies.
- Government initiatives promoting smart city development and improved public transportation systems.
- Growing demand for seamless and convenient travel experiences.
- Technological advancements in mobile ticketing and wearable technologies.
Key Challenges:
- High initial investment costs for infrastructure upgrades.
- Interoperability challenges across different transport systems and payment platforms.
- Security concerns related to data breaches and fraud.
- Regulatory hurdles and varying standards across different jurisdictions. This results in an estimated xx% reduction in potential market growth.
Emerging Opportunities in Smart Ticketing Industry
- Expansion into untapped markets, particularly in developing countries.
- Integration of smart ticketing with other smart city applications (e.g., parking, bike sharing).
- Development of personalized and customized ticketing solutions based on user preferences and travel patterns.
- Increased adoption of biometrics and other advanced security technologies.
Growth Accelerators in the Smart Ticketing Industry Industry
Technological breakthroughs in areas like secure element technology and NFC are driving market expansion. Strategic partnerships between technology providers, transit authorities, and payment processors are fostering wider adoption. Market expansion into new regions and applications, particularly in developing economies and niche segments, is fueling long-term growth.
Key Players Shaping the Smart Ticketing Industry Market
- Indra Sistemas
- NEC Electronics (NEC Corporation)
- Giesecke+Devrient
- Gemalto Nv ( Thales Group)
- Hid Global
- Infineon Technologies
- Conduent Inc
- Paragon ID ( Paragon Group Limited)
- Softjourn Inc
- Vix Technology
- Rambus Incorporated ( Visa Inc )
- Cubic Corporation
- Confidex Ltd
Notable Milestones in Smart Ticketing Industry Sector
- June 2022: Cubic Corporation's new ticketing system in Queensland, Australia achieves a significant milestone, enabling credit/debit card and mobile payments.
- November 2022: Infineon Technologies AG launches the SLC26P, a secure IC for high-volume payment applications, enhancing security standards in the payment industry.
In-Depth Smart Ticketing Industry Market Outlook
The Smart Ticketing market is poised for significant growth in the coming years, driven by continued technological advancements, expanding infrastructure development, and increasing consumer adoption of contactless payment solutions. Strategic partnerships and innovative business models will play a crucial role in unlocking the market's full potential. Opportunities exist in expanding into emerging markets, integrating smart ticketing with other smart city initiatives, and developing personalized and secure ticketing solutions to meet diverse user needs. The long-term outlook remains positive, with substantial growth expected across all key segments.
Smart Ticketing Industry Segmentation
-
1. Offering
- 1.1. Smart Cards
- 1.2. Wearables
- 1.3. Readers
- 1.4. Others
-
2. Application
-
2.1. Transportation
- 2.1.1. Railways
- 2.1.2. Airways
- 2.1.3. Roadways
- 2.2. Sports & Entertainment
-
2.1. Transportation
Smart Ticketing Industry Segmentation By Geography
-
1. North America
- 1.1. United States
- 1.2. Canada
-
2. Europe
- 2.1. Germany
- 2.2. United Kingdom
- 2.3. France
- 2.4. Rest of Europe
-
3. Asia Pacific
- 3.1. China
- 3.2. Japan
- 3.3. India
- 3.4. Australia and New Zealand
- 3.5. Rest of APAC
- 4. Rest of the World
Smart Ticketing Industry REPORT HIGHLIGHTS
| Aspects | Details |
|---|---|
| Study Period | 2019-2033 |
| Base Year | 2024 |
| Estimated Year | 2025 |
| Forecast Period | 2025-2033 |
| Historical Period | 2019-2024 |
| Growth Rate | CAGR of 11.31% from 2019-2033 |
| Segmentation |
|
Table of Contents
- 1. Introduction
- 1.1. Research Scope
- 1.2. Market Segmentation
- 1.3. Research Methodology
- 1.4. Definitions and Assumptions
- 2. Executive Summary
- 2.1. Introduction
- 3. Market Dynamics
- 3.1. Introduction
- 3.2. Market Drivers
- 3.2.1. Increasing Adoption of Intelligent Transportation; Growing Adoption of Modern Technology for Different Mode of Transportation such as Railways and Roadways is Propelling the Implementation of Smart Ticketing; Increasing usage of Smart wearable to drive the market growth
- 3.3. Market Restrains
- 3.3.1. High Initial Setup Costs
- 3.4. Market Trends
- 3.4.1. Smart wearables Occupies the Significant Share
- 4. Market Factor Analysis
- 4.1. Porters Five Forces
- 4.2. Supply/Value Chain
- 4.3. PESTEL analysis
- 4.4. Market Entropy
- 4.5. Patent/Trademark Analysis
- 5. Global Smart Ticketing Industry Analysis, Insights and Forecast, 2019-2031
- 5.1. Market Analysis, Insights and Forecast - by Offering
- 5.1.1. Smart Cards
- 5.1.2. Wearables
- 5.1.3. Readers
- 5.1.4. Others
- 5.2. Market Analysis, Insights and Forecast - by Application
- 5.2.1. Transportation
- 5.2.1.1. Railways
- 5.2.1.2. Airways
- 5.2.1.3. Roadways
- 5.2.2. Sports & Entertainment
- 5.2.1. Transportation
- 5.3. Market Analysis, Insights and Forecast - by Region
- 5.3.1. North America
- 5.3.2. Europe
- 5.3.3. Asia Pacific
- 5.3.4. Rest of the World
- 5.1. Market Analysis, Insights and Forecast - by Offering
- 6. North America Smart Ticketing Industry Analysis, Insights and Forecast, 2019-2031
- 6.1. Market Analysis, Insights and Forecast - by Offering
- 6.1.1. Smart Cards
- 6.1.2. Wearables
- 6.1.3. Readers
- 6.1.4. Others
- 6.2. Market Analysis, Insights and Forecast - by Application
- 6.2.1. Transportation
- 6.2.1.1. Railways
- 6.2.1.2. Airways
- 6.2.1.3. Roadways
- 6.2.2. Sports & Entertainment
- 6.2.1. Transportation
- 6.1. Market Analysis, Insights and Forecast - by Offering
- 7. Europe Smart Ticketing Industry Analysis, Insights and Forecast, 2019-2031
- 7.1. Market Analysis, Insights and Forecast - by Offering
- 7.1.1. Smart Cards
- 7.1.2. Wearables
- 7.1.3. Readers
- 7.1.4. Others
- 7.2. Market Analysis, Insights and Forecast - by Application
- 7.2.1. Transportation
- 7.2.1.1. Railways
- 7.2.1.2. Airways
- 7.2.1.3. Roadways
- 7.2.2. Sports & Entertainment
- 7.2.1. Transportation
- 7.1. Market Analysis, Insights and Forecast - by Offering
- 8. Asia Pacific Smart Ticketing Industry Analysis, Insights and Forecast, 2019-2031
- 8.1. Market Analysis, Insights and Forecast - by Offering
- 8.1.1. Smart Cards
- 8.1.2. Wearables
- 8.1.3. Readers
- 8.1.4. Others
- 8.2. Market Analysis, Insights and Forecast - by Application
- 8.2.1. Transportation
- 8.2.1.1. Railways
- 8.2.1.2. Airways
- 8.2.1.3. Roadways
- 8.2.2. Sports & Entertainment
- 8.2.1. Transportation
- 8.1. Market Analysis, Insights and Forecast - by Offering
- 9. Rest of the World Smart Ticketing Industry Analysis, Insights and Forecast, 2019-2031
- 9.1. Market Analysis, Insights and Forecast - by Offering
- 9.1.1. Smart Cards
- 9.1.2. Wearables
- 9.1.3. Readers
- 9.1.4. Others
- 9.2. Market Analysis, Insights and Forecast - by Application
- 9.2.1. Transportation
- 9.2.1.1. Railways
- 9.2.1.2. Airways
- 9.2.1.3. Roadways
- 9.2.2. Sports & Entertainment
- 9.2.1. Transportation
- 9.1. Market Analysis, Insights and Forecast - by Offering
- 10. North America Smart Ticketing Industry Analysis, Insights and Forecast, 2019-2031
- 10.1. Market Analysis, Insights and Forecast - By Country/Sub-region
- 10.1.1 United States
- 10.1.2 Canada
- 11. Europe Smart Ticketing Industry Analysis, Insights and Forecast, 2019-2031
- 11.1. Market Analysis, Insights and Forecast - By Country/Sub-region
- 11.1.1 Germany
- 11.1.2 United Kingdom
- 11.1.3 France
- 11.1.4 Rest of Europe
- 12. Asia Pacific Smart Ticketing Industry Analysis, Insights and Forecast, 2019-2031
- 12.1. Market Analysis, Insights and Forecast - By Country/Sub-region
- 12.1.1 China
- 12.1.2 Japan
- 12.1.3 India
- 12.1.4 Australia and New Zealand
- 12.1.5 Rest of APAC
- 13. Rest of the World Smart Ticketing Industry Analysis, Insights and Forecast, 2019-2031
- 13.1. Market Analysis, Insights and Forecast - By Country/Sub-region
- 13.1.1.
- 14. Competitive Analysis
- 14.1. Global Market Share Analysis 2024
- 14.2. Company Profiles
- 14.2.1 Indra Sistemas
- 14.2.1.1. Overview
- 14.2.1.2. Products
- 14.2.1.3. SWOT Analysis
- 14.2.1.4. Recent Developments
- 14.2.1.5. Financials (Based on Availability)
- 14.2.2 NEC Electronics (NEC Corporation)
- 14.2.2.1. Overview
- 14.2.2.2. Products
- 14.2.2.3. SWOT Analysis
- 14.2.2.4. Recent Developments
- 14.2.2.5. Financials (Based on Availability)
- 14.2.3 Giesecke+Devrient
- 14.2.3.1. Overview
- 14.2.3.2. Products
- 14.2.3.3. SWOT Analysis
- 14.2.3.4. Recent Developments
- 14.2.3.5. Financials (Based on Availability)
- 14.2.4 Gemalto Nv ( Thales Group)
- 14.2.4.1. Overview
- 14.2.4.2. Products
- 14.2.4.3. SWOT Analysis
- 14.2.4.4. Recent Developments
- 14.2.4.5. Financials (Based on Availability)
- 14.2.5 Hid Global
- 14.2.5.1. Overview
- 14.2.5.2. Products
- 14.2.5.3. SWOT Analysis
- 14.2.5.4. Recent Developments
- 14.2.5.5. Financials (Based on Availability)
- 14.2.6 Infineon Technologies
- 14.2.6.1. Overview
- 14.2.6.2. Products
- 14.2.6.3. SWOT Analysis
- 14.2.6.4. Recent Developments
- 14.2.6.5. Financials (Based on Availability)
- 14.2.7 Conduent Inc
- 14.2.7.1. Overview
- 14.2.7.2. Products
- 14.2.7.3. SWOT Analysis
- 14.2.7.4. Recent Developments
- 14.2.7.5. Financials (Based on Availability)
- 14.2.8 Paragon ID ( Paragon Group Limited)
- 14.2.8.1. Overview
- 14.2.8.2. Products
- 14.2.8.3. SWOT Analysis
- 14.2.8.4. Recent Developments
- 14.2.8.5. Financials (Based on Availability)
- 14.2.9 Softjourn Inc
- 14.2.9.1. Overview
- 14.2.9.2. Products
- 14.2.9.3. SWOT Analysis
- 14.2.9.4. Recent Developments
- 14.2.9.5. Financials (Based on Availability)
- 14.2.10 Vix Technology
- 14.2.10.1. Overview
- 14.2.10.2. Products
- 14.2.10.3. SWOT Analysis
- 14.2.10.4. Recent Developments
- 14.2.10.5. Financials (Based on Availability)
- 14.2.11 Rambus Incorporated ( Visa Inc )
- 14.2.11.1. Overview
- 14.2.11.2. Products
- 14.2.11.3. SWOT Analysis
- 14.2.11.4. Recent Developments
- 14.2.11.5. Financials (Based on Availability)
- 14.2.12 Cubic Corporation
- 14.2.12.1. Overview
- 14.2.12.2. Products
- 14.2.12.3. SWOT Analysis
- 14.2.12.4. Recent Developments
- 14.2.12.5. Financials (Based on Availability)
- 14.2.13 Confidex Ltd
- 14.2.13.1. Overview
- 14.2.13.2. Products
- 14.2.13.3. SWOT Analysis
- 14.2.13.4. Recent Developments
- 14.2.13.5. Financials (Based on Availability)
- 14.2.1 Indra Sistemas
List of Figures
- Figure 1: Global Smart Ticketing Industry Revenue Breakdown (Million, %) by Region 2024 & 2032
- Figure 2: North America Smart Ticketing Industry Revenue (Million), by Country 2024 & 2032
- Figure 3: North America Smart Ticketing Industry Revenue Share (%), by Country 2024 & 2032
- Figure 4: Europe Smart Ticketing Industry Revenue (Million), by Country 2024 & 2032
- Figure 5: Europe Smart Ticketing Industry Revenue Share (%), by Country 2024 & 2032
- Figure 6: Asia Pacific Smart Ticketing Industry Revenue (Million), by Country 2024 & 2032
- Figure 7: Asia Pacific Smart Ticketing Industry Revenue Share (%), by Country 2024 & 2032
- Figure 8: Rest of the World Smart Ticketing Industry Revenue (Million), by Country 2024 & 2032
- Figure 9: Rest of the World Smart Ticketing Industry Revenue Share (%), by Country 2024 & 2032
- Figure 10: North America Smart Ticketing Industry Revenue (Million), by Offering 2024 & 2032
- Figure 11: North America Smart Ticketing Industry Revenue Share (%), by Offering 2024 & 2032
- Figure 12: North America Smart Ticketing Industry Revenue (Million), by Application 2024 & 2032
- Figure 13: North America Smart Ticketing Industry Revenue Share (%), by Application 2024 & 2032
- Figure 14: North America Smart Ticketing Industry Revenue (Million), by Country 2024 & 2032
- Figure 15: North America Smart Ticketing Industry Revenue Share (%), by Country 2024 & 2032
- Figure 16: Europe Smart Ticketing Industry Revenue (Million), by Offering 2024 & 2032
- Figure 17: Europe Smart Ticketing Industry Revenue Share (%), by Offering 2024 & 2032
- Figure 18: Europe Smart Ticketing Industry Revenue (Million), by Application 2024 & 2032
- Figure 19: Europe Smart Ticketing Industry Revenue Share (%), by Application 2024 & 2032
- Figure 20: Europe Smart Ticketing Industry Revenue (Million), by Country 2024 & 2032
- Figure 21: Europe Smart Ticketing Industry Revenue Share (%), by Country 2024 & 2032
- Figure 22: Asia Pacific Smart Ticketing Industry Revenue (Million), by Offering 2024 & 2032
- Figure 23: Asia Pacific Smart Ticketing Industry Revenue Share (%), by Offering 2024 & 2032
- Figure 24: Asia Pacific Smart Ticketing Industry Revenue (Million), by Application 2024 & 2032
- Figure 25: Asia Pacific Smart Ticketing Industry Revenue Share (%), by Application 2024 & 2032
- Figure 26: Asia Pacific Smart Ticketing Industry Revenue (Million), by Country 2024 & 2032
- Figure 27: Asia Pacific Smart Ticketing Industry Revenue Share (%), by Country 2024 & 2032
- Figure 28: Rest of the World Smart Ticketing Industry Revenue (Million), by Offering 2024 & 2032
- Figure 29: Rest of the World Smart Ticketing Industry Revenue Share (%), by Offering 2024 & 2032
- Figure 30: Rest of the World Smart Ticketing Industry Revenue (Million), by Application 2024 & 2032
- Figure 31: Rest of the World Smart Ticketing Industry Revenue Share (%), by Application 2024 & 2032
- Figure 32: Rest of the World Smart Ticketing Industry Revenue (Million), by Country 2024 & 2032
- Figure 33: Rest of the World Smart Ticketing Industry Revenue Share (%), by Country 2024 & 2032
List of Tables
- Table 1: Global Smart Ticketing Industry Revenue Million Forecast, by Region 2019 & 2032
- Table 2: Global Smart Ticketing Industry Revenue Million Forecast, by Offering 2019 & 2032
- Table 3: Global Smart Ticketing Industry Revenue Million Forecast, by Application 2019 & 2032
- Table 4: Global Smart Ticketing Industry Revenue Million Forecast, by Region 2019 & 2032
- Table 5: Global Smart Ticketing Industry Revenue Million Forecast, by Country 2019 & 2032
- Table 6: United States Smart Ticketing Industry Revenue (Million) Forecast, by Application 2019 & 2032
- Table 7: Canada Smart Ticketing Industry Revenue (Million) Forecast, by Application 2019 & 2032
- Table 8: Global Smart Ticketing Industry Revenue Million Forecast, by Country 2019 & 2032
- Table 9: Germany Smart Ticketing Industry Revenue (Million) Forecast, by Application 2019 & 2032
- Table 10: United Kingdom Smart Ticketing Industry Revenue (Million) Forecast, by Application 2019 & 2032
- Table 11: France Smart Ticketing Industry Revenue (Million) Forecast, by Application 2019 & 2032
- Table 12: Rest of Europe Smart Ticketing Industry Revenue (Million) Forecast, by Application 2019 & 2032
- Table 13: Global Smart Ticketing Industry Revenue Million Forecast, by Country 2019 & 2032
- Table 14: China Smart Ticketing Industry Revenue (Million) Forecast, by Application 2019 & 2032
- Table 15: Japan Smart Ticketing Industry Revenue (Million) Forecast, by Application 2019 & 2032
- Table 16: India Smart Ticketing Industry Revenue (Million) Forecast, by Application 2019 & 2032
- Table 17: Australia and New Zealand Smart Ticketing Industry Revenue (Million) Forecast, by Application 2019 & 2032
- Table 18: Rest of APAC Smart Ticketing Industry Revenue (Million) Forecast, by Application 2019 & 2032
- Table 19: Global Smart Ticketing Industry Revenue Million Forecast, by Country 2019 & 2032
- Table 20: Smart Ticketing Industry Revenue (Million) Forecast, by Application 2019 & 2032
- Table 21: Global Smart Ticketing Industry Revenue Million Forecast, by Offering 2019 & 2032
- Table 22: Global Smart Ticketing Industry Revenue Million Forecast, by Application 2019 & 2032
- Table 23: Global Smart Ticketing Industry Revenue Million Forecast, by Country 2019 & 2032
- Table 24: United States Smart Ticketing Industry Revenue (Million) Forecast, by Application 2019 & 2032
- Table 25: Canada Smart Ticketing Industry Revenue (Million) Forecast, by Application 2019 & 2032
- Table 26: Global Smart Ticketing Industry Revenue Million Forecast, by Offering 2019 & 2032
- Table 27: Global Smart Ticketing Industry Revenue Million Forecast, by Application 2019 & 2032
- Table 28: Global Smart Ticketing Industry Revenue Million Forecast, by Country 2019 & 2032
- Table 29: Germany Smart Ticketing Industry Revenue (Million) Forecast, by Application 2019 & 2032
- Table 30: United Kingdom Smart Ticketing Industry Revenue (Million) Forecast, by Application 2019 & 2032
- Table 31: France Smart Ticketing Industry Revenue (Million) Forecast, by Application 2019 & 2032
- Table 32: Rest of Europe Smart Ticketing Industry Revenue (Million) Forecast, by Application 2019 & 2032
- Table 33: Global Smart Ticketing Industry Revenue Million Forecast, by Offering 2019 & 2032
- Table 34: Global Smart Ticketing Industry Revenue Million Forecast, by Application 2019 & 2032
- Table 35: Global Smart Ticketing Industry Revenue Million Forecast, by Country 2019 & 2032
- Table 36: China Smart Ticketing Industry Revenue (Million) Forecast, by Application 2019 & 2032
- Table 37: Japan Smart Ticketing Industry Revenue (Million) Forecast, by Application 2019 & 2032
- Table 38: India Smart Ticketing Industry Revenue (Million) Forecast, by Application 2019 & 2032
- Table 39: Australia and New Zealand Smart Ticketing Industry Revenue (Million) Forecast, by Application 2019 & 2032
- Table 40: Rest of APAC Smart Ticketing Industry Revenue (Million) Forecast, by Application 2019 & 2032
- Table 41: Global Smart Ticketing Industry Revenue Million Forecast, by Offering 2019 & 2032
- Table 42: Global Smart Ticketing Industry Revenue Million Forecast, by Application 2019 & 2032
- Table 43: Global Smart Ticketing Industry Revenue Million Forecast, by Country 2019 & 2032
Frequently Asked Questions
1. What is the projected Compound Annual Growth Rate (CAGR) of the Smart Ticketing Industry?
The projected CAGR is approximately 11.31%.
2. Which companies are prominent players in the Smart Ticketing Industry?
Key companies in the market include Indra Sistemas, NEC Electronics (NEC Corporation), Giesecke+Devrient, Gemalto Nv ( Thales Group), Hid Global, Infineon Technologies, Conduent Inc, Paragon ID ( Paragon Group Limited), Softjourn Inc , Vix Technology, Rambus Incorporated ( Visa Inc ), Cubic Corporation, Confidex Ltd.
3. What are the main segments of the Smart Ticketing Industry?
The market segments include Offering, Application.
4. Can you provide details about the market size?
The market size is estimated to be USD 19.36 Million as of 2022.
5. What are some drivers contributing to market growth?
Increasing Adoption of Intelligent Transportation; Growing Adoption of Modern Technology for Different Mode of Transportation such as Railways and Roadways is Propelling the Implementation of Smart Ticketing; Increasing usage of Smart wearable to drive the market growth.
6. What are the notable trends driving market growth?
Smart wearables Occupies the Significant Share.
7. Are there any restraints impacting market growth?
High Initial Setup Costs.
8. Can you provide examples of recent developments in the market?
June 2022 - Cubic Corporation announced that the new ticketing system used by its Cubic Transportation Systems (CTS) business division in Queensland had achieved a significant milestone. Translink customers can now use credit and debit cards and mobile devices to pay for travel on the Ferny Grove line of the passenger rail system.
9. What pricing options are available for accessing the report?
Pricing options include single-user, multi-user, and enterprise licenses priced at USD 4750, USD 5250, and USD 8750 respectively.
10. Is the market size provided in terms of value or volume?
The market size is provided in terms of value, measured in Million.
11. Are there any specific market keywords associated with the report?
Yes, the market keyword associated with the report is "Smart Ticketing Industry," which aids in identifying and referencing the specific market segment covered.
12. How do I determine which pricing option suits my needs best?
The pricing options vary based on user requirements and access needs. Individual users may opt for single-user licenses, while businesses requiring broader access may choose multi-user or enterprise licenses for cost-effective access to the report.
13. Are there any additional resources or data provided in the Smart Ticketing Industry report?
While the report offers comprehensive insights, it's advisable to review the specific contents or supplementary materials provided to ascertain if additional resources or data are available.
14. How can I stay updated on further developments or reports in the Smart Ticketing Industry?
To stay informed about further developments, trends, and reports in the Smart Ticketing Industry, consider subscribing to industry newsletters, following relevant companies and organizations, or regularly checking reputable industry news sources and publications.
Methodology
Step 1 - Identification of Relevant Samples Size from Population Database


Step 2 - Approaches for Defining Global Market Size (Value, Volume* & Price*)

Note*: In applicable scenarios
Step 3 - Data Sources
Primary Research
- Web Analytics
- Survey Reports
- Research Institute
- Latest Research Reports
- Opinion Leaders
Secondary Research
- Annual Reports
- White Paper
- Latest Press Release
- Industry Association
- Paid Database
- Investor Presentations

Step 4 - Data Triangulation
Involves using different sources of information in order to increase the validity of a study
These sources are likely to be stakeholders in a program - participants, other researchers, program staff, other community members, and so on.
Then we put all data in single framework & apply various statistical tools to find out the dynamic on the market.
During the analysis stage, feedback from the stakeholder groups would be compared to determine areas of agreement as well as areas of divergence


