
Key Insights
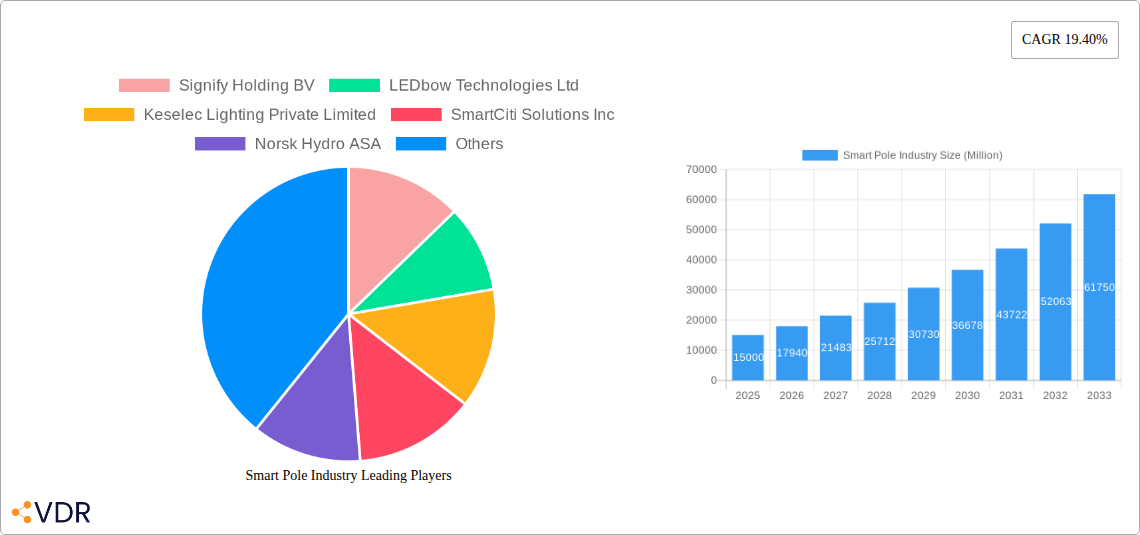
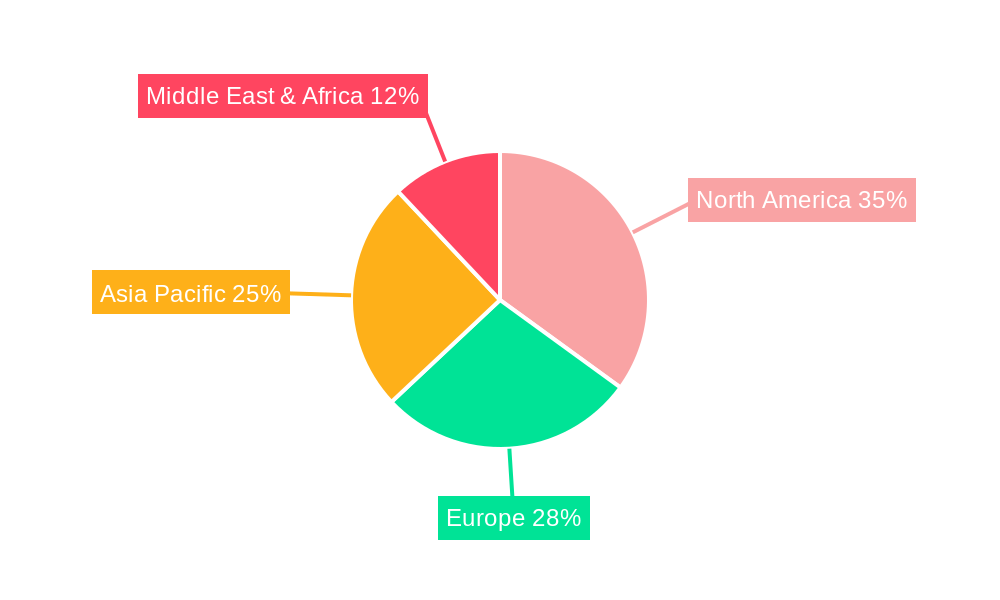
The smart pole market is experiencing robust growth, driven by the increasing demand for smart city initiatives and the need for efficient urban infrastructure management. With a Compound Annual Growth Rate (CAGR) of 19.40% from 2019 to 2024, the market is projected to reach significant value by 2033. Key drivers include the rising adoption of Internet of Things (IoT) technologies, advancements in LED lighting, and the need for improved public safety and environmental monitoring. The integration of various functionalities like lighting, connectivity (5G, Wi-Fi), sensors (environmental, traffic), and data analytics platforms within a single infrastructure unit is proving highly attractive to municipalities and commercial entities. The market is segmented by product type (lighting, connectivity, sensors, data analytics), application (smart lighting, traffic management, surveillance, environmental sensing), and end-user (municipalities, governments, commercial entities). North America and Asia Pacific are currently leading regions, fueled by significant investments in smart city projects and technological advancements. However, Europe and the Middle East & Africa are poised for considerable growth in the coming years due to increasing urbanization and government initiatives promoting sustainable infrastructure. Competition is intense, with established players like Signify Holding BV and newer entrants vying for market share. The strategic partnerships between technology providers and infrastructure companies are shaping the market landscape, driving innovation and enhancing the overall value proposition of smart poles.
The market's future trajectory is expected to be further influenced by the increasing focus on energy efficiency, sustainability, and the integration of advanced technologies like artificial intelligence (AI) and machine learning (ML) for improved data analysis and predictive capabilities. The integration of smart poles with other smart city elements like smart grids and smart traffic systems will be crucial for realizing the full potential of this market. Challenges remain, including the high initial investment costs associated with smart pole deployment and the need for robust cybersecurity measures to prevent data breaches and ensure system reliability. Addressing these challenges will be key to unlocking the full potential of the smart pole market and promoting its wider adoption globally. Overall, the forecast indicates a promising future for this sector, with continued growth projected throughout the forecast period, driven by technological advancements and evolving urban needs.
Smart Pole Industry Market Report: 2019-2033
This comprehensive report provides an in-depth analysis of the Smart Pole industry, encompassing market dynamics, growth trends, regional dominance, product landscapes, and key player strategies. With a focus on the parent market of smart city infrastructure and the child market of smart pole technologies, this report offers crucial insights for industry professionals, investors, and strategic decision-makers. The study period covers 2019-2033, with a base year of 2025 and a forecast period of 2025-2033. The market is segmented by product type (Lighting, Connectivity, Sensors, Data Analytics), application (Smart Lighting, Traffic Management, Surveillance, Environmental Sensing), and end-user (Municipalities, Governments, Commercial Entities). The total market size is projected to reach xx Million by 2033.
Smart Pole Industry Market Dynamics & Structure
The Smart Pole market is characterized by moderate concentration, with several key players competing for market share. Technological innovation, particularly in 5G connectivity and sensor integration, is a primary growth driver. Stringent regulatory frameworks concerning infrastructure deployment and data privacy influence market dynamics. The rise of alternative solutions like distributed antenna systems (DAS) poses competitive pressure. M&A activity remains significant, with larger players consolidating their market position through strategic acquisitions.
- Market Concentration: Moderately concentrated, with top 5 players holding approximately 40% market share in 2025 (estimated).
- Technological Innovation: Significant advancements in LED lighting, 5G integration, and sensor technologies are driving market growth.
- Regulatory Landscape: Varying regulations across regions impact deployment costs and timelines.
- Competitive Substitutes: DAS and other distributed infrastructure solutions offer alternatives.
- M&A Activity: xx M&A deals were recorded between 2019 and 2024, with an expected increase in the forecast period.
- End-User Demographics: Municipalities and governments are the largest end-users, driven by smart city initiatives.
Smart Pole Industry Growth Trends & Insights
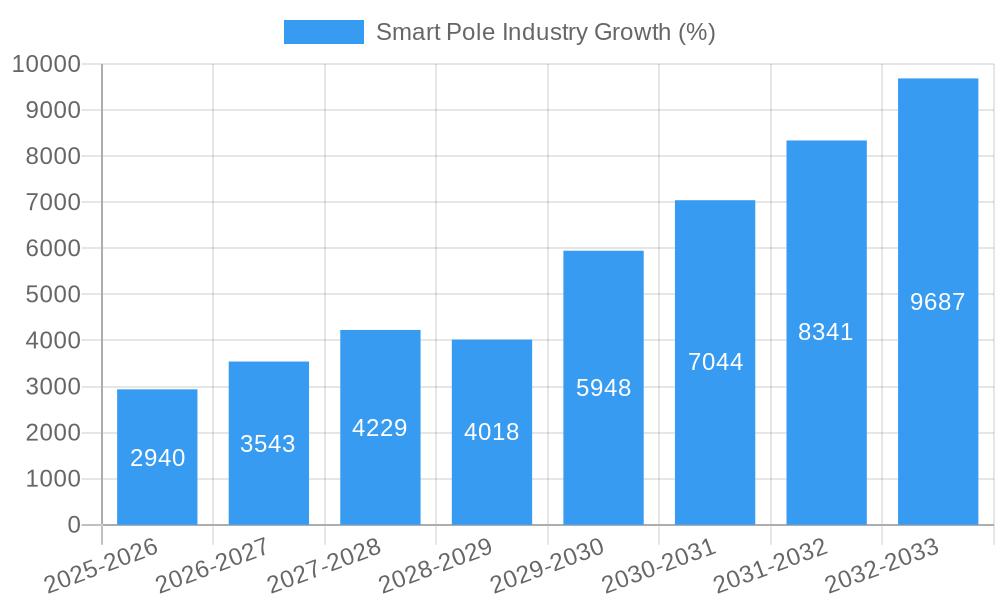
The Smart Pole market experienced substantial growth during the historical period (2019-2024), driven by increasing urbanization, the growing adoption of smart city initiatives, and advancements in IoT technologies. The market is projected to witness a CAGR of xx% during the forecast period (2025-2033), reaching an estimated market size of xx Million by 2033. This growth is fueled by the increasing demand for efficient energy solutions and improved public safety. Technological advancements such as AI-powered analytics and improved data security are driving wider adoption. Consumer behavior shifts towards sustainable and technologically advanced urban infrastructure further propel market expansion. Market penetration is currently estimated at xx% in developed nations and xx% in developing nations, expected to increase significantly in the forecast period.
Dominant Regions, Countries, or Segments in Smart Pole Industry
North America and Europe currently lead the Smart Pole market, driven by robust government investments in smart city infrastructure and advanced technological capabilities. However, the Asia-Pacific region is expected to witness the highest growth rate in the forecast period, fueled by rapid urbanization and rising government support for smart city projects. Within segments, Smart Lighting holds the largest market share by application, followed by Traffic Management. By product type, the Connectivity segment is anticipated to witness the fastest growth.
- North America: High adoption rates due to well-established smart city initiatives and strong government funding.
- Europe: Significant investments in smart city technologies and strong technological advancements.
- Asia-Pacific: Rapid urbanization and government support drive substantial growth potential.
- Leading Segment (by application): Smart Lighting (xx Million in 2025), driven by energy efficiency and improved visibility.
- Fastest Growing Segment (by product type): Connectivity (xx% CAGR), fueled by increasing demand for 5G and IoT integration.
Smart Pole Industry Product Landscape
Smart poles are evolving beyond basic lighting, integrating advanced features like 5G connectivity, environmental sensors (air quality, noise levels), and high-definition surveillance cameras. These integrated solutions offer municipalities enhanced data collection capabilities for improved urban planning, traffic management, and public safety. Key innovations include self-powered poles utilizing solar energy and advanced data analytics platforms for real-time insights. Unique selling propositions include enhanced energy efficiency, improved data security, and ease of integration with existing infrastructure.
Key Drivers, Barriers & Challenges in Smart Pole Industry
Key Drivers: Government initiatives promoting smart city development, increasing demand for energy-efficient lighting, advancements in IoT and 5G technologies, and growing focus on public safety and security.
Key Challenges: High initial investment costs, complex deployment processes, concerns about data privacy and security, and the need for robust cybersecurity measures to prevent potential threats. Supply chain disruptions can impact component availability, impacting project timelines and costs by an estimated xx%. Regulatory hurdles related to infrastructure deployment and data management pose significant challenges.
Emerging Opportunities in Smart Pole Industry
Emerging opportunities include integrating smart poles with electric vehicle (EV) charging stations, integrating advanced sensor technologies for environmental monitoring, and developing data analytics platforms for predictive maintenance and resource optimization. Expansion into untapped markets in developing countries offers significant growth potential. The increasing focus on sustainable and resilient infrastructure presents opportunities for eco-friendly smart pole designs.
Growth Accelerators in the Smart Pole Industry
Long-term growth will be accelerated by technological advancements in sensor integration, AI-driven data analytics, and improved energy storage solutions. Strategic partnerships between technology providers, municipalities, and private entities will be crucial for successful market expansion. Governments play a major role through supportive policies and funding initiatives. Expansion into new applications, such as smart agriculture and industrial IoT, will further drive market expansion.
Key Players Shaping the Smart Pole Industry Market
- Signify Holding BV
- LEDbow Technologies Ltd
- Keselec Lighting Private Limited
- SmartCiti Solutions Inc
- Norsk Hydro ASA
- HUB Group
- Lumca Inc
- Efftronics Systems Pvt Ltd
- Shanghai Sansi Electronic Engineering Co Ltd
- American Tower Corporation
- ELKO EP
- Energasia Smart Poles
- Valmont Structures Pvt Ltd
- ENE HUB Pty Ltd
- Streetscape International
- Iram Technologies Pvt Ltd
Notable Milestones in Smart Pole Industry Sector
- July 2022: ComptekTechnologies collaborates with ZenFiNetworks, CityBridge Consortium, and Antenna Design to develop Link5G smart poles, boosting 5G infrastructure deployment.
- July 2021: Johnson City Commission installs smart poles funded by a USD 335,000 TVA grant, demonstrating successful municipal adoption.
In-Depth Smart Pole Industry Market Outlook
The Smart Pole market is poised for significant growth, driven by continued advancements in IoT, 5G, and AI technologies. Strategic partnerships and government support will play a crucial role in unlocking market potential. Focus on sustainable and integrated solutions will be key to long-term success. The market is expected to witness a shift towards more sophisticated, data-driven solutions with enhanced connectivity and security features. Expanding into underserved markets and developing innovative applications will be crucial for continued market expansion.
Smart Pole Industry Segmentation
- 1. Production Analysis
- 2. Consumption Analysis
- 3. Import Market Analysis (Value & Volume)
- 4. Export Market Analysis (Value & Volume)
- 5. Price Trend Analysis
Smart Pole Industry Segmentation By Geography
- 1. North America
- 2. Europe
- 3. Asia Pacific
- 4. Rest of the World
Smart Pole Industry REPORT HIGHLIGHTS
| Aspects | Details |
|---|---|
| Study Period | 2019-2033 |
| Base Year | 2024 |
| Estimated Year | 2025 |
| Forecast Period | 2025-2033 |
| Historical Period | 2019-2024 |
| Growth Rate | CAGR of 19.40% from 2019-2033 |
| Segmentation |
|
Table of Contents
- 1. Introduction
- 1.1. Research Scope
- 1.2. Market Segmentation
- 1.3. Research Methodology
- 1.4. Definitions and Assumptions
- 2. Executive Summary
- 2.1. Introduction
- 3. Market Dynamics
- 3.1. Introduction
- 3.2. Market Drivers
- 3.2.1. Increasing Need for Reducing Traffic Jams and Preventing Accidents; Growing Initiative by Various Government for Smart Cities
- 3.3. Market Restrains
- 3.3.1. Rising Complexities to Implement Transition from Manual to Software Testing Process
- 3.4. Market Trends
- 3.4.1. Growing Smart City Initiatives by Various Governments
- 4. Market Factor Analysis
- 4.1. Porters Five Forces
- 4.2. Supply/Value Chain
- 4.3. PESTEL analysis
- 4.4. Market Entropy
- 4.5. Patent/Trademark Analysis
- 5. Global Smart Pole Industry Analysis, Insights and Forecast, 2019-2031
- 5.1. Market Analysis, Insights and Forecast - by Production Analysis
- 5.2. Market Analysis, Insights and Forecast - by Consumption Analysis
- 5.3. Market Analysis, Insights and Forecast - by Import Market Analysis (Value & Volume)
- 5.4. Market Analysis, Insights and Forecast - by Export Market Analysis (Value & Volume)
- 5.5. Market Analysis, Insights and Forecast - by Price Trend Analysis
- 5.6. Market Analysis, Insights and Forecast - by Region
- 5.6.1. North America
- 5.6.2. Europe
- 5.6.3. Asia Pacific
- 5.6.4. Rest of the World
- 5.1. Market Analysis, Insights and Forecast - by Production Analysis
- 6. North America Smart Pole Industry Analysis, Insights and Forecast, 2019-2031
- 6.1. Market Analysis, Insights and Forecast - by Production Analysis
- 6.2. Market Analysis, Insights and Forecast - by Consumption Analysis
- 6.3. Market Analysis, Insights and Forecast - by Import Market Analysis (Value & Volume)
- 6.4. Market Analysis, Insights and Forecast - by Export Market Analysis (Value & Volume)
- 6.5. Market Analysis, Insights and Forecast - by Price Trend Analysis
- 6.1. Market Analysis, Insights and Forecast - by Production Analysis
- 7. Europe Smart Pole Industry Analysis, Insights and Forecast, 2019-2031
- 7.1. Market Analysis, Insights and Forecast - by Production Analysis
- 7.2. Market Analysis, Insights and Forecast - by Consumption Analysis
- 7.3. Market Analysis, Insights and Forecast - by Import Market Analysis (Value & Volume)
- 7.4. Market Analysis, Insights and Forecast - by Export Market Analysis (Value & Volume)
- 7.5. Market Analysis, Insights and Forecast - by Price Trend Analysis
- 7.1. Market Analysis, Insights and Forecast - by Production Analysis
- 8. Asia Pacific Smart Pole Industry Analysis, Insights and Forecast, 2019-2031
- 8.1. Market Analysis, Insights and Forecast - by Production Analysis
- 8.2. Market Analysis, Insights and Forecast - by Consumption Analysis
- 8.3. Market Analysis, Insights and Forecast - by Import Market Analysis (Value & Volume)
- 8.4. Market Analysis, Insights and Forecast - by Export Market Analysis (Value & Volume)
- 8.5. Market Analysis, Insights and Forecast - by Price Trend Analysis
- 8.1. Market Analysis, Insights and Forecast - by Production Analysis
- 9. Rest of the World Smart Pole Industry Analysis, Insights and Forecast, 2019-2031
- 9.1. Market Analysis, Insights and Forecast - by Production Analysis
- 9.2. Market Analysis, Insights and Forecast - by Consumption Analysis
- 9.3. Market Analysis, Insights and Forecast - by Import Market Analysis (Value & Volume)
- 9.4. Market Analysis, Insights and Forecast - by Export Market Analysis (Value & Volume)
- 9.5. Market Analysis, Insights and Forecast - by Price Trend Analysis
- 9.1. Market Analysis, Insights and Forecast - by Production Analysis
- 10. North America Smart Pole Industry Analysis, Insights and Forecast, 2019-2031
- 10.1. Market Analysis, Insights and Forecast - By Country/Sub-region
- 10.1.1 United States
- 10.1.2 Canada
- 11. Europe Smart Pole Industry Analysis, Insights and Forecast, 2019-2031
- 11.1. Market Analysis, Insights and Forecast - By Country/Sub-region
- 11.1.1 United Kingdom
- 11.1.2 Germany
- 11.1.3 France
- 11.1.4 Italy
- 11.1.5 Netherlands
- 11.1.6 Rest of Europe
- 12. Asia Pacific Smart Pole Industry Analysis, Insights and Forecast, 2019-2031
- 12.1. Market Analysis, Insights and Forecast - By Country/Sub-region
- 12.1.1 India
- 12.1.2 China
- 12.1.3 Japan
- 12.1.4 South Korea
- 12.1.5 Rest of Asia Pacific
- 13. Asia Pacific Smart Pole Industry Analysis, Insights and Forecast, 2019-2031
- 13.1. Market Analysis, Insights and Forecast - By Country/Sub-region
- 13.1.1 China
- 13.1.2 India
- 13.1.3 Japan
- 13.1.4 Australia
- 13.1.5 Rest of Asia Pacific
- 14. Middle East & Africa Smart Pole Industry Analysis, Insights and Forecast, 2019-2031
- 14.1. Market Analysis, Insights and Forecast - By Country/Sub-region
- 14.1.1 UAE
- 14.1.2 South Africa
- 14.1.3 Saudi Arabia
- 14.1.4 Rest of MEA
- 15. Competitive Analysis
- 15.1. Global Market Share Analysis 2024
- 15.2. Company Profiles
- 15.2.1 Signify Holding BV
- 15.2.1.1. Overview
- 15.2.1.2. Products
- 15.2.1.3. SWOT Analysis
- 15.2.1.4. Recent Developments
- 15.2.1.5. Financials (Based on Availability)
- 15.2.2 LEDbow Technologies Ltd
- 15.2.2.1. Overview
- 15.2.2.2. Products
- 15.2.2.3. SWOT Analysis
- 15.2.2.4. Recent Developments
- 15.2.2.5. Financials (Based on Availability)
- 15.2.3 Keselec Lighting Private Limited
- 15.2.3.1. Overview
- 15.2.3.2. Products
- 15.2.3.3. SWOT Analysis
- 15.2.3.4. Recent Developments
- 15.2.3.5. Financials (Based on Availability)
- 15.2.4 SmartCiti Solutions Inc
- 15.2.4.1. Overview
- 15.2.4.2. Products
- 15.2.4.3. SWOT Analysis
- 15.2.4.4. Recent Developments
- 15.2.4.5. Financials (Based on Availability)
- 15.2.5 Norsk Hydro ASA
- 15.2.5.1. Overview
- 15.2.5.2. Products
- 15.2.5.3. SWOT Analysis
- 15.2.5.4. Recent Developments
- 15.2.5.5. Financials (Based on Availability)
- 15.2.6 HUB Group
- 15.2.6.1. Overview
- 15.2.6.2. Products
- 15.2.6.3. SWOT Analysis
- 15.2.6.4. Recent Developments
- 15.2.6.5. Financials (Based on Availability)
- 15.2.7 Lumca Inc
- 15.2.7.1. Overview
- 15.2.7.2. Products
- 15.2.7.3. SWOT Analysis
- 15.2.7.4. Recent Developments
- 15.2.7.5. Financials (Based on Availability)
- 15.2.8 Efftronics Systems Pvt Ltd
- 15.2.8.1. Overview
- 15.2.8.2. Products
- 15.2.8.3. SWOT Analysis
- 15.2.8.4. Recent Developments
- 15.2.8.5. Financials (Based on Availability)
- 15.2.9 Shanghai Sansi Electronic Engineering Co Ltd
- 15.2.9.1. Overview
- 15.2.9.2. Products
- 15.2.9.3. SWOT Analysis
- 15.2.9.4. Recent Developments
- 15.2.9.5. Financials (Based on Availability)
- 15.2.10 American Tower Corporation
- 15.2.10.1. Overview
- 15.2.10.2. Products
- 15.2.10.3. SWOT Analysis
- 15.2.10.4. Recent Developments
- 15.2.10.5. Financials (Based on Availability)
- 15.2.11 ELKO EP
- 15.2.11.1. Overview
- 15.2.11.2. Products
- 15.2.11.3. SWOT Analysis
- 15.2.11.4. Recent Developments
- 15.2.11.5. Financials (Based on Availability)
- 15.2.12 Energasia Smart Poles
- 15.2.12.1. Overview
- 15.2.12.2. Products
- 15.2.12.3. SWOT Analysis
- 15.2.12.4. Recent Developments
- 15.2.12.5. Financials (Based on Availability)
- 15.2.13 Valmont Structures Pvt Ltd
- 15.2.13.1. Overview
- 15.2.13.2. Products
- 15.2.13.3. SWOT Analysis
- 15.2.13.4. Recent Developments
- 15.2.13.5. Financials (Based on Availability)
- 15.2.14 ENE HUB Pty Ltd*List Not Exhaustive
- 15.2.14.1. Overview
- 15.2.14.2. Products
- 15.2.14.3. SWOT Analysis
- 15.2.14.4. Recent Developments
- 15.2.14.5. Financials (Based on Availability)
- 15.2.15 Streetscape International
- 15.2.15.1. Overview
- 15.2.15.2. Products
- 15.2.15.3. SWOT Analysis
- 15.2.15.4. Recent Developments
- 15.2.15.5. Financials (Based on Availability)
- 15.2.16 Iram Technologies Pvt Ltd
- 15.2.16.1. Overview
- 15.2.16.2. Products
- 15.2.16.3. SWOT Analysis
- 15.2.16.4. Recent Developments
- 15.2.16.5. Financials (Based on Availability)
- 15.2.1 Signify Holding BV
List of Figures
- Figure 1: Global Smart Pole Industry Revenue Breakdown (Million, %) by Region 2024 & 2032
- Figure 2: North America Smart Pole Industry Revenue (Million), by Country 2024 & 2032
- Figure 3: North America Smart Pole Industry Revenue Share (%), by Country 2024 & 2032
- Figure 4: Europe Smart Pole Industry Revenue (Million), by Country 2024 & 2032
- Figure 5: Europe Smart Pole Industry Revenue Share (%), by Country 2024 & 2032
- Figure 6: Asia Pacific Smart Pole Industry Revenue (Million), by Country 2024 & 2032
- Figure 7: Asia Pacific Smart Pole Industry Revenue Share (%), by Country 2024 & 2032
- Figure 8: Asia Pacific Smart Pole Industry Revenue (Million), by Country 2024 & 2032
- Figure 9: Asia Pacific Smart Pole Industry Revenue Share (%), by Country 2024 & 2032
- Figure 10: Middle East & Africa Smart Pole Industry Revenue (Million), by Country 2024 & 2032
- Figure 11: Middle East & Africa Smart Pole Industry Revenue Share (%), by Country 2024 & 2032
- Figure 12: North America Smart Pole Industry Revenue (Million), by Production Analysis 2024 & 2032
- Figure 13: North America Smart Pole Industry Revenue Share (%), by Production Analysis 2024 & 2032
- Figure 14: North America Smart Pole Industry Revenue (Million), by Consumption Analysis 2024 & 2032
- Figure 15: North America Smart Pole Industry Revenue Share (%), by Consumption Analysis 2024 & 2032
- Figure 16: North America Smart Pole Industry Revenue (Million), by Import Market Analysis (Value & Volume) 2024 & 2032
- Figure 17: North America Smart Pole Industry Revenue Share (%), by Import Market Analysis (Value & Volume) 2024 & 2032
- Figure 18: North America Smart Pole Industry Revenue (Million), by Export Market Analysis (Value & Volume) 2024 & 2032
- Figure 19: North America Smart Pole Industry Revenue Share (%), by Export Market Analysis (Value & Volume) 2024 & 2032
- Figure 20: North America Smart Pole Industry Revenue (Million), by Price Trend Analysis 2024 & 2032
- Figure 21: North America Smart Pole Industry Revenue Share (%), by Price Trend Analysis 2024 & 2032
- Figure 22: North America Smart Pole Industry Revenue (Million), by Country 2024 & 2032
- Figure 23: North America Smart Pole Industry Revenue Share (%), by Country 2024 & 2032
- Figure 24: Europe Smart Pole Industry Revenue (Million), by Production Analysis 2024 & 2032
- Figure 25: Europe Smart Pole Industry Revenue Share (%), by Production Analysis 2024 & 2032
- Figure 26: Europe Smart Pole Industry Revenue (Million), by Consumption Analysis 2024 & 2032
- Figure 27: Europe Smart Pole Industry Revenue Share (%), by Consumption Analysis 2024 & 2032
- Figure 28: Europe Smart Pole Industry Revenue (Million), by Import Market Analysis (Value & Volume) 2024 & 2032
- Figure 29: Europe Smart Pole Industry Revenue Share (%), by Import Market Analysis (Value & Volume) 2024 & 2032
- Figure 30: Europe Smart Pole Industry Revenue (Million), by Export Market Analysis (Value & Volume) 2024 & 2032
- Figure 31: Europe Smart Pole Industry Revenue Share (%), by Export Market Analysis (Value & Volume) 2024 & 2032
- Figure 32: Europe Smart Pole Industry Revenue (Million), by Price Trend Analysis 2024 & 2032
- Figure 33: Europe Smart Pole Industry Revenue Share (%), by Price Trend Analysis 2024 & 2032
- Figure 34: Europe Smart Pole Industry Revenue (Million), by Country 2024 & 2032
- Figure 35: Europe Smart Pole Industry Revenue Share (%), by Country 2024 & 2032
- Figure 36: Asia Pacific Smart Pole Industry Revenue (Million), by Production Analysis 2024 & 2032
- Figure 37: Asia Pacific Smart Pole Industry Revenue Share (%), by Production Analysis 2024 & 2032
- Figure 38: Asia Pacific Smart Pole Industry Revenue (Million), by Consumption Analysis 2024 & 2032
- Figure 39: Asia Pacific Smart Pole Industry Revenue Share (%), by Consumption Analysis 2024 & 2032
- Figure 40: Asia Pacific Smart Pole Industry Revenue (Million), by Import Market Analysis (Value & Volume) 2024 & 2032
- Figure 41: Asia Pacific Smart Pole Industry Revenue Share (%), by Import Market Analysis (Value & Volume) 2024 & 2032
- Figure 42: Asia Pacific Smart Pole Industry Revenue (Million), by Export Market Analysis (Value & Volume) 2024 & 2032
- Figure 43: Asia Pacific Smart Pole Industry Revenue Share (%), by Export Market Analysis (Value & Volume) 2024 & 2032
- Figure 44: Asia Pacific Smart Pole Industry Revenue (Million), by Price Trend Analysis 2024 & 2032
- Figure 45: Asia Pacific Smart Pole Industry Revenue Share (%), by Price Trend Analysis 2024 & 2032
- Figure 46: Asia Pacific Smart Pole Industry Revenue (Million), by Country 2024 & 2032
- Figure 47: Asia Pacific Smart Pole Industry Revenue Share (%), by Country 2024 & 2032
- Figure 48: Rest of the World Smart Pole Industry Revenue (Million), by Production Analysis 2024 & 2032
- Figure 49: Rest of the World Smart Pole Industry Revenue Share (%), by Production Analysis 2024 & 2032
- Figure 50: Rest of the World Smart Pole Industry Revenue (Million), by Consumption Analysis 2024 & 2032
- Figure 51: Rest of the World Smart Pole Industry Revenue Share (%), by Consumption Analysis 2024 & 2032
- Figure 52: Rest of the World Smart Pole Industry Revenue (Million), by Import Market Analysis (Value & Volume) 2024 & 2032
- Figure 53: Rest of the World Smart Pole Industry Revenue Share (%), by Import Market Analysis (Value & Volume) 2024 & 2032
- Figure 54: Rest of the World Smart Pole Industry Revenue (Million), by Export Market Analysis (Value & Volume) 2024 & 2032
- Figure 55: Rest of the World Smart Pole Industry Revenue Share (%), by Export Market Analysis (Value & Volume) 2024 & 2032
- Figure 56: Rest of the World Smart Pole Industry Revenue (Million), by Price Trend Analysis 2024 & 2032
- Figure 57: Rest of the World Smart Pole Industry Revenue Share (%), by Price Trend Analysis 2024 & 2032
- Figure 58: Rest of the World Smart Pole Industry Revenue (Million), by Country 2024 & 2032
- Figure 59: Rest of the World Smart Pole Industry Revenue Share (%), by Country 2024 & 2032
List of Tables
- Table 1: Global Smart Pole Industry Revenue Million Forecast, by Region 2019 & 2032
- Table 2: Global Smart Pole Industry Revenue Million Forecast, by Production Analysis 2019 & 2032
- Table 3: Global Smart Pole Industry Revenue Million Forecast, by Consumption Analysis 2019 & 2032
- Table 4: Global Smart Pole Industry Revenue Million Forecast, by Import Market Analysis (Value & Volume) 2019 & 2032
- Table 5: Global Smart Pole Industry Revenue Million Forecast, by Export Market Analysis (Value & Volume) 2019 & 2032
- Table 6: Global Smart Pole Industry Revenue Million Forecast, by Price Trend Analysis 2019 & 2032
- Table 7: Global Smart Pole Industry Revenue Million Forecast, by Region 2019 & 2032
- Table 8: Global Smart Pole Industry Revenue Million Forecast, by Country 2019 & 2032
- Table 9: United States Smart Pole Industry Revenue (Million) Forecast, by Application 2019 & 2032
- Table 10: Canada Smart Pole Industry Revenue (Million) Forecast, by Application 2019 & 2032
- Table 11: Global Smart Pole Industry Revenue Million Forecast, by Country 2019 & 2032
- Table 12: United Kingdom Smart Pole Industry Revenue (Million) Forecast, by Application 2019 & 2032
- Table 13: Germany Smart Pole Industry Revenue (Million) Forecast, by Application 2019 & 2032
- Table 14: France Smart Pole Industry Revenue (Million) Forecast, by Application 2019 & 2032
- Table 15: Italy Smart Pole Industry Revenue (Million) Forecast, by Application 2019 & 2032
- Table 16: Netherlands Smart Pole Industry Revenue (Million) Forecast, by Application 2019 & 2032
- Table 17: Rest of Europe Smart Pole Industry Revenue (Million) Forecast, by Application 2019 & 2032
- Table 18: Global Smart Pole Industry Revenue Million Forecast, by Country 2019 & 2032
- Table 19: India Smart Pole Industry Revenue (Million) Forecast, by Application 2019 & 2032
- Table 20: China Smart Pole Industry Revenue (Million) Forecast, by Application 2019 & 2032
- Table 21: Japan Smart Pole Industry Revenue (Million) Forecast, by Application 2019 & 2032
- Table 22: South Korea Smart Pole Industry Revenue (Million) Forecast, by Application 2019 & 2032
- Table 23: Rest of Asia Pacific Smart Pole Industry Revenue (Million) Forecast, by Application 2019 & 2032
- Table 24: Global Smart Pole Industry Revenue Million Forecast, by Country 2019 & 2032
- Table 25: China Smart Pole Industry Revenue (Million) Forecast, by Application 2019 & 2032
- Table 26: India Smart Pole Industry Revenue (Million) Forecast, by Application 2019 & 2032
- Table 27: Japan Smart Pole Industry Revenue (Million) Forecast, by Application 2019 & 2032
- Table 28: Australia Smart Pole Industry Revenue (Million) Forecast, by Application 2019 & 2032
- Table 29: Rest of Asia Pacific Smart Pole Industry Revenue (Million) Forecast, by Application 2019 & 2032
- Table 30: Global Smart Pole Industry Revenue Million Forecast, by Country 2019 & 2032
- Table 31: UAE Smart Pole Industry Revenue (Million) Forecast, by Application 2019 & 2032
- Table 32: South Africa Smart Pole Industry Revenue (Million) Forecast, by Application 2019 & 2032
- Table 33: Saudi Arabia Smart Pole Industry Revenue (Million) Forecast, by Application 2019 & 2032
- Table 34: Rest of MEA Smart Pole Industry Revenue (Million) Forecast, by Application 2019 & 2032
- Table 35: Global Smart Pole Industry Revenue Million Forecast, by Production Analysis 2019 & 2032
- Table 36: Global Smart Pole Industry Revenue Million Forecast, by Consumption Analysis 2019 & 2032
- Table 37: Global Smart Pole Industry Revenue Million Forecast, by Import Market Analysis (Value & Volume) 2019 & 2032
- Table 38: Global Smart Pole Industry Revenue Million Forecast, by Export Market Analysis (Value & Volume) 2019 & 2032
- Table 39: Global Smart Pole Industry Revenue Million Forecast, by Price Trend Analysis 2019 & 2032
- Table 40: Global Smart Pole Industry Revenue Million Forecast, by Country 2019 & 2032
- Table 41: Global Smart Pole Industry Revenue Million Forecast, by Production Analysis 2019 & 2032
- Table 42: Global Smart Pole Industry Revenue Million Forecast, by Consumption Analysis 2019 & 2032
- Table 43: Global Smart Pole Industry Revenue Million Forecast, by Import Market Analysis (Value & Volume) 2019 & 2032
- Table 44: Global Smart Pole Industry Revenue Million Forecast, by Export Market Analysis (Value & Volume) 2019 & 2032
- Table 45: Global Smart Pole Industry Revenue Million Forecast, by Price Trend Analysis 2019 & 2032
- Table 46: Global Smart Pole Industry Revenue Million Forecast, by Country 2019 & 2032
- Table 47: Global Smart Pole Industry Revenue Million Forecast, by Production Analysis 2019 & 2032
- Table 48: Global Smart Pole Industry Revenue Million Forecast, by Consumption Analysis 2019 & 2032
- Table 49: Global Smart Pole Industry Revenue Million Forecast, by Import Market Analysis (Value & Volume) 2019 & 2032
- Table 50: Global Smart Pole Industry Revenue Million Forecast, by Export Market Analysis (Value & Volume) 2019 & 2032
- Table 51: Global Smart Pole Industry Revenue Million Forecast, by Price Trend Analysis 2019 & 2032
- Table 52: Global Smart Pole Industry Revenue Million Forecast, by Country 2019 & 2032
- Table 53: Global Smart Pole Industry Revenue Million Forecast, by Production Analysis 2019 & 2032
- Table 54: Global Smart Pole Industry Revenue Million Forecast, by Consumption Analysis 2019 & 2032
- Table 55: Global Smart Pole Industry Revenue Million Forecast, by Import Market Analysis (Value & Volume) 2019 & 2032
- Table 56: Global Smart Pole Industry Revenue Million Forecast, by Export Market Analysis (Value & Volume) 2019 & 2032
- Table 57: Global Smart Pole Industry Revenue Million Forecast, by Price Trend Analysis 2019 & 2032
- Table 58: Global Smart Pole Industry Revenue Million Forecast, by Country 2019 & 2032
Frequently Asked Questions
1. What is the projected Compound Annual Growth Rate (CAGR) of the Smart Pole Industry?
The projected CAGR is approximately 19.40%.
2. Which companies are prominent players in the Smart Pole Industry?
Key companies in the market include Signify Holding BV, LEDbow Technologies Ltd, Keselec Lighting Private Limited, SmartCiti Solutions Inc, Norsk Hydro ASA, HUB Group, Lumca Inc, Efftronics Systems Pvt Ltd, Shanghai Sansi Electronic Engineering Co Ltd, American Tower Corporation, ELKO EP, Energasia Smart Poles, Valmont Structures Pvt Ltd, ENE HUB Pty Ltd*List Not Exhaustive, Streetscape International, Iram Technologies Pvt Ltd.
3. What are the main segments of the Smart Pole Industry?
The market segments include Production Analysis, Consumption Analysis, Import Market Analysis (Value & Volume), Export Market Analysis (Value & Volume), Price Trend Analysis.
4. Can you provide details about the market size?
The market size is estimated to be USD XX Million as of 2022.
5. What are some drivers contributing to market growth?
Increasing Need for Reducing Traffic Jams and Preventing Accidents; Growing Initiative by Various Government for Smart Cities.
6. What are the notable trends driving market growth?
Growing Smart City Initiatives by Various Governments.
7. Are there any restraints impacting market growth?
Rising Complexities to Implement Transition from Manual to Software Testing Process.
8. Can you provide examples of recent developments in the market?
July 2022 - ComptekTechnologies (Comptek), an Aero Wireless Group Company, collaborated with ZenFiNetworks, the CityBridgeConsortium, and Antenna Design to develop Link5G smart poles. In line with this initiative, the company aims to support the smart city initiative by deploying its infrastructure products and services in the region. Such initiatives by the companies are expected to drive the smart pole market during the study period.
9. What pricing options are available for accessing the report?
Pricing options include single-user, multi-user, and enterprise licenses priced at USD 4750, USD 5250, and USD 8750 respectively.
10. Is the market size provided in terms of value or volume?
The market size is provided in terms of value, measured in Million.
11. Are there any specific market keywords associated with the report?
Yes, the market keyword associated with the report is "Smart Pole Industry," which aids in identifying and referencing the specific market segment covered.
12. How do I determine which pricing option suits my needs best?
The pricing options vary based on user requirements and access needs. Individual users may opt for single-user licenses, while businesses requiring broader access may choose multi-user or enterprise licenses for cost-effective access to the report.
13. Are there any additional resources or data provided in the Smart Pole Industry report?
While the report offers comprehensive insights, it's advisable to review the specific contents or supplementary materials provided to ascertain if additional resources or data are available.
14. How can I stay updated on further developments or reports in the Smart Pole Industry?
To stay informed about further developments, trends, and reports in the Smart Pole Industry, consider subscribing to industry newsletters, following relevant companies and organizations, or regularly checking reputable industry news sources and publications.
Methodology
Step 1 - Identification of Relevant Samples Size from Population Database


Step 2 - Approaches for Defining Global Market Size (Value, Volume* & Price*)

Note*: In applicable scenarios
Step 3 - Data Sources
Primary Research
- Web Analytics
- Survey Reports
- Research Institute
- Latest Research Reports
- Opinion Leaders
Secondary Research
- Annual Reports
- White Paper
- Latest Press Release
- Industry Association
- Paid Database
- Investor Presentations

Step 4 - Data Triangulation
Involves using different sources of information in order to increase the validity of a study
These sources are likely to be stakeholders in a program - participants, other researchers, program staff, other community members, and so on.
Then we put all data in single framework & apply various statistical tools to find out the dynamic on the market.
During the analysis stage, feedback from the stakeholder groups would be compared to determine areas of agreement as well as areas of divergence


