
Key Insights
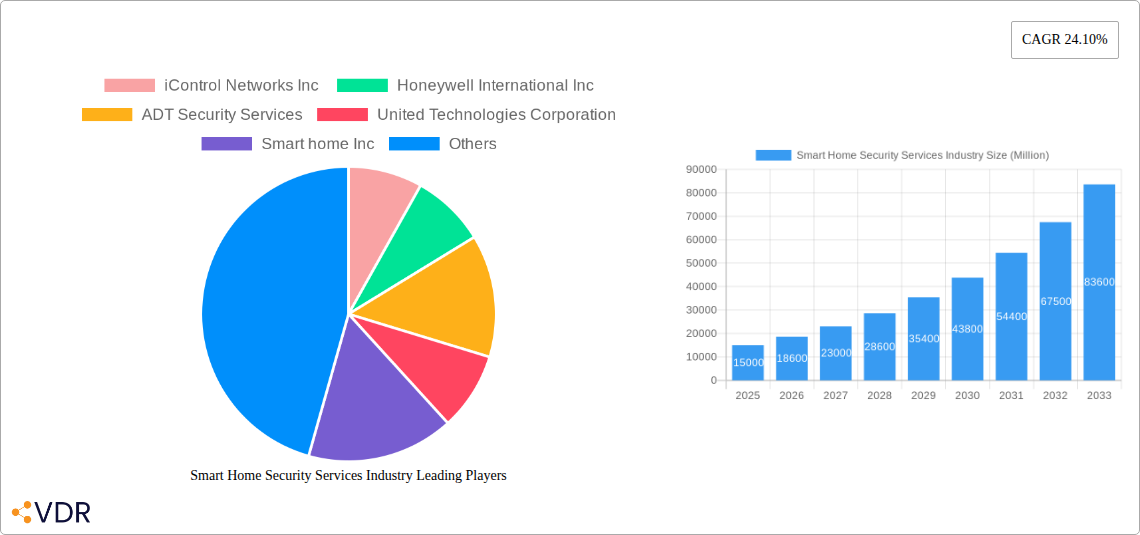
The smart home security services market is experiencing robust growth, driven by increasing consumer demand for enhanced safety and convenience. The market's compound annual growth rate (CAGR) of 24.10% from 2019 to 2024 indicates significant expansion, a trend projected to continue through 2033. Several factors contribute to this growth. Rising cybersecurity concerns, coupled with the increasing affordability and accessibility of smart home technology, are key drivers. Consumers are increasingly adopting integrated systems encompassing video surveillance, access control, and automation features, facilitated by professional and self-installation options. The market segmentation reflects this diversity, with video surveillance and professional installations holding significant market share, but self-installation gaining traction due to ease of use and lower costs. Leading players like iControl Networks, Honeywell, ADT, and others are actively innovating to cater to this expanding market, introducing advanced features such as AI-powered threat detection and seamless integration with other smart home devices. Geographic distribution shows strong performance across North America and Europe, but the Asia-Pacific region displays high growth potential, fueled by rising disposable incomes and technological advancements.
The continued growth in the smart home security sector is likely to be influenced by several key trends. The adoption of IoT (Internet of Things) devices and improved connectivity are driving further integration and sophistication within home security systems. The development of advanced analytics and AI for threat detection, personalized security solutions, and proactive risk mitigation will become increasingly important. Furthermore, the rising popularity of subscription-based services, offering ongoing monitoring and maintenance, provides a recurring revenue stream for providers and contributes to market expansion. However, challenges remain, including concerns about data privacy and security, the need for robust cybersecurity measures, and the potential for higher installation costs associated with more complex systems. Despite these challenges, the market’s positive trajectory driven by user demand for enhanced security and convenience is expected to persist throughout the forecast period.
Smart Home Security Services Industry Report: 2019-2033
This comprehensive report provides a detailed analysis of the Smart Home Security Services industry, encompassing market dynamics, growth trends, key players, and future outlook. The study period covers 2019-2033, with 2025 as the base and estimated year. The report segments the market by product (Video Surveillance, Access Control), installation (Professional Installation, Self-installation), and geographical regions, offering invaluable insights for industry professionals, investors, and strategic decision-makers. The parent market is the broader home security industry, while the child market focuses specifically on the smart home security segment leveraging internet connectivity and advanced technologies.
Smart Home Security Services Industry Market Dynamics & Structure
The smart home security services market is characterized by moderate concentration, with key players like Honeywell International Inc, ADT Security Services, and Vivint Inc holding significant market share. However, the market exhibits robust competition from smaller, specialized firms and technology entrants. Technological innovation, particularly in AI-powered surveillance, smart locks, and cloud-based security management systems, is a primary driver. Regulatory frameworks concerning data privacy and cybersecurity are shaping industry practices. The rise of DIY security solutions presents a competitive substitute, while the increasing affordability and accessibility of smart home technology drives market expansion.
- Market Concentration: Moderately concentrated, with top 5 players accounting for approximately xx% of the market in 2024 (estimated).
- Technological Innovation: AI-powered analytics, IoT integration, and enhanced cybersecurity features are key drivers.
- Regulatory Landscape: Data privacy regulations (e.g., GDPR, CCPA) are influencing product development and data handling practices.
- Competitive Substitutes: DIY security systems and traditional security services represent competitive threats.
- End-User Demographics: Growing adoption among homeowners, particularly millennials and Gen Z, fueled by convenience and security concerns.
- M&A Activity: An average of xx M&A deals per year were observed during the historical period (2019-2024), indicating consolidation in the sector.
Smart Home Security Services Industry Growth Trends & Insights
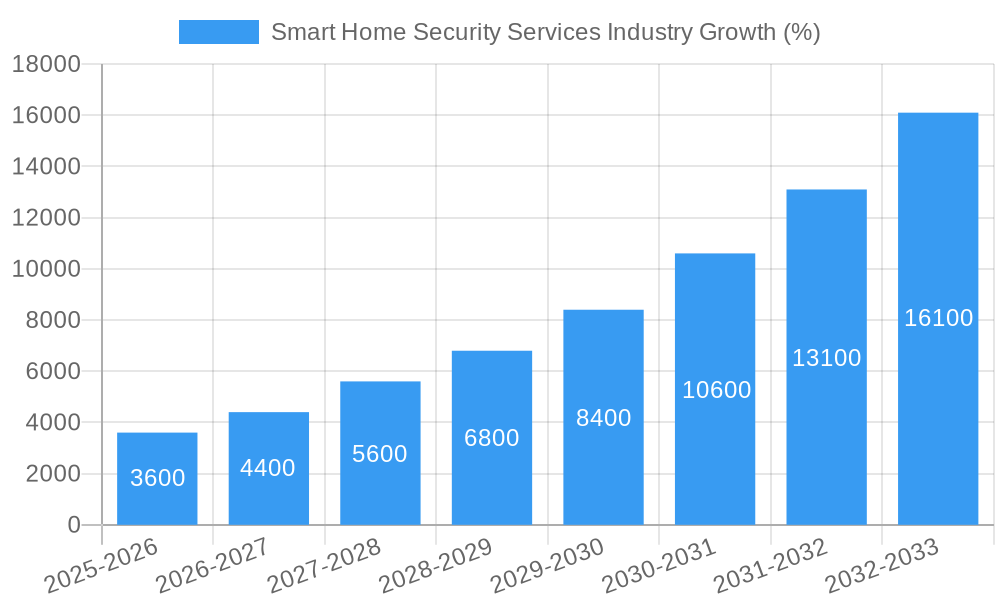
The smart home security services market experienced robust growth during the historical period (2019-2024), with a CAGR of xx%. The market size is projected to reach xx million units by 2025 and is forecast to continue expanding at a CAGR of xx% during 2025-2033. This growth is primarily driven by increasing consumer awareness of home security threats, rising disposable incomes, and technological advancements offering enhanced security features at competitive prices. Market penetration is increasing across various demographics, with higher adoption rates in urban areas compared to rural regions. Technological disruptions, such as the rise of AI-powered video analytics and cloud-based platforms, are transforming the industry landscape, leading to more sophisticated and user-friendly security solutions. The shift in consumer behavior towards smart home technologies and the preference for integrated solutions is also contributing significantly to the market's growth.
Dominant Regions, Countries, or Segments in Smart Home Security Services Industry
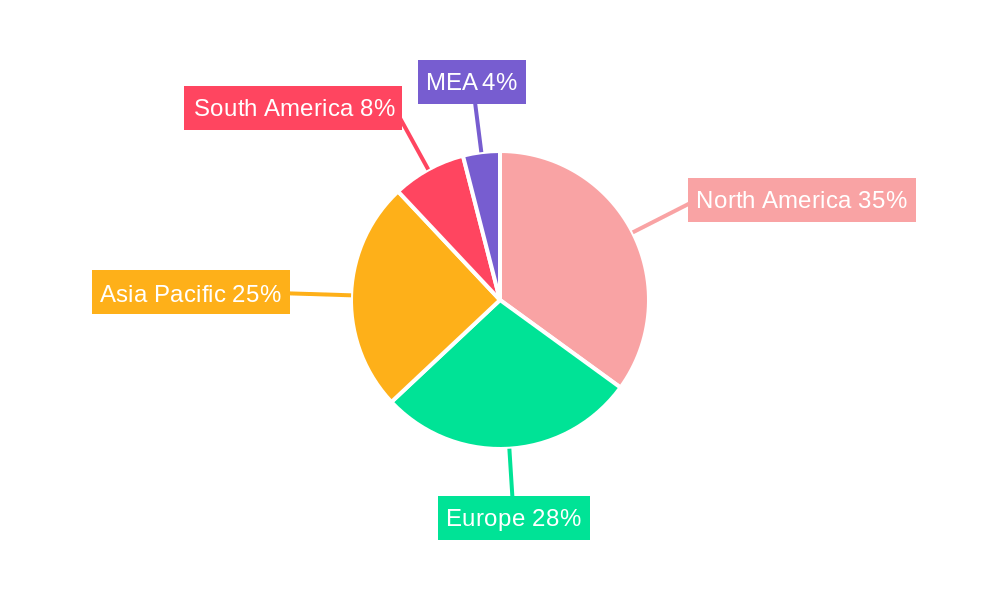
North America currently dominates the smart home security services market, driven by high levels of technology adoption, robust infrastructure, and a well-established security services sector. Within North America, the US holds the largest market share, fueled by factors such as high disposable incomes, advanced technological infrastructure, and strong consumer preference for home automation solutions. The European market is also showing significant growth, although fragmented across countries due to varying regulatory landscapes and technological adoption rates. The Asia-Pacific region is expected to witness considerable growth in the coming years, driven by rapid urbanization, increasing disposable incomes, and rising awareness regarding home security concerns.
- Key Drivers in North America: High disposable incomes, advanced technology adoption, strong consumer preference for home automation.
- Challenges in Europe: Fragmentation of the market due to varied regulatory landscapes and differences in consumer preferences across countries.
- Growth Potential in Asia-Pacific: Rapid urbanization, increasing middle class, rising awareness of home security concerns.
- Product Segment Dominance: Video Surveillance currently holds the largest market share, followed by Access Control, with both segments experiencing strong growth. Professional Installation services have a larger market share than Self-installation; however, Self-installation is growing at a faster rate.
Smart Home Security Services Industry Product Landscape
The smart home security services market offers a diverse range of products, including video surveillance systems with advanced analytics (e.g., facial recognition, intrusion detection), smart locks with biometric access control, and integrated security platforms connecting various devices through a centralized app. These products increasingly feature AI-powered capabilities like automated alerts, remote monitoring, and proactive security measures. Unique selling propositions center on ease of use, integration with existing smart home ecosystems, and enhanced security features driven by artificial intelligence and machine learning.
Key Drivers, Barriers & Challenges in Smart Home Security Services Industry
Key Drivers: Rising consumer demand for home security, increasing adoption of smart home technologies, advancements in AI and IoT, government initiatives promoting smart city development, and favorable economic conditions.
Challenges: High initial investment costs for smart home security systems, concerns about data privacy and cybersecurity, complexities of system integration, and competition from emerging technologies. Supply chain disruptions caused a xx% increase in material costs during 2022-2023, impacting profitability. Regulatory hurdles related to data privacy and cybersecurity compliance also pose significant challenges.
Emerging Opportunities in Smart Home Security Services Industry
Untapped markets in developing economies present significant growth opportunities. The integration of smart home security with other smart home functionalities (e.g., lighting, appliances) is expected to drive adoption. Personalized security services tailored to individual consumer needs, such as enhanced elderly care monitoring or small business security solutions, are creating new market segments.
Growth Accelerators in the Smart Home Security Services Industry
Technological breakthroughs, particularly in AI and IoT, are crucial growth catalysts. Strategic partnerships between security providers and smart home device manufacturers are facilitating wider market penetration. Expansion into new geographical markets, particularly in developing economies, offers significant growth potential. The growing adoption of cloud-based solutions and the expansion of 5G networks are enhancing connectivity and scalability.
Key Players Shaping the Smart Home Security Services Market
- Honeywell International Inc
- ADT Security Services
- United Technologies Corporation
- Smart home Inc
- Comcast Corporation
- Vivint Inc
- Tyco Security Products
- Control4 Corporation
- AT&T Inc
- iControl Networks Inc
Notable Milestones in Smart Home Security Services Industry Sector
- June 2020: Swann launched the Swann Wire-Free Security Camera, a DIY wireless camera with face recognition and cloud/local storage. This boosted the DIY segment's growth.
- September 2020: Hangzhou Hikvision launched Hik-ProConnect, a cloud-based security service solution integrating various devices. This promoted market consolidation and professional service adoption.
In-Depth Smart Home Security Services Industry Market Outlook
The smart home security services market is poised for sustained growth driven by technological advancements, increasing consumer demand, and expanding market penetration. Strategic partnerships and innovative business models will be key to success. The focus on AI-powered analytics, enhanced cybersecurity measures, and seamless integration with other smart home technologies will shape future market dynamics. The market's long-term potential is significant, presenting attractive opportunities for existing players and new entrants alike.
Smart Home Security Services Industry Segmentation
-
1. Product
-
1.1. Video Surveillance
- 1.1.1. Security Cameras
- 1.1.2. Monitors
- 1.1.3. Storage Devices
- 1.1.4. Others
-
1.2. Access Control
- 1.2.1. Facial Recognition
- 1.2.2. Fingerprint Recognition
- 1.2.3. Iris Recognition
-
1.1. Video Surveillance
-
2. Installation
- 2.1. Professional Installation
- 2.2. Self-installation
Smart Home Security Services Industry Segmentation By Geography
-
1. North America
- 1.1. United States
- 1.2. Canada
-
2. Europe
- 2.1. United Kingdom
- 2.2. Germany
- 2.3. France
- 2.4. Rest of Europe
-
3. Asia Pacific
- 3.1. China
- 3.2. Japan
- 3.3. India
- 3.4. Rest of Asia Pacific
-
4. Middle East and Africa
- 4.1. Saudi Arabia
- 4.2. United Arab Emirates
- 4.3. Rest of Middle East and Africa
-
5. Latin America
- 5.1. Brazil
- 5.2. Mexico
- 5.3. Rest of Latin America
Smart Home Security Services Industry REPORT HIGHLIGHTS
| Aspects | Details |
|---|---|
| Study Period | 2019-2033 |
| Base Year | 2024 |
| Estimated Year | 2025 |
| Forecast Period | 2025-2033 |
| Historical Period | 2019-2024 |
| Growth Rate | CAGR of 24.10% from 2019-2033 |
| Segmentation |
|
Table of Contents
- 1. Introduction
- 1.1. Research Scope
- 1.2. Market Segmentation
- 1.3. Research Methodology
- 1.4. Definitions and Assumptions
- 2. Executive Summary
- 2.1. Introduction
- 3. Market Dynamics
- 3.1. Introduction
- 3.2. Market Drivers
- 3.2.1. Growing Safety Concerns; Decreasing Costs of Sensors
- 3.3. Market Restrains
- 3.3.1. High Installation Costs
- 3.4. Market Trends
- 3.4.1. Video Surveillance systems are expected to register significant growth in forecasted period
- 4. Market Factor Analysis
- 4.1. Porters Five Forces
- 4.2. Supply/Value Chain
- 4.3. PESTEL analysis
- 4.4. Market Entropy
- 4.5. Patent/Trademark Analysis
- 5. Global Smart Home Security Services Industry Analysis, Insights and Forecast, 2019-2031
- 5.1. Market Analysis, Insights and Forecast - by Product
- 5.1.1. Video Surveillance
- 5.1.1.1. Security Cameras
- 5.1.1.2. Monitors
- 5.1.1.3. Storage Devices
- 5.1.1.4. Others
- 5.1.2. Access Control
- 5.1.2.1. Facial Recognition
- 5.1.2.2. Fingerprint Recognition
- 5.1.2.3. Iris Recognition
- 5.1.1. Video Surveillance
- 5.2. Market Analysis, Insights and Forecast - by Installation
- 5.2.1. Professional Installation
- 5.2.2. Self-installation
- 5.3. Market Analysis, Insights and Forecast - by Region
- 5.3.1. North America
- 5.3.2. Europe
- 5.3.3. Asia Pacific
- 5.3.4. Middle East and Africa
- 5.3.5. Latin America
- 5.1. Market Analysis, Insights and Forecast - by Product
- 6. North America Smart Home Security Services Industry Analysis, Insights and Forecast, 2019-2031
- 6.1. Market Analysis, Insights and Forecast - by Product
- 6.1.1. Video Surveillance
- 6.1.1.1. Security Cameras
- 6.1.1.2. Monitors
- 6.1.1.3. Storage Devices
- 6.1.1.4. Others
- 6.1.2. Access Control
- 6.1.2.1. Facial Recognition
- 6.1.2.2. Fingerprint Recognition
- 6.1.2.3. Iris Recognition
- 6.1.1. Video Surveillance
- 6.2. Market Analysis, Insights and Forecast - by Installation
- 6.2.1. Professional Installation
- 6.2.2. Self-installation
- 6.1. Market Analysis, Insights and Forecast - by Product
- 7. Europe Smart Home Security Services Industry Analysis, Insights and Forecast, 2019-2031
- 7.1. Market Analysis, Insights and Forecast - by Product
- 7.1.1. Video Surveillance
- 7.1.1.1. Security Cameras
- 7.1.1.2. Monitors
- 7.1.1.3. Storage Devices
- 7.1.1.4. Others
- 7.1.2. Access Control
- 7.1.2.1. Facial Recognition
- 7.1.2.2. Fingerprint Recognition
- 7.1.2.3. Iris Recognition
- 7.1.1. Video Surveillance
- 7.2. Market Analysis, Insights and Forecast - by Installation
- 7.2.1. Professional Installation
- 7.2.2. Self-installation
- 7.1. Market Analysis, Insights and Forecast - by Product
- 8. Asia Pacific Smart Home Security Services Industry Analysis, Insights and Forecast, 2019-2031
- 8.1. Market Analysis, Insights and Forecast - by Product
- 8.1.1. Video Surveillance
- 8.1.1.1. Security Cameras
- 8.1.1.2. Monitors
- 8.1.1.3. Storage Devices
- 8.1.1.4. Others
- 8.1.2. Access Control
- 8.1.2.1. Facial Recognition
- 8.1.2.2. Fingerprint Recognition
- 8.1.2.3. Iris Recognition
- 8.1.1. Video Surveillance
- 8.2. Market Analysis, Insights and Forecast - by Installation
- 8.2.1. Professional Installation
- 8.2.2. Self-installation
- 8.1. Market Analysis, Insights and Forecast - by Product
- 9. Middle East and Africa Smart Home Security Services Industry Analysis, Insights and Forecast, 2019-2031
- 9.1. Market Analysis, Insights and Forecast - by Product
- 9.1.1. Video Surveillance
- 9.1.1.1. Security Cameras
- 9.1.1.2. Monitors
- 9.1.1.3. Storage Devices
- 9.1.1.4. Others
- 9.1.2. Access Control
- 9.1.2.1. Facial Recognition
- 9.1.2.2. Fingerprint Recognition
- 9.1.2.3. Iris Recognition
- 9.1.1. Video Surveillance
- 9.2. Market Analysis, Insights and Forecast - by Installation
- 9.2.1. Professional Installation
- 9.2.2. Self-installation
- 9.1. Market Analysis, Insights and Forecast - by Product
- 10. Latin America Smart Home Security Services Industry Analysis, Insights and Forecast, 2019-2031
- 10.1. Market Analysis, Insights and Forecast - by Product
- 10.1.1. Video Surveillance
- 10.1.1.1. Security Cameras
- 10.1.1.2. Monitors
- 10.1.1.3. Storage Devices
- 10.1.1.4. Others
- 10.1.2. Access Control
- 10.1.2.1. Facial Recognition
- 10.1.2.2. Fingerprint Recognition
- 10.1.2.3. Iris Recognition
- 10.1.1. Video Surveillance
- 10.2. Market Analysis, Insights and Forecast - by Installation
- 10.2.1. Professional Installation
- 10.2.2. Self-installation
- 10.1. Market Analysis, Insights and Forecast - by Product
- 11. North America Smart Home Security Services Industry Analysis, Insights and Forecast, 2019-2031
- 11.1. Market Analysis, Insights and Forecast - By Country/Sub-region
- 11.1.1. undefined
- 12. Europe Smart Home Security Services Industry Analysis, Insights and Forecast, 2019-2031
- 12.1. Market Analysis, Insights and Forecast - By Country/Sub-region
- 12.1.1. undefined
- 13. Asia Pacific Smart Home Security Services Industry Analysis, Insights and Forecast, 2019-2031
- 13.1. Market Analysis, Insights and Forecast - By Country/Sub-region
- 13.1.1. undefined
- 14. South America Smart Home Security Services Industry Analysis, Insights and Forecast, 2019-2031
- 14.1. Market Analysis, Insights and Forecast - By Country/Sub-region
- 14.1.1. undefined
- 15. North America Smart Home Security Services Industry Analysis, Insights and Forecast, 2019-2031
- 15.1. Market Analysis, Insights and Forecast - By Country/Sub-region
- 15.1.1. undefined
- 16. MEA Smart Home Security Services Industry Analysis, Insights and Forecast, 2019-2031
- 16.1. Market Analysis, Insights and Forecast - By Country/Sub-region
- 16.1.1. undefined
- 17. Competitive Analysis
- 17.1. Global Market Share Analysis 2024
- 17.2. Company Profiles
- 17.2.1 iControl Networks Inc
- 17.2.1.1. Overview
- 17.2.1.2. Products
- 17.2.1.3. SWOT Analysis
- 17.2.1.4. Recent Developments
- 17.2.1.5. Financials (Based on Availability)
- 17.2.2 Honeywell International Inc
- 17.2.2.1. Overview
- 17.2.2.2. Products
- 17.2.2.3. SWOT Analysis
- 17.2.2.4. Recent Developments
- 17.2.2.5. Financials (Based on Availability)
- 17.2.3 ADT Security Services
- 17.2.3.1. Overview
- 17.2.3.2. Products
- 17.2.3.3. SWOT Analysis
- 17.2.3.4. Recent Developments
- 17.2.3.5. Financials (Based on Availability)
- 17.2.4 United Technologies Corporation
- 17.2.4.1. Overview
- 17.2.4.2. Products
- 17.2.4.3. SWOT Analysis
- 17.2.4.4. Recent Developments
- 17.2.4.5. Financials (Based on Availability)
- 17.2.5 Smart home Inc
- 17.2.5.1. Overview
- 17.2.5.2. Products
- 17.2.5.3. SWOT Analysis
- 17.2.5.4. Recent Developments
- 17.2.5.5. Financials (Based on Availability)
- 17.2.6 Comcast Corporation
- 17.2.6.1. Overview
- 17.2.6.2. Products
- 17.2.6.3. SWOT Analysis
- 17.2.6.4. Recent Developments
- 17.2.6.5. Financials (Based on Availability)
- 17.2.7 Vivint Inc
- 17.2.7.1. Overview
- 17.2.7.2. Products
- 17.2.7.3. SWOT Analysis
- 17.2.7.4. Recent Developments
- 17.2.7.5. Financials (Based on Availability)
- 17.2.8 Tyco Security Products
- 17.2.8.1. Overview
- 17.2.8.2. Products
- 17.2.8.3. SWOT Analysis
- 17.2.8.4. Recent Developments
- 17.2.8.5. Financials (Based on Availability)
- 17.2.9 Control4 Corporation
- 17.2.9.1. Overview
- 17.2.9.2. Products
- 17.2.9.3. SWOT Analysis
- 17.2.9.4. Recent Developments
- 17.2.9.5. Financials (Based on Availability)
- 17.2.10 AT&T Inc
- 17.2.10.1. Overview
- 17.2.10.2. Products
- 17.2.10.3. SWOT Analysis
- 17.2.10.4. Recent Developments
- 17.2.10.5. Financials (Based on Availability)
- 17.2.1 iControl Networks Inc
List of Figures
- Figure 1: Global Smart Home Security Services Industry Revenue Breakdown (Million, %) by Region 2024 & 2032
- Figure 2: Global Smart Home Security Services Industry Volume Breakdown (K Unit, %) by Region 2024 & 2032
- Figure 3: North America Smart Home Security Services Industry Revenue (Million), by Country 2024 & 2032
- Figure 4: North America Smart Home Security Services Industry Volume (K Unit), by Country 2024 & 2032
- Figure 5: North America Smart Home Security Services Industry Revenue Share (%), by Country 2024 & 2032
- Figure 6: North America Smart Home Security Services Industry Volume Share (%), by Country 2024 & 2032
- Figure 7: Europe Smart Home Security Services Industry Revenue (Million), by Country 2024 & 2032
- Figure 8: Europe Smart Home Security Services Industry Volume (K Unit), by Country 2024 & 2032
- Figure 9: Europe Smart Home Security Services Industry Revenue Share (%), by Country 2024 & 2032
- Figure 10: Europe Smart Home Security Services Industry Volume Share (%), by Country 2024 & 2032
- Figure 11: Asia Pacific Smart Home Security Services Industry Revenue (Million), by Country 2024 & 2032
- Figure 12: Asia Pacific Smart Home Security Services Industry Volume (K Unit), by Country 2024 & 2032
- Figure 13: Asia Pacific Smart Home Security Services Industry Revenue Share (%), by Country 2024 & 2032
- Figure 14: Asia Pacific Smart Home Security Services Industry Volume Share (%), by Country 2024 & 2032
- Figure 15: South America Smart Home Security Services Industry Revenue (Million), by Country 2024 & 2032
- Figure 16: South America Smart Home Security Services Industry Volume (K Unit), by Country 2024 & 2032
- Figure 17: South America Smart Home Security Services Industry Revenue Share (%), by Country 2024 & 2032
- Figure 18: South America Smart Home Security Services Industry Volume Share (%), by Country 2024 & 2032
- Figure 19: North America Smart Home Security Services Industry Revenue (Million), by Country 2024 & 2032
- Figure 20: North America Smart Home Security Services Industry Volume (K Unit), by Country 2024 & 2032
- Figure 21: North America Smart Home Security Services Industry Revenue Share (%), by Country 2024 & 2032
- Figure 22: North America Smart Home Security Services Industry Volume Share (%), by Country 2024 & 2032
- Figure 23: MEA Smart Home Security Services Industry Revenue (Million), by Country 2024 & 2032
- Figure 24: MEA Smart Home Security Services Industry Volume (K Unit), by Country 2024 & 2032
- Figure 25: MEA Smart Home Security Services Industry Revenue Share (%), by Country 2024 & 2032
- Figure 26: MEA Smart Home Security Services Industry Volume Share (%), by Country 2024 & 2032
- Figure 27: North America Smart Home Security Services Industry Revenue (Million), by Product 2024 & 2032
- Figure 28: North America Smart Home Security Services Industry Volume (K Unit), by Product 2024 & 2032
- Figure 29: North America Smart Home Security Services Industry Revenue Share (%), by Product 2024 & 2032
- Figure 30: North America Smart Home Security Services Industry Volume Share (%), by Product 2024 & 2032
- Figure 31: North America Smart Home Security Services Industry Revenue (Million), by Installation 2024 & 2032
- Figure 32: North America Smart Home Security Services Industry Volume (K Unit), by Installation 2024 & 2032
- Figure 33: North America Smart Home Security Services Industry Revenue Share (%), by Installation 2024 & 2032
- Figure 34: North America Smart Home Security Services Industry Volume Share (%), by Installation 2024 & 2032
- Figure 35: North America Smart Home Security Services Industry Revenue (Million), by Country 2024 & 2032
- Figure 36: North America Smart Home Security Services Industry Volume (K Unit), by Country 2024 & 2032
- Figure 37: North America Smart Home Security Services Industry Revenue Share (%), by Country 2024 & 2032
- Figure 38: North America Smart Home Security Services Industry Volume Share (%), by Country 2024 & 2032
- Figure 39: Europe Smart Home Security Services Industry Revenue (Million), by Product 2024 & 2032
- Figure 40: Europe Smart Home Security Services Industry Volume (K Unit), by Product 2024 & 2032
- Figure 41: Europe Smart Home Security Services Industry Revenue Share (%), by Product 2024 & 2032
- Figure 42: Europe Smart Home Security Services Industry Volume Share (%), by Product 2024 & 2032
- Figure 43: Europe Smart Home Security Services Industry Revenue (Million), by Installation 2024 & 2032
- Figure 44: Europe Smart Home Security Services Industry Volume (K Unit), by Installation 2024 & 2032
- Figure 45: Europe Smart Home Security Services Industry Revenue Share (%), by Installation 2024 & 2032
- Figure 46: Europe Smart Home Security Services Industry Volume Share (%), by Installation 2024 & 2032
- Figure 47: Europe Smart Home Security Services Industry Revenue (Million), by Country 2024 & 2032
- Figure 48: Europe Smart Home Security Services Industry Volume (K Unit), by Country 2024 & 2032
- Figure 49: Europe Smart Home Security Services Industry Revenue Share (%), by Country 2024 & 2032
- Figure 50: Europe Smart Home Security Services Industry Volume Share (%), by Country 2024 & 2032
- Figure 51: Asia Pacific Smart Home Security Services Industry Revenue (Million), by Product 2024 & 2032
- Figure 52: Asia Pacific Smart Home Security Services Industry Volume (K Unit), by Product 2024 & 2032
- Figure 53: Asia Pacific Smart Home Security Services Industry Revenue Share (%), by Product 2024 & 2032
- Figure 54: Asia Pacific Smart Home Security Services Industry Volume Share (%), by Product 2024 & 2032
- Figure 55: Asia Pacific Smart Home Security Services Industry Revenue (Million), by Installation 2024 & 2032
- Figure 56: Asia Pacific Smart Home Security Services Industry Volume (K Unit), by Installation 2024 & 2032
- Figure 57: Asia Pacific Smart Home Security Services Industry Revenue Share (%), by Installation 2024 & 2032
- Figure 58: Asia Pacific Smart Home Security Services Industry Volume Share (%), by Installation 2024 & 2032
- Figure 59: Asia Pacific Smart Home Security Services Industry Revenue (Million), by Country 2024 & 2032
- Figure 60: Asia Pacific Smart Home Security Services Industry Volume (K Unit), by Country 2024 & 2032
- Figure 61: Asia Pacific Smart Home Security Services Industry Revenue Share (%), by Country 2024 & 2032
- Figure 62: Asia Pacific Smart Home Security Services Industry Volume Share (%), by Country 2024 & 2032
- Figure 63: Middle East and Africa Smart Home Security Services Industry Revenue (Million), by Product 2024 & 2032
- Figure 64: Middle East and Africa Smart Home Security Services Industry Volume (K Unit), by Product 2024 & 2032
- Figure 65: Middle East and Africa Smart Home Security Services Industry Revenue Share (%), by Product 2024 & 2032
- Figure 66: Middle East and Africa Smart Home Security Services Industry Volume Share (%), by Product 2024 & 2032
- Figure 67: Middle East and Africa Smart Home Security Services Industry Revenue (Million), by Installation 2024 & 2032
- Figure 68: Middle East and Africa Smart Home Security Services Industry Volume (K Unit), by Installation 2024 & 2032
- Figure 69: Middle East and Africa Smart Home Security Services Industry Revenue Share (%), by Installation 2024 & 2032
- Figure 70: Middle East and Africa Smart Home Security Services Industry Volume Share (%), by Installation 2024 & 2032
- Figure 71: Middle East and Africa Smart Home Security Services Industry Revenue (Million), by Country 2024 & 2032
- Figure 72: Middle East and Africa Smart Home Security Services Industry Volume (K Unit), by Country 2024 & 2032
- Figure 73: Middle East and Africa Smart Home Security Services Industry Revenue Share (%), by Country 2024 & 2032
- Figure 74: Middle East and Africa Smart Home Security Services Industry Volume Share (%), by Country 2024 & 2032
- Figure 75: Latin America Smart Home Security Services Industry Revenue (Million), by Product 2024 & 2032
- Figure 76: Latin America Smart Home Security Services Industry Volume (K Unit), by Product 2024 & 2032
- Figure 77: Latin America Smart Home Security Services Industry Revenue Share (%), by Product 2024 & 2032
- Figure 78: Latin America Smart Home Security Services Industry Volume Share (%), by Product 2024 & 2032
- Figure 79: Latin America Smart Home Security Services Industry Revenue (Million), by Installation 2024 & 2032
- Figure 80: Latin America Smart Home Security Services Industry Volume (K Unit), by Installation 2024 & 2032
- Figure 81: Latin America Smart Home Security Services Industry Revenue Share (%), by Installation 2024 & 2032
- Figure 82: Latin America Smart Home Security Services Industry Volume Share (%), by Installation 2024 & 2032
- Figure 83: Latin America Smart Home Security Services Industry Revenue (Million), by Country 2024 & 2032
- Figure 84: Latin America Smart Home Security Services Industry Volume (K Unit), by Country 2024 & 2032
- Figure 85: Latin America Smart Home Security Services Industry Revenue Share (%), by Country 2024 & 2032
- Figure 86: Latin America Smart Home Security Services Industry Volume Share (%), by Country 2024 & 2032
List of Tables
- Table 1: Global Smart Home Security Services Industry Revenue Million Forecast, by Region 2019 & 2032
- Table 2: Global Smart Home Security Services Industry Volume K Unit Forecast, by Region 2019 & 2032
- Table 3: Global Smart Home Security Services Industry Revenue Million Forecast, by Product 2019 & 2032
- Table 4: Global Smart Home Security Services Industry Volume K Unit Forecast, by Product 2019 & 2032
- Table 5: Global Smart Home Security Services Industry Revenue Million Forecast, by Installation 2019 & 2032
- Table 6: Global Smart Home Security Services Industry Volume K Unit Forecast, by Installation 2019 & 2032
- Table 7: Global Smart Home Security Services Industry Revenue Million Forecast, by Region 2019 & 2032
- Table 8: Global Smart Home Security Services Industry Volume K Unit Forecast, by Region 2019 & 2032
- Table 9: Global Smart Home Security Services Industry Revenue Million Forecast, by Country 2019 & 2032
- Table 10: Global Smart Home Security Services Industry Volume K Unit Forecast, by Country 2019 & 2032
- Table 11: Global Smart Home Security Services Industry Revenue Million Forecast, by Country 2019 & 2032
- Table 12: Global Smart Home Security Services Industry Volume K Unit Forecast, by Country 2019 & 2032
- Table 13: Global Smart Home Security Services Industry Revenue Million Forecast, by Country 2019 & 2032
- Table 14: Global Smart Home Security Services Industry Volume K Unit Forecast, by Country 2019 & 2032
- Table 15: Global Smart Home Security Services Industry Revenue Million Forecast, by Country 2019 & 2032
- Table 16: Global Smart Home Security Services Industry Volume K Unit Forecast, by Country 2019 & 2032
- Table 17: Global Smart Home Security Services Industry Revenue Million Forecast, by Country 2019 & 2032
- Table 18: Global Smart Home Security Services Industry Volume K Unit Forecast, by Country 2019 & 2032
- Table 19: Global Smart Home Security Services Industry Revenue Million Forecast, by Country 2019 & 2032
- Table 20: Global Smart Home Security Services Industry Volume K Unit Forecast, by Country 2019 & 2032
- Table 21: Global Smart Home Security Services Industry Revenue Million Forecast, by Product 2019 & 2032
- Table 22: Global Smart Home Security Services Industry Volume K Unit Forecast, by Product 2019 & 2032
- Table 23: Global Smart Home Security Services Industry Revenue Million Forecast, by Installation 2019 & 2032
- Table 24: Global Smart Home Security Services Industry Volume K Unit Forecast, by Installation 2019 & 2032
- Table 25: Global Smart Home Security Services Industry Revenue Million Forecast, by Country 2019 & 2032
- Table 26: Global Smart Home Security Services Industry Volume K Unit Forecast, by Country 2019 & 2032
- Table 27: United States Smart Home Security Services Industry Revenue (Million) Forecast, by Application 2019 & 2032
- Table 28: United States Smart Home Security Services Industry Volume (K Unit) Forecast, by Application 2019 & 2032
- Table 29: Canada Smart Home Security Services Industry Revenue (Million) Forecast, by Application 2019 & 2032
- Table 30: Canada Smart Home Security Services Industry Volume (K Unit) Forecast, by Application 2019 & 2032
- Table 31: Global Smart Home Security Services Industry Revenue Million Forecast, by Product 2019 & 2032
- Table 32: Global Smart Home Security Services Industry Volume K Unit Forecast, by Product 2019 & 2032
- Table 33: Global Smart Home Security Services Industry Revenue Million Forecast, by Installation 2019 & 2032
- Table 34: Global Smart Home Security Services Industry Volume K Unit Forecast, by Installation 2019 & 2032
- Table 35: Global Smart Home Security Services Industry Revenue Million Forecast, by Country 2019 & 2032
- Table 36: Global Smart Home Security Services Industry Volume K Unit Forecast, by Country 2019 & 2032
- Table 37: United Kingdom Smart Home Security Services Industry Revenue (Million) Forecast, by Application 2019 & 2032
- Table 38: United Kingdom Smart Home Security Services Industry Volume (K Unit) Forecast, by Application 2019 & 2032
- Table 39: Germany Smart Home Security Services Industry Revenue (Million) Forecast, by Application 2019 & 2032
- Table 40: Germany Smart Home Security Services Industry Volume (K Unit) Forecast, by Application 2019 & 2032
- Table 41: France Smart Home Security Services Industry Revenue (Million) Forecast, by Application 2019 & 2032
- Table 42: France Smart Home Security Services Industry Volume (K Unit) Forecast, by Application 2019 & 2032
- Table 43: Rest of Europe Smart Home Security Services Industry Revenue (Million) Forecast, by Application 2019 & 2032
- Table 44: Rest of Europe Smart Home Security Services Industry Volume (K Unit) Forecast, by Application 2019 & 2032
- Table 45: Global Smart Home Security Services Industry Revenue Million Forecast, by Product 2019 & 2032
- Table 46: Global Smart Home Security Services Industry Volume K Unit Forecast, by Product 2019 & 2032
- Table 47: Global Smart Home Security Services Industry Revenue Million Forecast, by Installation 2019 & 2032
- Table 48: Global Smart Home Security Services Industry Volume K Unit Forecast, by Installation 2019 & 2032
- Table 49: Global Smart Home Security Services Industry Revenue Million Forecast, by Country 2019 & 2032
- Table 50: Global Smart Home Security Services Industry Volume K Unit Forecast, by Country 2019 & 2032
- Table 51: China Smart Home Security Services Industry Revenue (Million) Forecast, by Application 2019 & 2032
- Table 52: China Smart Home Security Services Industry Volume (K Unit) Forecast, by Application 2019 & 2032
- Table 53: Japan Smart Home Security Services Industry Revenue (Million) Forecast, by Application 2019 & 2032
- Table 54: Japan Smart Home Security Services Industry Volume (K Unit) Forecast, by Application 2019 & 2032
- Table 55: India Smart Home Security Services Industry Revenue (Million) Forecast, by Application 2019 & 2032
- Table 56: India Smart Home Security Services Industry Volume (K Unit) Forecast, by Application 2019 & 2032
- Table 57: Rest of Asia Pacific Smart Home Security Services Industry Revenue (Million) Forecast, by Application 2019 & 2032
- Table 58: Rest of Asia Pacific Smart Home Security Services Industry Volume (K Unit) Forecast, by Application 2019 & 2032
- Table 59: Global Smart Home Security Services Industry Revenue Million Forecast, by Product 2019 & 2032
- Table 60: Global Smart Home Security Services Industry Volume K Unit Forecast, by Product 2019 & 2032
- Table 61: Global Smart Home Security Services Industry Revenue Million Forecast, by Installation 2019 & 2032
- Table 62: Global Smart Home Security Services Industry Volume K Unit Forecast, by Installation 2019 & 2032
- Table 63: Global Smart Home Security Services Industry Revenue Million Forecast, by Country 2019 & 2032
- Table 64: Global Smart Home Security Services Industry Volume K Unit Forecast, by Country 2019 & 2032
- Table 65: Saudi Arabia Smart Home Security Services Industry Revenue (Million) Forecast, by Application 2019 & 2032
- Table 66: Saudi Arabia Smart Home Security Services Industry Volume (K Unit) Forecast, by Application 2019 & 2032
- Table 67: United Arab Emirates Smart Home Security Services Industry Revenue (Million) Forecast, by Application 2019 & 2032
- Table 68: United Arab Emirates Smart Home Security Services Industry Volume (K Unit) Forecast, by Application 2019 & 2032
- Table 69: Rest of Middle East and Africa Smart Home Security Services Industry Revenue (Million) Forecast, by Application 2019 & 2032
- Table 70: Rest of Middle East and Africa Smart Home Security Services Industry Volume (K Unit) Forecast, by Application 2019 & 2032
- Table 71: Global Smart Home Security Services Industry Revenue Million Forecast, by Product 2019 & 2032
- Table 72: Global Smart Home Security Services Industry Volume K Unit Forecast, by Product 2019 & 2032
- Table 73: Global Smart Home Security Services Industry Revenue Million Forecast, by Installation 2019 & 2032
- Table 74: Global Smart Home Security Services Industry Volume K Unit Forecast, by Installation 2019 & 2032
- Table 75: Global Smart Home Security Services Industry Revenue Million Forecast, by Country 2019 & 2032
- Table 76: Global Smart Home Security Services Industry Volume K Unit Forecast, by Country 2019 & 2032
- Table 77: Brazil Smart Home Security Services Industry Revenue (Million) Forecast, by Application 2019 & 2032
- Table 78: Brazil Smart Home Security Services Industry Volume (K Unit) Forecast, by Application 2019 & 2032
- Table 79: Mexico Smart Home Security Services Industry Revenue (Million) Forecast, by Application 2019 & 2032
- Table 80: Mexico Smart Home Security Services Industry Volume (K Unit) Forecast, by Application 2019 & 2032
- Table 81: Rest of Latin America Smart Home Security Services Industry Revenue (Million) Forecast, by Application 2019 & 2032
- Table 82: Rest of Latin America Smart Home Security Services Industry Volume (K Unit) Forecast, by Application 2019 & 2032
Frequently Asked Questions
1. What is the projected Compound Annual Growth Rate (CAGR) of the Smart Home Security Services Industry?
The projected CAGR is approximately 24.10%.
2. Which companies are prominent players in the Smart Home Security Services Industry?
Key companies in the market include iControl Networks Inc , Honeywell International Inc, ADT Security Services, United Technologies Corporation, Smart home Inc, Comcast Corporation, Vivint Inc, Tyco Security Products, Control4 Corporation, AT&T Inc.
3. What are the main segments of the Smart Home Security Services Industry?
The market segments include Product, Installation.
4. Can you provide details about the market size?
The market size is estimated to be USD XX Million as of 2022.
5. What are some drivers contributing to market growth?
Growing Safety Concerns; Decreasing Costs of Sensors.
6. What are the notable trends driving market growth?
Video Surveillance systems are expected to register significant growth in forecasted period.
7. Are there any restraints impacting market growth?
High Installation Costs.
8. Can you provide examples of recent developments in the market?
June 2020: Swann, engaged in providing do-it-yourself security solutions, announced the release of the Swann Wire-Free Security Camera, a new, completely wireless camera that can be set up in seconds and used for monitoring indoors or outdoors in homes. The camera is stocked with modern smart security features, including free face recognition and cloud or local storage.
9. What pricing options are available for accessing the report?
Pricing options include single-user, multi-user, and enterprise licenses priced at USD 4750, USD 5250, and USD 8750 respectively.
10. Is the market size provided in terms of value or volume?
The market size is provided in terms of value, measured in Million and volume, measured in K Unit.
11. Are there any specific market keywords associated with the report?
Yes, the market keyword associated with the report is "Smart Home Security Services Industry," which aids in identifying and referencing the specific market segment covered.
12. How do I determine which pricing option suits my needs best?
The pricing options vary based on user requirements and access needs. Individual users may opt for single-user licenses, while businesses requiring broader access may choose multi-user or enterprise licenses for cost-effective access to the report.
13. Are there any additional resources or data provided in the Smart Home Security Services Industry report?
While the report offers comprehensive insights, it's advisable to review the specific contents or supplementary materials provided to ascertain if additional resources or data are available.
14. How can I stay updated on further developments or reports in the Smart Home Security Services Industry?
To stay informed about further developments, trends, and reports in the Smart Home Security Services Industry, consider subscribing to industry newsletters, following relevant companies and organizations, or regularly checking reputable industry news sources and publications.
Methodology
Step 1 - Identification of Relevant Samples Size from Population Database


Step 2 - Approaches for Defining Global Market Size (Value, Volume* & Price*)

Note*: In applicable scenarios
Step 3 - Data Sources
Primary Research
- Web Analytics
- Survey Reports
- Research Institute
- Latest Research Reports
- Opinion Leaders
Secondary Research
- Annual Reports
- White Paper
- Latest Press Release
- Industry Association
- Paid Database
- Investor Presentations

Step 4 - Data Triangulation
Involves using different sources of information in order to increase the validity of a study
These sources are likely to be stakeholders in a program - participants, other researchers, program staff, other community members, and so on.
Then we put all data in single framework & apply various statistical tools to find out the dynamic on the market.
During the analysis stage, feedback from the stakeholder groups would be compared to determine areas of agreement as well as areas of divergence


