
Key Insights
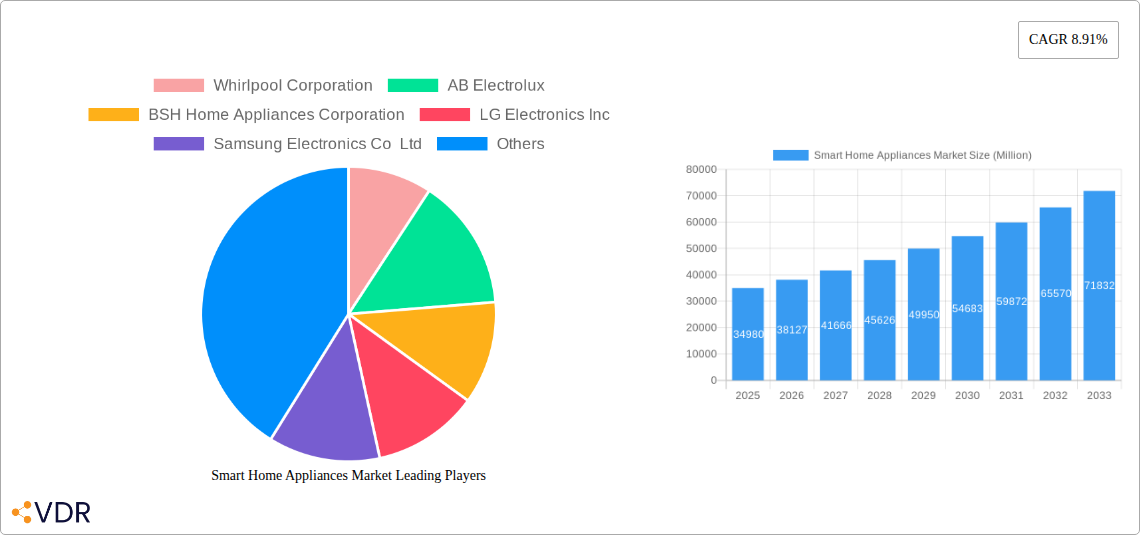
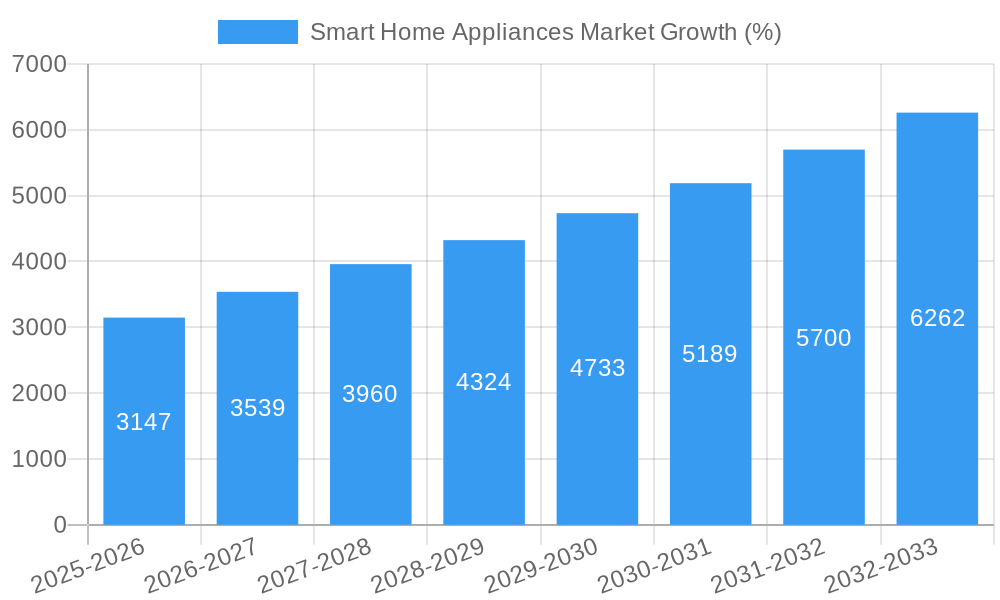
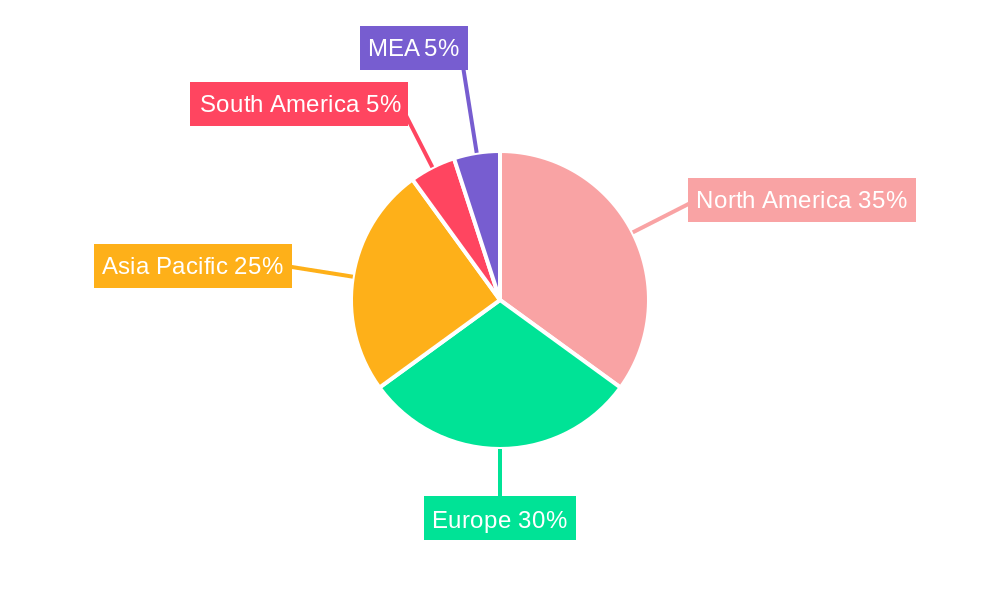
The global smart home appliances market, valued at $34.98 billion in 2025, is experiencing robust growth, projected to expand at a compound annual growth rate (CAGR) of 8.91% from 2025 to 2033. This surge is driven by several key factors. Increasing consumer adoption of smart home technology, fueled by the desire for convenience, energy efficiency, and enhanced home management, is a primary driver. The integration of smart features like voice assistants, app control, and remote monitoring significantly enhances user experience, driving demand. Furthermore, technological advancements leading to improved functionalities, increased connectivity options, and more affordable pricing are making smart appliances accessible to a broader consumer base. The market's segmentation reveals strong growth across various product categories, with smart refrigerators, ovens, and dishwashers currently leading the way. However, the burgeoning smart cookware and cooktop segments hold significant future potential as technology evolves and consumer preferences shift towards enhanced culinary experiences. Geographic distribution shows North America and Europe as presently dominant markets, but the Asia-Pacific region, especially China and India, is expected to witness exponential growth driven by rising disposable incomes and increasing urbanization.
Continued expansion of the smart home appliances market is anticipated due to several factors. The rise of the Internet of Things (IoT) and its seamless integration with smart appliances promises a more interconnected and automated home environment. Furthermore, the increasing focus on energy conservation and sustainability is further boosting demand for energy-efficient smart appliances. However, potential restraints include the relatively higher initial cost of smart appliances compared to their traditional counterparts and concerns related to data privacy and security. Manufacturers are actively addressing these concerns by implementing robust security protocols and offering flexible financing options to encourage wider adoption. The competitive landscape is characterized by a mix of established players like Whirlpool, LG, and Samsung, along with innovative smaller companies focusing on niche products and technologies. This competition is driving innovation and pushing down prices, further propelling market growth.
This in-depth report provides a comprehensive analysis of the Smart Home Appliances market, encompassing market dynamics, growth trends, regional analysis, product landscape, key players, and future outlook. The study period covers 2019-2033, with 2025 as the base year and a forecast period of 2025-2033. The report is invaluable for industry professionals, investors, and anyone seeking to understand this rapidly evolving market. Market size is presented in Million units.
Smart Home Appliances Market Dynamics & Structure
The Smart Home Appliances market is characterized by moderate concentration, with key players such as Whirlpool Corporation, AB Electrolux, BSH Home Appliances Corporation, LG Electronics Inc, Samsung Electronics Co Ltd, Breville Group Limited, Haier Group, and Panasonic Corporation vying for market share. Technological innovation, particularly in areas like AI-powered controls, energy efficiency, and connectivity, is a significant driver. Stringent energy efficiency regulations in various regions are shaping product development and consumer choices. Competitive substitutes, such as traditional appliances, pose a challenge, while the growing adoption of smart home ecosystems and the rise of IoT platforms create significant opportunities. M&A activity within the market has been moderate (xx deals in the past 5 years, resulting in xx% market share consolidation), reflecting strategic moves to expand product portfolios and enhance technological capabilities. Consumer demographics, with a strong focus on millennial and Gen Z preferences for convenience and connected devices, significantly impact market growth.
- Market Concentration: Moderately concentrated, with top 8 players holding xx% market share in 2024.
- Technological Innovation: AI-powered controls, energy efficiency improvements, enhanced connectivity are key drivers.
- Regulatory Frameworks: Energy efficiency standards are increasing, influencing product development and consumer demand.
- Competitive Substitutes: Traditional appliances offer a cost-effective alternative, posing a competitive challenge.
- End-User Demographics: Millennials and Gen Z are key adopters, driven by convenience and technological integration.
- M&A Trends: Moderate activity, primarily focused on expanding product portfolios and strengthening technological capabilities.
Smart Home Appliances Market Growth Trends & Insights
The Smart Home Appliances market has exhibited robust growth (xx% CAGR) during the historical period (2019-2024). This growth is driven by increasing consumer disposable incomes, rising adoption of smart home technology, and the proliferation of smart home ecosystems. Technological disruptions, such as the integration of AI and machine learning, are enhancing product functionality and user experience, accelerating market adoption. Consumer behavior is shifting towards greater demand for energy-efficient, connected appliances that offer convenience and improved lifestyle. The market penetration rate for smart home appliances is expected to reach xx% by 2033, driven by increasing affordability and awareness. The forecast period (2025-2033) projects a continued growth trajectory, with a projected CAGR of xx%, reflecting ongoing technological advancements and increasing consumer demand.
Dominant Regions, Countries, or Segments in Smart Home Appliances Market
North America currently holds the largest market share (xx%) in the smart home appliances market, driven by high consumer disposable incomes and early adoption of smart home technologies. Europe follows closely, with xx% market share, while Asia-Pacific is experiencing the fastest growth rate (xx% CAGR). Within product types, Smart Refrigerators represent the largest segment (xx million units in 2024), followed by Smart Dishwashers (xx million units) and Smart Ovens (xx million units).
- North America: High consumer spending and early adoption of smart technologies drive market dominance.
- Europe: Significant market share, with steady growth driven by rising consumer demand for smart home solutions.
- Asia-Pacific: Fastest-growing region, fueled by increasing disposable incomes and expanding urbanization.
- Product Type Segmentation: Smart Refrigerators dominate, followed by Smart Dishwashers and Smart Ovens.
- Key Drivers: High consumer spending, technological advancements, and government incentives contribute to regional dominance.
Smart Home Appliances Market Product Landscape
The smart home appliance landscape is marked by continuous innovation, focusing on enhancing connectivity, energy efficiency, and user experience. Products incorporate features such as voice control, remote monitoring, and app-based management, providing users with seamless integration into their smart homes. Key performance metrics include energy consumption, cleaning efficiency (for dishwashers), cooking precision (for ovens), and overall user satisfaction. Unique selling propositions frequently emphasize features such as AI-powered recipe suggestions (smart ovens), automated cleaning cycles (smart dishwashers), and inventory management (smart refrigerators).
Key Drivers, Barriers & Challenges in Smart Home Appliances Market
Key Drivers: Rising disposable incomes, increasing demand for convenience and enhanced functionality, technological advancements like AI and IoT integration, and supportive government policies promoting energy efficiency drive market growth. For example, tax incentives for energy-efficient appliances significantly impact adoption rates.
Challenges & Restraints: High initial costs of smart appliances remain a barrier to entry for many consumers. Concerns about data privacy and cybersecurity are significant hurdles. Supply chain disruptions and component shortages can limit production and negatively impact market expansion. Furthermore, the competitive landscape with numerous players vying for market share creates intense price competition.
Emerging Opportunities in Smart Home Appliances Market
Untapped markets in developing economies present significant opportunities for expansion. The integration of smart home appliances with other smart home ecosystems offers significant potential for growth. Evolving consumer preferences for sustainability are driving demand for energy-efficient and eco-friendly appliances. Innovative applications such as smart kitchen appliances capable of personalized cooking experiences or smart laundry systems with advanced stain detection are gaining traction.
Growth Accelerators in the Smart Home Appliances Market Industry
Technological advancements in AI, IoT, and connectivity are accelerating market growth. Strategic partnerships between appliance manufacturers and technology companies facilitate product innovation and market penetration. Expansion strategies focusing on emerging markets and untapped consumer segments drive further growth. Government initiatives aimed at promoting smart home adoption, along with increased consumer awareness of the benefits of smart home technology, serve as further catalysts.
Key Players Shaping the Smart Home Appliances Market Market
- Whirlpool Corporation
- AB Electrolux
- BSH Home Appliances Corporation
- LG Electronics Inc
- Samsung Electronics Co Ltd
- Breville Group Limited
- Haier Group
- Panasonic Corporation
Notable Milestones in Smart Home Appliances Market Sector
- September 2022: LG Electronics launches its MoodUP refrigerator with color-changing LED panels, targeting younger consumers with a focus on design and technology integration.
- August 2022: Enphase Energy partners with Home Connect, integrating solar energy systems with smart home appliances for enhanced energy efficiency.
- February 2022: Godrej & Boyce launches a line of luxury air conditioners with IoT controls, UVCool technology, and advanced air purification, targeting tech-savvy consumers.
In-Depth Smart Home Appliances Market Market Outlook
The Smart Home Appliances market is poised for significant growth over the forecast period, driven by ongoing technological innovation, increasing consumer adoption, and expansion into new markets. Strategic partnerships and collaborations between manufacturers and technology companies will play a crucial role in driving innovation and market penetration. Focusing on developing energy-efficient and sustainable appliances will be key to long-term success, aligning with evolving consumer preferences and environmental concerns. The integration of smart home appliances into broader smart home ecosystems will unlock significant growth potential, offering users a seamless and interconnected living experience.
Smart Home Appliances Market Segmentation
-
1. Product Type
- 1.1. Smart Ovens
- 1.2. Smart Dishwashers
- 1.3. Smart Refrigerators
- 1.4. Smart Cookware and Cooktops
- 1.5. Smart Scale and Thermometers
- 1.6. Other Product Types
Smart Home Appliances Market Segmentation By Geography
-
1. North America
- 1.1. United States
- 1.2. Canada
-
2. Europe
- 2.1. Germany
- 2.2. United Kingdom
- 2.3. France
- 2.4. Spain
-
3. Asia
- 3.1. China
- 3.2. Japan
- 4. Australia and New Zealand
- 5. Latin America
- 6. Middle East and Africa
Smart Home Appliances Market REPORT HIGHLIGHTS
| Aspects | Details |
|---|---|
| Study Period | 2019-2033 |
| Base Year | 2024 |
| Estimated Year | 2025 |
| Forecast Period | 2025-2033 |
| Historical Period | 2019-2024 |
| Growth Rate | CAGR of 8.91% from 2019-2033 |
| Segmentation |
|
Table of Contents
- 1. Introduction
- 1.1. Research Scope
- 1.2. Market Segmentation
- 1.3. Research Methodology
- 1.4. Definitions and Assumptions
- 2. Executive Summary
- 2.1. Introduction
- 3. Market Dynamics
- 3.1. Introduction
- 3.2. Market Drivers
- 3.2.1. Growing Household Income Combined with Increased Awareness among Consumers
- 3.3. Market Restrains
- 3.3.1. ; Easy Availability of Counterfeit Products
- 3.4. Market Trends
- 3.4.1. Smart Oven to Drive Significant Market Growth
- 4. Market Factor Analysis
- 4.1. Porters Five Forces
- 4.2. Supply/Value Chain
- 4.3. PESTEL analysis
- 4.4. Market Entropy
- 4.5. Patent/Trademark Analysis
- 5. Global Smart Home Appliances Market Analysis, Insights and Forecast, 2019-2031
- 5.1. Market Analysis, Insights and Forecast - by Product Type
- 5.1.1. Smart Ovens
- 5.1.2. Smart Dishwashers
- 5.1.3. Smart Refrigerators
- 5.1.4. Smart Cookware and Cooktops
- 5.1.5. Smart Scale and Thermometers
- 5.1.6. Other Product Types
- 5.2. Market Analysis, Insights and Forecast - by Region
- 5.2.1. North America
- 5.2.2. Europe
- 5.2.3. Asia
- 5.2.4. Australia and New Zealand
- 5.2.5. Latin America
- 5.2.6. Middle East and Africa
- 5.1. Market Analysis, Insights and Forecast - by Product Type
- 6. North America Smart Home Appliances Market Analysis, Insights and Forecast, 2019-2031
- 6.1. Market Analysis, Insights and Forecast - by Product Type
- 6.1.1. Smart Ovens
- 6.1.2. Smart Dishwashers
- 6.1.3. Smart Refrigerators
- 6.1.4. Smart Cookware and Cooktops
- 6.1.5. Smart Scale and Thermometers
- 6.1.6. Other Product Types
- 6.1. Market Analysis, Insights and Forecast - by Product Type
- 7. Europe Smart Home Appliances Market Analysis, Insights and Forecast, 2019-2031
- 7.1. Market Analysis, Insights and Forecast - by Product Type
- 7.1.1. Smart Ovens
- 7.1.2. Smart Dishwashers
- 7.1.3. Smart Refrigerators
- 7.1.4. Smart Cookware and Cooktops
- 7.1.5. Smart Scale and Thermometers
- 7.1.6. Other Product Types
- 7.1. Market Analysis, Insights and Forecast - by Product Type
- 8. Asia Smart Home Appliances Market Analysis, Insights and Forecast, 2019-2031
- 8.1. Market Analysis, Insights and Forecast - by Product Type
- 8.1.1. Smart Ovens
- 8.1.2. Smart Dishwashers
- 8.1.3. Smart Refrigerators
- 8.1.4. Smart Cookware and Cooktops
- 8.1.5. Smart Scale and Thermometers
- 8.1.6. Other Product Types
- 8.1. Market Analysis, Insights and Forecast - by Product Type
- 9. Australia and New Zealand Smart Home Appliances Market Analysis, Insights and Forecast, 2019-2031
- 9.1. Market Analysis, Insights and Forecast - by Product Type
- 9.1.1. Smart Ovens
- 9.1.2. Smart Dishwashers
- 9.1.3. Smart Refrigerators
- 9.1.4. Smart Cookware and Cooktops
- 9.1.5. Smart Scale and Thermometers
- 9.1.6. Other Product Types
- 9.1. Market Analysis, Insights and Forecast - by Product Type
- 10. Latin America Smart Home Appliances Market Analysis, Insights and Forecast, 2019-2031
- 10.1. Market Analysis, Insights and Forecast - by Product Type
- 10.1.1. Smart Ovens
- 10.1.2. Smart Dishwashers
- 10.1.3. Smart Refrigerators
- 10.1.4. Smart Cookware and Cooktops
- 10.1.5. Smart Scale and Thermometers
- 10.1.6. Other Product Types
- 10.1. Market Analysis, Insights and Forecast - by Product Type
- 11. Middle East and Africa Smart Home Appliances Market Analysis, Insights and Forecast, 2019-2031
- 11.1. Market Analysis, Insights and Forecast - by Product Type
- 11.1.1. Smart Ovens
- 11.1.2. Smart Dishwashers
- 11.1.3. Smart Refrigerators
- 11.1.4. Smart Cookware and Cooktops
- 11.1.5. Smart Scale and Thermometers
- 11.1.6. Other Product Types
- 11.1. Market Analysis, Insights and Forecast - by Product Type
- 12. North America Smart Home Appliances Market Analysis, Insights and Forecast, 2019-2031
- 12.1. Market Analysis, Insights and Forecast - By Country/Sub-region
- 12.1.1 United States
- 12.1.2 Canada
- 12.1.3 Mexico
- 13. Europe Smart Home Appliances Market Analysis, Insights and Forecast, 2019-2031
- 13.1. Market Analysis, Insights and Forecast - By Country/Sub-region
- 13.1.1 Germany
- 13.1.2 United Kingdom
- 13.1.3 France
- 13.1.4 Spain
- 13.1.5 Italy
- 13.1.6 Spain
- 13.1.7 Belgium
- 13.1.8 Netherland
- 13.1.9 Nordics
- 13.1.10 Rest of Europe
- 14. Asia Pacific Smart Home Appliances Market Analysis, Insights and Forecast, 2019-2031
- 14.1. Market Analysis, Insights and Forecast - By Country/Sub-region
- 14.1.1 China
- 14.1.2 Japan
- 14.1.3 India
- 14.1.4 South Korea
- 14.1.5 Southeast Asia
- 14.1.6 Australia
- 14.1.7 Indonesia
- 14.1.8 Phillipes
- 14.1.9 Singapore
- 14.1.10 Thailandc
- 14.1.11 Rest of Asia Pacific
- 15. South America Smart Home Appliances Market Analysis, Insights and Forecast, 2019-2031
- 15.1. Market Analysis, Insights and Forecast - By Country/Sub-region
- 15.1.1 Brazil
- 15.1.2 Argentina
- 15.1.3 Peru
- 15.1.4 Chile
- 15.1.5 Colombia
- 15.1.6 Ecuador
- 15.1.7 Venezuela
- 15.1.8 Rest of South America
- 16. North America Smart Home Appliances Market Analysis, Insights and Forecast, 2019-2031
- 16.1. Market Analysis, Insights and Forecast - By Country/Sub-region
- 16.1.1 United States
- 16.1.2 Canada
- 16.1.3 Mexico
- 17. MEA Smart Home Appliances Market Analysis, Insights and Forecast, 2019-2031
- 17.1. Market Analysis, Insights and Forecast - By Country/Sub-region
- 17.1.1 United Arab Emirates
- 17.1.2 Saudi Arabia
- 17.1.3 South Africa
- 17.1.4 Rest of Middle East and Africa
- 18. Competitive Analysis
- 18.1. Global Market Share Analysis 2024
- 18.2. Company Profiles
- 18.2.1 Whirlpool Corporation
- 18.2.1.1. Overview
- 18.2.1.2. Products
- 18.2.1.3. SWOT Analysis
- 18.2.1.4. Recent Developments
- 18.2.1.5. Financials (Based on Availability)
- 18.2.2 AB Electrolux
- 18.2.2.1. Overview
- 18.2.2.2. Products
- 18.2.2.3. SWOT Analysis
- 18.2.2.4. Recent Developments
- 18.2.2.5. Financials (Based on Availability)
- 18.2.3 BSH Home Appliances Corporation
- 18.2.3.1. Overview
- 18.2.3.2. Products
- 18.2.3.3. SWOT Analysis
- 18.2.3.4. Recent Developments
- 18.2.3.5. Financials (Based on Availability)
- 18.2.4 LG Electronics Inc
- 18.2.4.1. Overview
- 18.2.4.2. Products
- 18.2.4.3. SWOT Analysis
- 18.2.4.4. Recent Developments
- 18.2.4.5. Financials (Based on Availability)
- 18.2.5 Samsung Electronics Co Ltd
- 18.2.5.1. Overview
- 18.2.5.2. Products
- 18.2.5.3. SWOT Analysis
- 18.2.5.4. Recent Developments
- 18.2.5.5. Financials (Based on Availability)
- 18.2.6 Breville Group Limite
- 18.2.6.1. Overview
- 18.2.6.2. Products
- 18.2.6.3. SWOT Analysis
- 18.2.6.4. Recent Developments
- 18.2.6.5. Financials (Based on Availability)
- 18.2.7 Haier Group
- 18.2.7.1. Overview
- 18.2.7.2. Products
- 18.2.7.3. SWOT Analysis
- 18.2.7.4. Recent Developments
- 18.2.7.5. Financials (Based on Availability)
- 18.2.8 Panasonic Corporation
- 18.2.8.1. Overview
- 18.2.8.2. Products
- 18.2.8.3. SWOT Analysis
- 18.2.8.4. Recent Developments
- 18.2.8.5. Financials (Based on Availability)
- 18.2.1 Whirlpool Corporation
List of Figures
- Figure 1: Global Smart Home Appliances Market Revenue Breakdown (Million, %) by Region 2024 & 2032
- Figure 2: Global Smart Home Appliances Market Volume Breakdown (K Unit, %) by Region 2024 & 2032
- Figure 3: North America Smart Home Appliances Market Revenue (Million), by Country 2024 & 2032
- Figure 4: North America Smart Home Appliances Market Volume (K Unit), by Country 2024 & 2032
- Figure 5: North America Smart Home Appliances Market Revenue Share (%), by Country 2024 & 2032
- Figure 6: North America Smart Home Appliances Market Volume Share (%), by Country 2024 & 2032
- Figure 7: Europe Smart Home Appliances Market Revenue (Million), by Country 2024 & 2032
- Figure 8: Europe Smart Home Appliances Market Volume (K Unit), by Country 2024 & 2032
- Figure 9: Europe Smart Home Appliances Market Revenue Share (%), by Country 2024 & 2032
- Figure 10: Europe Smart Home Appliances Market Volume Share (%), by Country 2024 & 2032
- Figure 11: Asia Pacific Smart Home Appliances Market Revenue (Million), by Country 2024 & 2032
- Figure 12: Asia Pacific Smart Home Appliances Market Volume (K Unit), by Country 2024 & 2032
- Figure 13: Asia Pacific Smart Home Appliances Market Revenue Share (%), by Country 2024 & 2032
- Figure 14: Asia Pacific Smart Home Appliances Market Volume Share (%), by Country 2024 & 2032
- Figure 15: South America Smart Home Appliances Market Revenue (Million), by Country 2024 & 2032
- Figure 16: South America Smart Home Appliances Market Volume (K Unit), by Country 2024 & 2032
- Figure 17: South America Smart Home Appliances Market Revenue Share (%), by Country 2024 & 2032
- Figure 18: South America Smart Home Appliances Market Volume Share (%), by Country 2024 & 2032
- Figure 19: North America Smart Home Appliances Market Revenue (Million), by Country 2024 & 2032
- Figure 20: North America Smart Home Appliances Market Volume (K Unit), by Country 2024 & 2032
- Figure 21: North America Smart Home Appliances Market Revenue Share (%), by Country 2024 & 2032
- Figure 22: North America Smart Home Appliances Market Volume Share (%), by Country 2024 & 2032
- Figure 23: MEA Smart Home Appliances Market Revenue (Million), by Country 2024 & 2032
- Figure 24: MEA Smart Home Appliances Market Volume (K Unit), by Country 2024 & 2032
- Figure 25: MEA Smart Home Appliances Market Revenue Share (%), by Country 2024 & 2032
- Figure 26: MEA Smart Home Appliances Market Volume Share (%), by Country 2024 & 2032
- Figure 27: North America Smart Home Appliances Market Revenue (Million), by Product Type 2024 & 2032
- Figure 28: North America Smart Home Appliances Market Volume (K Unit), by Product Type 2024 & 2032
- Figure 29: North America Smart Home Appliances Market Revenue Share (%), by Product Type 2024 & 2032
- Figure 30: North America Smart Home Appliances Market Volume Share (%), by Product Type 2024 & 2032
- Figure 31: North America Smart Home Appliances Market Revenue (Million), by Country 2024 & 2032
- Figure 32: North America Smart Home Appliances Market Volume (K Unit), by Country 2024 & 2032
- Figure 33: North America Smart Home Appliances Market Revenue Share (%), by Country 2024 & 2032
- Figure 34: North America Smart Home Appliances Market Volume Share (%), by Country 2024 & 2032
- Figure 35: Europe Smart Home Appliances Market Revenue (Million), by Product Type 2024 & 2032
- Figure 36: Europe Smart Home Appliances Market Volume (K Unit), by Product Type 2024 & 2032
- Figure 37: Europe Smart Home Appliances Market Revenue Share (%), by Product Type 2024 & 2032
- Figure 38: Europe Smart Home Appliances Market Volume Share (%), by Product Type 2024 & 2032
- Figure 39: Europe Smart Home Appliances Market Revenue (Million), by Country 2024 & 2032
- Figure 40: Europe Smart Home Appliances Market Volume (K Unit), by Country 2024 & 2032
- Figure 41: Europe Smart Home Appliances Market Revenue Share (%), by Country 2024 & 2032
- Figure 42: Europe Smart Home Appliances Market Volume Share (%), by Country 2024 & 2032
- Figure 43: Asia Smart Home Appliances Market Revenue (Million), by Product Type 2024 & 2032
- Figure 44: Asia Smart Home Appliances Market Volume (K Unit), by Product Type 2024 & 2032
- Figure 45: Asia Smart Home Appliances Market Revenue Share (%), by Product Type 2024 & 2032
- Figure 46: Asia Smart Home Appliances Market Volume Share (%), by Product Type 2024 & 2032
- Figure 47: Asia Smart Home Appliances Market Revenue (Million), by Country 2024 & 2032
- Figure 48: Asia Smart Home Appliances Market Volume (K Unit), by Country 2024 & 2032
- Figure 49: Asia Smart Home Appliances Market Revenue Share (%), by Country 2024 & 2032
- Figure 50: Asia Smart Home Appliances Market Volume Share (%), by Country 2024 & 2032
- Figure 51: Australia and New Zealand Smart Home Appliances Market Revenue (Million), by Product Type 2024 & 2032
- Figure 52: Australia and New Zealand Smart Home Appliances Market Volume (K Unit), by Product Type 2024 & 2032
- Figure 53: Australia and New Zealand Smart Home Appliances Market Revenue Share (%), by Product Type 2024 & 2032
- Figure 54: Australia and New Zealand Smart Home Appliances Market Volume Share (%), by Product Type 2024 & 2032
- Figure 55: Australia and New Zealand Smart Home Appliances Market Revenue (Million), by Country 2024 & 2032
- Figure 56: Australia and New Zealand Smart Home Appliances Market Volume (K Unit), by Country 2024 & 2032
- Figure 57: Australia and New Zealand Smart Home Appliances Market Revenue Share (%), by Country 2024 & 2032
- Figure 58: Australia and New Zealand Smart Home Appliances Market Volume Share (%), by Country 2024 & 2032
- Figure 59: Latin America Smart Home Appliances Market Revenue (Million), by Product Type 2024 & 2032
- Figure 60: Latin America Smart Home Appliances Market Volume (K Unit), by Product Type 2024 & 2032
- Figure 61: Latin America Smart Home Appliances Market Revenue Share (%), by Product Type 2024 & 2032
- Figure 62: Latin America Smart Home Appliances Market Volume Share (%), by Product Type 2024 & 2032
- Figure 63: Latin America Smart Home Appliances Market Revenue (Million), by Country 2024 & 2032
- Figure 64: Latin America Smart Home Appliances Market Volume (K Unit), by Country 2024 & 2032
- Figure 65: Latin America Smart Home Appliances Market Revenue Share (%), by Country 2024 & 2032
- Figure 66: Latin America Smart Home Appliances Market Volume Share (%), by Country 2024 & 2032
- Figure 67: Middle East and Africa Smart Home Appliances Market Revenue (Million), by Product Type 2024 & 2032
- Figure 68: Middle East and Africa Smart Home Appliances Market Volume (K Unit), by Product Type 2024 & 2032
- Figure 69: Middle East and Africa Smart Home Appliances Market Revenue Share (%), by Product Type 2024 & 2032
- Figure 70: Middle East and Africa Smart Home Appliances Market Volume Share (%), by Product Type 2024 & 2032
- Figure 71: Middle East and Africa Smart Home Appliances Market Revenue (Million), by Country 2024 & 2032
- Figure 72: Middle East and Africa Smart Home Appliances Market Volume (K Unit), by Country 2024 & 2032
- Figure 73: Middle East and Africa Smart Home Appliances Market Revenue Share (%), by Country 2024 & 2032
- Figure 74: Middle East and Africa Smart Home Appliances Market Volume Share (%), by Country 2024 & 2032
List of Tables
- Table 1: Global Smart Home Appliances Market Revenue Million Forecast, by Region 2019 & 2032
- Table 2: Global Smart Home Appliances Market Volume K Unit Forecast, by Region 2019 & 2032
- Table 3: Global Smart Home Appliances Market Revenue Million Forecast, by Product Type 2019 & 2032
- Table 4: Global Smart Home Appliances Market Volume K Unit Forecast, by Product Type 2019 & 2032
- Table 5: Global Smart Home Appliances Market Revenue Million Forecast, by Region 2019 & 2032
- Table 6: Global Smart Home Appliances Market Volume K Unit Forecast, by Region 2019 & 2032
- Table 7: Global Smart Home Appliances Market Revenue Million Forecast, by Country 2019 & 2032
- Table 8: Global Smart Home Appliances Market Volume K Unit Forecast, by Country 2019 & 2032
- Table 9: United States Smart Home Appliances Market Revenue (Million) Forecast, by Application 2019 & 2032
- Table 10: United States Smart Home Appliances Market Volume (K Unit) Forecast, by Application 2019 & 2032
- Table 11: Canada Smart Home Appliances Market Revenue (Million) Forecast, by Application 2019 & 2032
- Table 12: Canada Smart Home Appliances Market Volume (K Unit) Forecast, by Application 2019 & 2032
- Table 13: Mexico Smart Home Appliances Market Revenue (Million) Forecast, by Application 2019 & 2032
- Table 14: Mexico Smart Home Appliances Market Volume (K Unit) Forecast, by Application 2019 & 2032
- Table 15: Global Smart Home Appliances Market Revenue Million Forecast, by Country 2019 & 2032
- Table 16: Global Smart Home Appliances Market Volume K Unit Forecast, by Country 2019 & 2032
- Table 17: Germany Smart Home Appliances Market Revenue (Million) Forecast, by Application 2019 & 2032
- Table 18: Germany Smart Home Appliances Market Volume (K Unit) Forecast, by Application 2019 & 2032
- Table 19: United Kingdom Smart Home Appliances Market Revenue (Million) Forecast, by Application 2019 & 2032
- Table 20: United Kingdom Smart Home Appliances Market Volume (K Unit) Forecast, by Application 2019 & 2032
- Table 21: France Smart Home Appliances Market Revenue (Million) Forecast, by Application 2019 & 2032
- Table 22: France Smart Home Appliances Market Volume (K Unit) Forecast, by Application 2019 & 2032
- Table 23: Spain Smart Home Appliances Market Revenue (Million) Forecast, by Application 2019 & 2032
- Table 24: Spain Smart Home Appliances Market Volume (K Unit) Forecast, by Application 2019 & 2032
- Table 25: Italy Smart Home Appliances Market Revenue (Million) Forecast, by Application 2019 & 2032
- Table 26: Italy Smart Home Appliances Market Volume (K Unit) Forecast, by Application 2019 & 2032
- Table 27: Spain Smart Home Appliances Market Revenue (Million) Forecast, by Application 2019 & 2032
- Table 28: Spain Smart Home Appliances Market Volume (K Unit) Forecast, by Application 2019 & 2032
- Table 29: Belgium Smart Home Appliances Market Revenue (Million) Forecast, by Application 2019 & 2032
- Table 30: Belgium Smart Home Appliances Market Volume (K Unit) Forecast, by Application 2019 & 2032
- Table 31: Netherland Smart Home Appliances Market Revenue (Million) Forecast, by Application 2019 & 2032
- Table 32: Netherland Smart Home Appliances Market Volume (K Unit) Forecast, by Application 2019 & 2032
- Table 33: Nordics Smart Home Appliances Market Revenue (Million) Forecast, by Application 2019 & 2032
- Table 34: Nordics Smart Home Appliances Market Volume (K Unit) Forecast, by Application 2019 & 2032
- Table 35: Rest of Europe Smart Home Appliances Market Revenue (Million) Forecast, by Application 2019 & 2032
- Table 36: Rest of Europe Smart Home Appliances Market Volume (K Unit) Forecast, by Application 2019 & 2032
- Table 37: Global Smart Home Appliances Market Revenue Million Forecast, by Country 2019 & 2032
- Table 38: Global Smart Home Appliances Market Volume K Unit Forecast, by Country 2019 & 2032
- Table 39: China Smart Home Appliances Market Revenue (Million) Forecast, by Application 2019 & 2032
- Table 40: China Smart Home Appliances Market Volume (K Unit) Forecast, by Application 2019 & 2032
- Table 41: Japan Smart Home Appliances Market Revenue (Million) Forecast, by Application 2019 & 2032
- Table 42: Japan Smart Home Appliances Market Volume (K Unit) Forecast, by Application 2019 & 2032
- Table 43: India Smart Home Appliances Market Revenue (Million) Forecast, by Application 2019 & 2032
- Table 44: India Smart Home Appliances Market Volume (K Unit) Forecast, by Application 2019 & 2032
- Table 45: South Korea Smart Home Appliances Market Revenue (Million) Forecast, by Application 2019 & 2032
- Table 46: South Korea Smart Home Appliances Market Volume (K Unit) Forecast, by Application 2019 & 2032
- Table 47: Southeast Asia Smart Home Appliances Market Revenue (Million) Forecast, by Application 2019 & 2032
- Table 48: Southeast Asia Smart Home Appliances Market Volume (K Unit) Forecast, by Application 2019 & 2032
- Table 49: Australia Smart Home Appliances Market Revenue (Million) Forecast, by Application 2019 & 2032
- Table 50: Australia Smart Home Appliances Market Volume (K Unit) Forecast, by Application 2019 & 2032
- Table 51: Indonesia Smart Home Appliances Market Revenue (Million) Forecast, by Application 2019 & 2032
- Table 52: Indonesia Smart Home Appliances Market Volume (K Unit) Forecast, by Application 2019 & 2032
- Table 53: Phillipes Smart Home Appliances Market Revenue (Million) Forecast, by Application 2019 & 2032
- Table 54: Phillipes Smart Home Appliances Market Volume (K Unit) Forecast, by Application 2019 & 2032
- Table 55: Singapore Smart Home Appliances Market Revenue (Million) Forecast, by Application 2019 & 2032
- Table 56: Singapore Smart Home Appliances Market Volume (K Unit) Forecast, by Application 2019 & 2032
- Table 57: Thailandc Smart Home Appliances Market Revenue (Million) Forecast, by Application 2019 & 2032
- Table 58: Thailandc Smart Home Appliances Market Volume (K Unit) Forecast, by Application 2019 & 2032
- Table 59: Rest of Asia Pacific Smart Home Appliances Market Revenue (Million) Forecast, by Application 2019 & 2032
- Table 60: Rest of Asia Pacific Smart Home Appliances Market Volume (K Unit) Forecast, by Application 2019 & 2032
- Table 61: Global Smart Home Appliances Market Revenue Million Forecast, by Country 2019 & 2032
- Table 62: Global Smart Home Appliances Market Volume K Unit Forecast, by Country 2019 & 2032
- Table 63: Brazil Smart Home Appliances Market Revenue (Million) Forecast, by Application 2019 & 2032
- Table 64: Brazil Smart Home Appliances Market Volume (K Unit) Forecast, by Application 2019 & 2032
- Table 65: Argentina Smart Home Appliances Market Revenue (Million) Forecast, by Application 2019 & 2032
- Table 66: Argentina Smart Home Appliances Market Volume (K Unit) Forecast, by Application 2019 & 2032
- Table 67: Peru Smart Home Appliances Market Revenue (Million) Forecast, by Application 2019 & 2032
- Table 68: Peru Smart Home Appliances Market Volume (K Unit) Forecast, by Application 2019 & 2032
- Table 69: Chile Smart Home Appliances Market Revenue (Million) Forecast, by Application 2019 & 2032
- Table 70: Chile Smart Home Appliances Market Volume (K Unit) Forecast, by Application 2019 & 2032
- Table 71: Colombia Smart Home Appliances Market Revenue (Million) Forecast, by Application 2019 & 2032
- Table 72: Colombia Smart Home Appliances Market Volume (K Unit) Forecast, by Application 2019 & 2032
- Table 73: Ecuador Smart Home Appliances Market Revenue (Million) Forecast, by Application 2019 & 2032
- Table 74: Ecuador Smart Home Appliances Market Volume (K Unit) Forecast, by Application 2019 & 2032
- Table 75: Venezuela Smart Home Appliances Market Revenue (Million) Forecast, by Application 2019 & 2032
- Table 76: Venezuela Smart Home Appliances Market Volume (K Unit) Forecast, by Application 2019 & 2032
- Table 77: Rest of South America Smart Home Appliances Market Revenue (Million) Forecast, by Application 2019 & 2032
- Table 78: Rest of South America Smart Home Appliances Market Volume (K Unit) Forecast, by Application 2019 & 2032
- Table 79: Global Smart Home Appliances Market Revenue Million Forecast, by Country 2019 & 2032
- Table 80: Global Smart Home Appliances Market Volume K Unit Forecast, by Country 2019 & 2032
- Table 81: United States Smart Home Appliances Market Revenue (Million) Forecast, by Application 2019 & 2032
- Table 82: United States Smart Home Appliances Market Volume (K Unit) Forecast, by Application 2019 & 2032
- Table 83: Canada Smart Home Appliances Market Revenue (Million) Forecast, by Application 2019 & 2032
- Table 84: Canada Smart Home Appliances Market Volume (K Unit) Forecast, by Application 2019 & 2032
- Table 85: Mexico Smart Home Appliances Market Revenue (Million) Forecast, by Application 2019 & 2032
- Table 86: Mexico Smart Home Appliances Market Volume (K Unit) Forecast, by Application 2019 & 2032
- Table 87: Global Smart Home Appliances Market Revenue Million Forecast, by Country 2019 & 2032
- Table 88: Global Smart Home Appliances Market Volume K Unit Forecast, by Country 2019 & 2032
- Table 89: United Arab Emirates Smart Home Appliances Market Revenue (Million) Forecast, by Application 2019 & 2032
- Table 90: United Arab Emirates Smart Home Appliances Market Volume (K Unit) Forecast, by Application 2019 & 2032
- Table 91: Saudi Arabia Smart Home Appliances Market Revenue (Million) Forecast, by Application 2019 & 2032
- Table 92: Saudi Arabia Smart Home Appliances Market Volume (K Unit) Forecast, by Application 2019 & 2032
- Table 93: South Africa Smart Home Appliances Market Revenue (Million) Forecast, by Application 2019 & 2032
- Table 94: South Africa Smart Home Appliances Market Volume (K Unit) Forecast, by Application 2019 & 2032
- Table 95: Rest of Middle East and Africa Smart Home Appliances Market Revenue (Million) Forecast, by Application 2019 & 2032
- Table 96: Rest of Middle East and Africa Smart Home Appliances Market Volume (K Unit) Forecast, by Application 2019 & 2032
- Table 97: Global Smart Home Appliances Market Revenue Million Forecast, by Product Type 2019 & 2032
- Table 98: Global Smart Home Appliances Market Volume K Unit Forecast, by Product Type 2019 & 2032
- Table 99: Global Smart Home Appliances Market Revenue Million Forecast, by Country 2019 & 2032
- Table 100: Global Smart Home Appliances Market Volume K Unit Forecast, by Country 2019 & 2032
- Table 101: United States Smart Home Appliances Market Revenue (Million) Forecast, by Application 2019 & 2032
- Table 102: United States Smart Home Appliances Market Volume (K Unit) Forecast, by Application 2019 & 2032
- Table 103: Canada Smart Home Appliances Market Revenue (Million) Forecast, by Application 2019 & 2032
- Table 104: Canada Smart Home Appliances Market Volume (K Unit) Forecast, by Application 2019 & 2032
- Table 105: Global Smart Home Appliances Market Revenue Million Forecast, by Product Type 2019 & 2032
- Table 106: Global Smart Home Appliances Market Volume K Unit Forecast, by Product Type 2019 & 2032
- Table 107: Global Smart Home Appliances Market Revenue Million Forecast, by Country 2019 & 2032
- Table 108: Global Smart Home Appliances Market Volume K Unit Forecast, by Country 2019 & 2032
- Table 109: Germany Smart Home Appliances Market Revenue (Million) Forecast, by Application 2019 & 2032
- Table 110: Germany Smart Home Appliances Market Volume (K Unit) Forecast, by Application 2019 & 2032
- Table 111: United Kingdom Smart Home Appliances Market Revenue (Million) Forecast, by Application 2019 & 2032
- Table 112: United Kingdom Smart Home Appliances Market Volume (K Unit) Forecast, by Application 2019 & 2032
- Table 113: France Smart Home Appliances Market Revenue (Million) Forecast, by Application 2019 & 2032
- Table 114: France Smart Home Appliances Market Volume (K Unit) Forecast, by Application 2019 & 2032
- Table 115: Spain Smart Home Appliances Market Revenue (Million) Forecast, by Application 2019 & 2032
- Table 116: Spain Smart Home Appliances Market Volume (K Unit) Forecast, by Application 2019 & 2032
- Table 117: Global Smart Home Appliances Market Revenue Million Forecast, by Product Type 2019 & 2032
- Table 118: Global Smart Home Appliances Market Volume K Unit Forecast, by Product Type 2019 & 2032
- Table 119: Global Smart Home Appliances Market Revenue Million Forecast, by Country 2019 & 2032
- Table 120: Global Smart Home Appliances Market Volume K Unit Forecast, by Country 2019 & 2032
- Table 121: China Smart Home Appliances Market Revenue (Million) Forecast, by Application 2019 & 2032
- Table 122: China Smart Home Appliances Market Volume (K Unit) Forecast, by Application 2019 & 2032
- Table 123: Japan Smart Home Appliances Market Revenue (Million) Forecast, by Application 2019 & 2032
- Table 124: Japan Smart Home Appliances Market Volume (K Unit) Forecast, by Application 2019 & 2032
- Table 125: Global Smart Home Appliances Market Revenue Million Forecast, by Product Type 2019 & 2032
- Table 126: Global Smart Home Appliances Market Volume K Unit Forecast, by Product Type 2019 & 2032
- Table 127: Global Smart Home Appliances Market Revenue Million Forecast, by Country 2019 & 2032
- Table 128: Global Smart Home Appliances Market Volume K Unit Forecast, by Country 2019 & 2032
- Table 129: Global Smart Home Appliances Market Revenue Million Forecast, by Product Type 2019 & 2032
- Table 130: Global Smart Home Appliances Market Volume K Unit Forecast, by Product Type 2019 & 2032
- Table 131: Global Smart Home Appliances Market Revenue Million Forecast, by Country 2019 & 2032
- Table 132: Global Smart Home Appliances Market Volume K Unit Forecast, by Country 2019 & 2032
- Table 133: Global Smart Home Appliances Market Revenue Million Forecast, by Product Type 2019 & 2032
- Table 134: Global Smart Home Appliances Market Volume K Unit Forecast, by Product Type 2019 & 2032
- Table 135: Global Smart Home Appliances Market Revenue Million Forecast, by Country 2019 & 2032
- Table 136: Global Smart Home Appliances Market Volume K Unit Forecast, by Country 2019 & 2032
Frequently Asked Questions
1. What is the projected Compound Annual Growth Rate (CAGR) of the Smart Home Appliances Market?
The projected CAGR is approximately 8.91%.
2. Which companies are prominent players in the Smart Home Appliances Market?
Key companies in the market include Whirlpool Corporation, AB Electrolux, BSH Home Appliances Corporation, LG Electronics Inc, Samsung Electronics Co Ltd, Breville Group Limite, Haier Group, Panasonic Corporation.
3. What are the main segments of the Smart Home Appliances Market?
The market segments include Product Type.
4. Can you provide details about the market size?
The market size is estimated to be USD 34.98 Million as of 2022.
5. What are some drivers contributing to market growth?
Growing Household Income Combined with Increased Awareness among Consumers.
6. What are the notable trends driving market growth?
Smart Oven to Drive Significant Market Growth.
7. Are there any restraints impacting market growth?
; Easy Availability of Counterfeit Products.
8. Can you provide examples of recent developments in the market?
September 2022 - At IFA 2022 in Berlin, Germany, LG Electronics (LG) plans to introduce its ground-breaking refrigerator with MoodUP technology, which includes color-changing LED door panels. The new refrigerator skillfully bridges the borders between design and technology to serve younger consumers' changing needs better. With the help of LG's MoodUP technology, customers can design a unique lighting system for the refrigerator using a variety of brilliant colors to match their mood or the surroundings. In addition, users may use the device's built-in Bluetooth speaker to play music to set the mood in the kitchen, whether they are hosting a party or cooking for themselves.
9. What pricing options are available for accessing the report?
Pricing options include single-user, multi-user, and enterprise licenses priced at USD 4750, USD 5250, and USD 8750 respectively.
10. Is the market size provided in terms of value or volume?
The market size is provided in terms of value, measured in Million and volume, measured in K Unit.
11. Are there any specific market keywords associated with the report?
Yes, the market keyword associated with the report is "Smart Home Appliances Market," which aids in identifying and referencing the specific market segment covered.
12. How do I determine which pricing option suits my needs best?
The pricing options vary based on user requirements and access needs. Individual users may opt for single-user licenses, while businesses requiring broader access may choose multi-user or enterprise licenses for cost-effective access to the report.
13. Are there any additional resources or data provided in the Smart Home Appliances Market report?
While the report offers comprehensive insights, it's advisable to review the specific contents or supplementary materials provided to ascertain if additional resources or data are available.
14. How can I stay updated on further developments or reports in the Smart Home Appliances Market?
To stay informed about further developments, trends, and reports in the Smart Home Appliances Market, consider subscribing to industry newsletters, following relevant companies and organizations, or regularly checking reputable industry news sources and publications.
Methodology
Step 1 - Identification of Relevant Samples Size from Population Database


Step 2 - Approaches for Defining Global Market Size (Value, Volume* & Price*)

Note*: In applicable scenarios
Step 3 - Data Sources
Primary Research
- Web Analytics
- Survey Reports
- Research Institute
- Latest Research Reports
- Opinion Leaders
Secondary Research
- Annual Reports
- White Paper
- Latest Press Release
- Industry Association
- Paid Database
- Investor Presentations

Step 4 - Data Triangulation
Involves using different sources of information in order to increase the validity of a study
These sources are likely to be stakeholders in a program - participants, other researchers, program staff, other community members, and so on.
Then we put all data in single framework & apply various statistical tools to find out the dynamic on the market.
During the analysis stage, feedback from the stakeholder groups would be compared to determine areas of agreement as well as areas of divergence


