
Key Insights
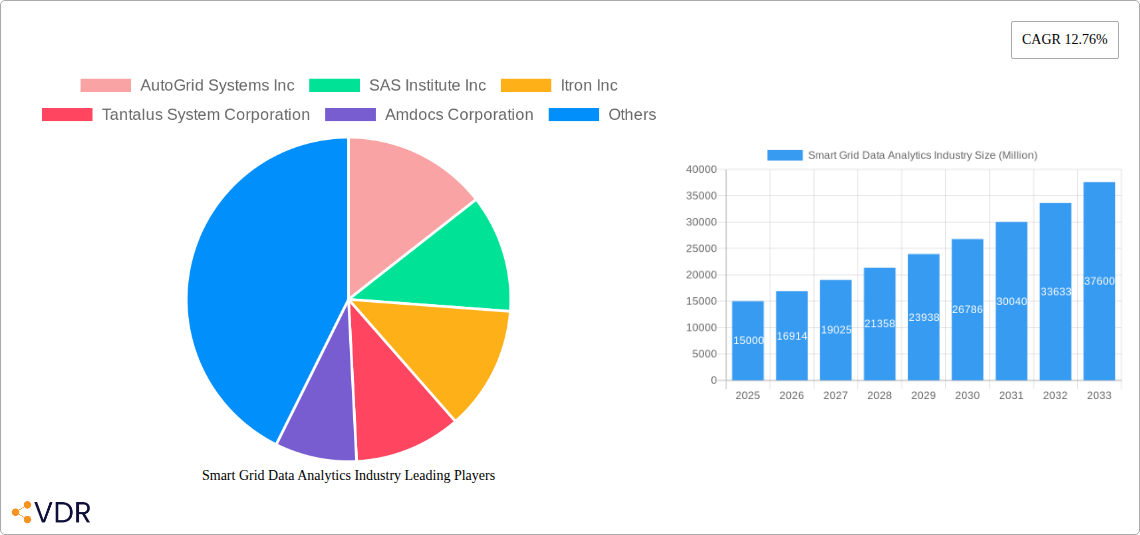
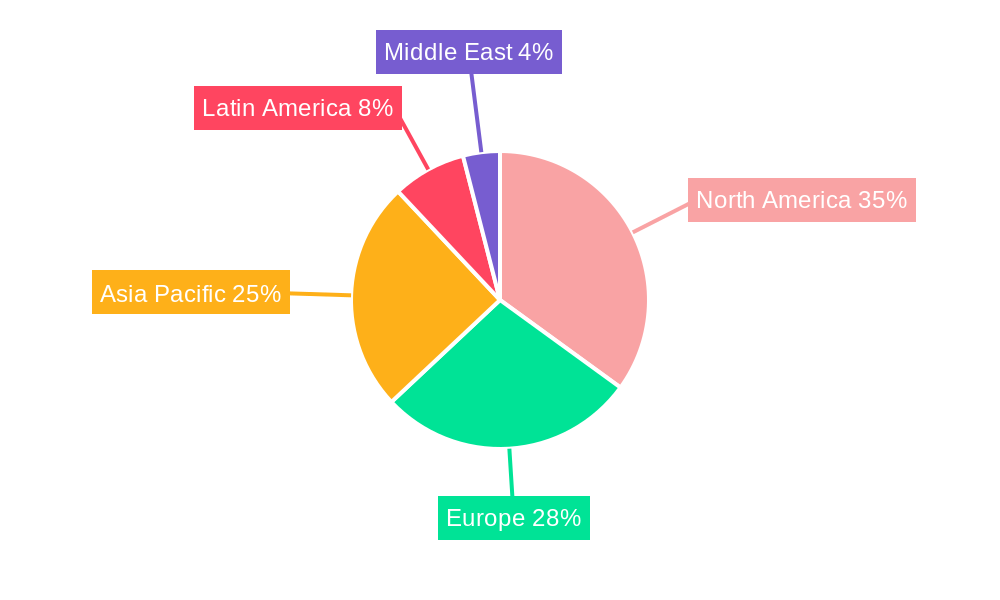
The Smart Grid Data Analytics market is experiencing robust growth, projected to reach a substantial size driven by the increasing adoption of smart meters, the expanding need for grid optimization, and the imperative to improve energy efficiency. A Compound Annual Growth Rate (CAGR) of 12.76% from 2019 to 2024 suggests a rapidly evolving landscape. This growth is fueled by several key factors. Firstly, the escalating demand for real-time grid monitoring and predictive analytics allows utilities to enhance operational efficiency, reduce outages, and improve grid reliability. Secondly, the proliferation of renewable energy sources necessitates sophisticated data analytics to manage intermittent power generation and maintain grid stability. Thirdly, regulatory mandates and government initiatives promoting smart grid technologies are further accelerating market expansion. The market is segmented by deployment (cloud-based and on-premise), solution (T&D network, metering, customer analytics), application (advanced metering infrastructure analysis, demand response analysis, grid optimization analysis), and end-user (private and public sectors). The cloud-based segment holds a significant share due to its scalability, cost-effectiveness, and accessibility. North America and Europe currently dominate the market, however, the Asia-Pacific region is poised for significant growth owing to substantial investments in smart grid infrastructure and increasing energy demands.
The competitive landscape is characterized by a mix of established technology giants like IBM, Siemens, and Schneider Electric, alongside specialized analytics providers such as AutoGrid Systems and Uplight. These companies are continuously innovating to deliver advanced solutions that leverage artificial intelligence (AI) and machine learning (ML) for improved predictive capabilities and data-driven decision-making. The market faces challenges such as data security concerns, the need for interoperability standards, and the high initial investment costs associated with smart grid deployments. However, the long-term benefits of improved grid efficiency, reduced operational costs, and enhanced customer satisfaction outweigh these challenges, ensuring continued market expansion. The forecast period of 2025-2033 anticipates sustained growth, driven by technological advancements and increasing regulatory support. Assuming a consistent CAGR of 12.76% for the forecast period, and a 2025 market size of $X billion (with X being a reasonable estimate based on current market size estimates from reports on similar technologies), significant expansion will be observed by 2033.
Smart Grid Data Analytics Industry Market Report: 2019-2033
This comprehensive report provides an in-depth analysis of the Smart Grid Data Analytics market, encompassing market size, growth trends, key players, and future outlook. The study period covers 2019-2033, with 2025 as the base and estimated year. This report is crucial for industry professionals, investors, and stakeholders seeking to understand this rapidly evolving sector. The parent market is the Smart Grid market, and the child market is Smart Grid Data Analytics.
Smart Grid Data Analytics Industry Market Dynamics & Structure
The Smart Grid Data Analytics market is characterized by moderate concentration, with several key players holding significant market share. However, the market is witnessing increased competition from new entrants and technological innovation. The market size in 2025 is estimated at xx Million, with a projected CAGR of xx% during the forecast period (2025-2033).
- Market Concentration: The top 5 players hold approximately xx% of the market share in 2025. Increased competition is expected from smaller players specializing in niche solutions.
- Technological Innovation: Advancements in AI, machine learning, and big data analytics are driving innovation. The integration of IoT devices and the development of cloud-based solutions are further accelerating growth.
- Regulatory Frameworks: Government regulations promoting renewable energy and grid modernization are boosting adoption. However, data privacy concerns and cybersecurity regulations present challenges.
- Competitive Product Substitutes: Limited direct substitutes exist; however, traditional grid management systems pose indirect competition.
- End-User Demographics: The market is primarily driven by the public sector (utilities) and large enterprises in the private sector. Growth is expected across various segments, including SMEs.
- M&A Trends: The number of M&A deals in the sector averaged xx per year during the historical period (2019-2024), indicating a growing consolidation trend.
Smart Grid Data Analytics Industry Growth Trends & Insights
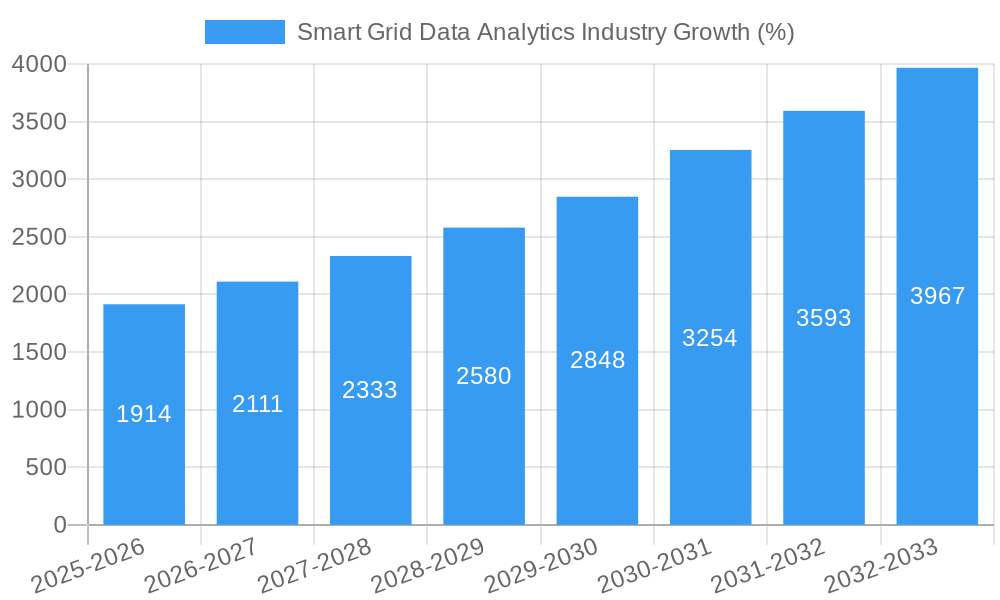
The Smart Grid Data Analytics market has experienced significant growth during the historical period (2019-2024), driven by increasing demand for efficient grid management and improved energy distribution. Market size grew from xx Million in 2019 to xx Million in 2024. The adoption rate of smart grid technologies is steadily increasing, fueled by technological advancements and supportive government policies. The market is expected to experience robust growth during the forecast period (2025-2033), with the CAGR reaching xx%. Key factors driving growth include:
- Increasing investments in renewable energy sources.
- Growing concerns about energy efficiency and sustainability.
- Rising demand for advanced metering infrastructure (AMI).
- The increasing adoption of cloud-based solutions.
- Growing adoption of data analytics for improved grid optimization and management.
Consumer behavior is shifting towards a greater demand for reliable and sustainable energy solutions, further driving the adoption of smart grid analytics.
Dominant Regions, Countries, or Segments in Smart Grid Data Analytics Industry
North America and Europe currently dominate the Smart Grid Data Analytics market, owing to advanced infrastructure and supportive regulatory frameworks. However, Asia-Pacific is expected to experience significant growth during the forecast period, driven by rising urbanization and increasing investments in smart grid infrastructure.
- By Deployment: The cloud-based segment holds the largest market share, driven by scalability, cost-effectiveness, and accessibility.
- By Solution: The Transmission and Distribution (T&D) Network segment is expected to be the largest, followed by Metering and Customer Analytics.
- By Application: Advanced Metering Infrastructure Analysis and Demand Response Analysis currently dominate the application landscape.
- By End-user Vertical: The Public Sector (Utilities) segment holds the largest market share due to high investments in grid modernization. However, Private Sector (Large Enterprises and SMEs) adoption is also growing steadily.
Key growth drivers include:
- Government initiatives promoting smart grid technologies.
- Investments in grid modernization and upgrades.
- Growing adoption of smart meters and other IoT devices.
Smart Grid Data Analytics Industry Product Landscape
Smart Grid Data Analytics solutions encompass a range of products and services, including software platforms, hardware devices (smart meters), and consulting services. Recent innovations focus on enhancing data analytics capabilities using AI and machine learning, improving predictive maintenance, and streamlining grid operations. Key features include real-time data visualization, predictive analytics, and seamless integration with existing grid infrastructure. The market offers diverse solutions catering to various needs and scales, with emphasis on user-friendly interfaces and efficient data processing.
Key Drivers, Barriers & Challenges in Smart Grid Data Analytics Industry
Key Drivers:
- The increasing adoption of renewable energy sources is creating a need for more efficient grid management.
- Government regulations mandating grid modernization are driving demand.
- The need for improved energy efficiency and reduced carbon emissions is a key factor.
Challenges and Restraints:
- High initial investment costs for implementation and upgrade can impede growth.
- Data security and privacy concerns represent a significant challenge.
- The complexity of integrating different systems and technologies adds to the challenges.
- Interoperability issues between various smart grid components pose a significant restraint.
Emerging Opportunities in Smart Grid Data Analytics Industry
Significant opportunities exist in the microgrid sector, smart city initiatives, and the development of advanced analytics capabilities for optimizing renewable energy integration. Untapped markets in developing economies also present substantial growth prospects. Further opportunities involve developing solutions for improved grid resilience, advanced anomaly detection, and enhancing energy storage management.
Growth Accelerators in the Smart Grid Data Analytics Industry Industry
Technological breakthroughs in AI, machine learning, and big data analytics are significantly driving growth. Strategic partnerships between technology providers and utility companies are facilitating faster market penetration. Expansion into new markets and geographic regions remains a key growth strategy. The focus on creating more sustainable and efficient energy systems is a major growth catalyst.
Key Players Shaping the Smart Grid Data Analytics Industry Market
- AutoGrid Systems Inc
- SAS Institute Inc
- Itron Inc
- Tantalus System Corporation
- Amdocs Corporation
- Uplight Inc
- IBM Corporation
- Landis & Gyr Group AG
- Hitachi Ltd
- Siemens AG
- Schneider Electric SE
- Sensus USA Inc (Xylem Inc)
- Oracle Corporation
- Uptake Technologies Inc
- General Electric Company
- SAP SE
Notable Milestones in Smart Grid Data Analytics Industry Sector
- November 2022: Siemens Smart Infrastructure partnered with SEW to improve smart meter user experiences and facilitate renewable energy transition.
- September 2022: DEWA's R&D Center evaluated its Smart Grid Analytics project using the "dInsight" Analytics Platform.
- July 2022: Siemens Smart Infrastructure partnered with Esri to enhance its grid software offerings using GIS technology.
In-Depth Smart Grid Data Analytics Industry Market Outlook
The future of the Smart Grid Data Analytics market is bright, driven by ongoing technological advancements, increasing adoption of renewable energy, and a growing focus on sustainable energy solutions. Strategic partnerships, expansion into new markets, and further innovation in areas such as AI and machine learning will continue to fuel market growth. The potential for improved grid efficiency, reduced energy costs, and enhanced grid resilience presents significant opportunities for industry players.
Smart Grid Data Analytics Industry Segmentation
-
1. Deployment
- 1.1. Cloud-based
- 1.2. On-premise
-
2. Solution
- 2.1. Transmission and Distribution (T&D) Network
- 2.2. Metering
- 2.3. Customer Analytics
-
3. Application
- 3.1. Advanced Metering Infrastructure Analysis
- 3.2. Demand Response Analysis
- 3.3. Grid Optimization Analysis
-
4. End-user Vertical
- 4.1. Private Sector (SMEs and Large Enterprises)
- 4.2. Public Sector
Smart Grid Data Analytics Industry Segmentation By Geography
- 1. North America
- 2. Europe
- 3. Asia Pacific
- 4. Latin America
- 5. Middle East
Smart Grid Data Analytics Industry REPORT HIGHLIGHTS
| Aspects | Details |
|---|---|
| Study Period | 2019-2033 |
| Base Year | 2024 |
| Estimated Year | 2025 |
| Forecast Period | 2025-2033 |
| Historical Period | 2019-2024 |
| Growth Rate | CAGR of 12.76% from 2019-2033 |
| Segmentation |
|
Table of Contents
- 1. Introduction
- 1.1. Research Scope
- 1.2. Market Segmentation
- 1.3. Research Methodology
- 1.4. Definitions and Assumptions
- 2. Executive Summary
- 2.1. Introduction
- 3. Market Dynamics
- 3.1. Introduction
- 3.2. Market Drivers
- 3.2.1. Growing Investments in Smart Grid Projects; Enormous Influx of Data
- 3.3. Market Restrains
- 3.3.1. Technical Difficulties
- 3.4. Market Trends
- 3.4.1. Growing Investments in Smart Grid Projects
- 4. Market Factor Analysis
- 4.1. Porters Five Forces
- 4.2. Supply/Value Chain
- 4.3. PESTEL analysis
- 4.4. Market Entropy
- 4.5. Patent/Trademark Analysis
- 5. Global Smart Grid Data Analytics Industry Analysis, Insights and Forecast, 2019-2031
- 5.1. Market Analysis, Insights and Forecast - by Deployment
- 5.1.1. Cloud-based
- 5.1.2. On-premise
- 5.2. Market Analysis, Insights and Forecast - by Solution
- 5.2.1. Transmission and Distribution (T&D) Network
- 5.2.2. Metering
- 5.2.3. Customer Analytics
- 5.3. Market Analysis, Insights and Forecast - by Application
- 5.3.1. Advanced Metering Infrastructure Analysis
- 5.3.2. Demand Response Analysis
- 5.3.3. Grid Optimization Analysis
- 5.4. Market Analysis, Insights and Forecast - by End-user Vertical
- 5.4.1. Private Sector (SMEs and Large Enterprises)
- 5.4.2. Public Sector
- 5.5. Market Analysis, Insights and Forecast - by Region
- 5.5.1. North America
- 5.5.2. Europe
- 5.5.3. Asia Pacific
- 5.5.4. Latin America
- 5.5.5. Middle East
- 5.1. Market Analysis, Insights and Forecast - by Deployment
- 6. North America Smart Grid Data Analytics Industry Analysis, Insights and Forecast, 2019-2031
- 6.1. Market Analysis, Insights and Forecast - by Deployment
- 6.1.1. Cloud-based
- 6.1.2. On-premise
- 6.2. Market Analysis, Insights and Forecast - by Solution
- 6.2.1. Transmission and Distribution (T&D) Network
- 6.2.2. Metering
- 6.2.3. Customer Analytics
- 6.3. Market Analysis, Insights and Forecast - by Application
- 6.3.1. Advanced Metering Infrastructure Analysis
- 6.3.2. Demand Response Analysis
- 6.3.3. Grid Optimization Analysis
- 6.4. Market Analysis, Insights and Forecast - by End-user Vertical
- 6.4.1. Private Sector (SMEs and Large Enterprises)
- 6.4.2. Public Sector
- 6.1. Market Analysis, Insights and Forecast - by Deployment
- 7. Europe Smart Grid Data Analytics Industry Analysis, Insights and Forecast, 2019-2031
- 7.1. Market Analysis, Insights and Forecast - by Deployment
- 7.1.1. Cloud-based
- 7.1.2. On-premise
- 7.2. Market Analysis, Insights and Forecast - by Solution
- 7.2.1. Transmission and Distribution (T&D) Network
- 7.2.2. Metering
- 7.2.3. Customer Analytics
- 7.3. Market Analysis, Insights and Forecast - by Application
- 7.3.1. Advanced Metering Infrastructure Analysis
- 7.3.2. Demand Response Analysis
- 7.3.3. Grid Optimization Analysis
- 7.4. Market Analysis, Insights and Forecast - by End-user Vertical
- 7.4.1. Private Sector (SMEs and Large Enterprises)
- 7.4.2. Public Sector
- 7.1. Market Analysis, Insights and Forecast - by Deployment
- 8. Asia Pacific Smart Grid Data Analytics Industry Analysis, Insights and Forecast, 2019-2031
- 8.1. Market Analysis, Insights and Forecast - by Deployment
- 8.1.1. Cloud-based
- 8.1.2. On-premise
- 8.2. Market Analysis, Insights and Forecast - by Solution
- 8.2.1. Transmission and Distribution (T&D) Network
- 8.2.2. Metering
- 8.2.3. Customer Analytics
- 8.3. Market Analysis, Insights and Forecast - by Application
- 8.3.1. Advanced Metering Infrastructure Analysis
- 8.3.2. Demand Response Analysis
- 8.3.3. Grid Optimization Analysis
- 8.4. Market Analysis, Insights and Forecast - by End-user Vertical
- 8.4.1. Private Sector (SMEs and Large Enterprises)
- 8.4.2. Public Sector
- 8.1. Market Analysis, Insights and Forecast - by Deployment
- 9. Latin America Smart Grid Data Analytics Industry Analysis, Insights and Forecast, 2019-2031
- 9.1. Market Analysis, Insights and Forecast - by Deployment
- 9.1.1. Cloud-based
- 9.1.2. On-premise
- 9.2. Market Analysis, Insights and Forecast - by Solution
- 9.2.1. Transmission and Distribution (T&D) Network
- 9.2.2. Metering
- 9.2.3. Customer Analytics
- 9.3. Market Analysis, Insights and Forecast - by Application
- 9.3.1. Advanced Metering Infrastructure Analysis
- 9.3.2. Demand Response Analysis
- 9.3.3. Grid Optimization Analysis
- 9.4. Market Analysis, Insights and Forecast - by End-user Vertical
- 9.4.1. Private Sector (SMEs and Large Enterprises)
- 9.4.2. Public Sector
- 9.1. Market Analysis, Insights and Forecast - by Deployment
- 10. Middle East Smart Grid Data Analytics Industry Analysis, Insights and Forecast, 2019-2031
- 10.1. Market Analysis, Insights and Forecast - by Deployment
- 10.1.1. Cloud-based
- 10.1.2. On-premise
- 10.2. Market Analysis, Insights and Forecast - by Solution
- 10.2.1. Transmission and Distribution (T&D) Network
- 10.2.2. Metering
- 10.2.3. Customer Analytics
- 10.3. Market Analysis, Insights and Forecast - by Application
- 10.3.1. Advanced Metering Infrastructure Analysis
- 10.3.2. Demand Response Analysis
- 10.3.3. Grid Optimization Analysis
- 10.4. Market Analysis, Insights and Forecast - by End-user Vertical
- 10.4.1. Private Sector (SMEs and Large Enterprises)
- 10.4.2. Public Sector
- 10.1. Market Analysis, Insights and Forecast - by Deployment
- 11. North America Smart Grid Data Analytics Industry Analysis, Insights and Forecast, 2019-2031
- 11.1. Market Analysis, Insights and Forecast - By Country/Sub-region
- 11.1.1.
- 12. Europe Smart Grid Data Analytics Industry Analysis, Insights and Forecast, 2019-2031
- 12.1. Market Analysis, Insights and Forecast - By Country/Sub-region
- 12.1.1.
- 13. Asia Pacific Smart Grid Data Analytics Industry Analysis, Insights and Forecast, 2019-2031
- 13.1. Market Analysis, Insights and Forecast - By Country/Sub-region
- 13.1.1.
- 14. Latin America Smart Grid Data Analytics Industry Analysis, Insights and Forecast, 2019-2031
- 14.1. Market Analysis, Insights and Forecast - By Country/Sub-region
- 14.1.1.
- 15. Middle East Smart Grid Data Analytics Industry Analysis, Insights and Forecast, 2019-2031
- 15.1. Market Analysis, Insights and Forecast - By Country/Sub-region
- 15.1.1.
- 16. Competitive Analysis
- 16.1. Global Market Share Analysis 2024
- 16.2. Company Profiles
- 16.2.1 AutoGrid Systems Inc
- 16.2.1.1. Overview
- 16.2.1.2. Products
- 16.2.1.3. SWOT Analysis
- 16.2.1.4. Recent Developments
- 16.2.1.5. Financials (Based on Availability)
- 16.2.2 SAS Institute Inc
- 16.2.2.1. Overview
- 16.2.2.2. Products
- 16.2.2.3. SWOT Analysis
- 16.2.2.4. Recent Developments
- 16.2.2.5. Financials (Based on Availability)
- 16.2.3 Itron Inc
- 16.2.3.1. Overview
- 16.2.3.2. Products
- 16.2.3.3. SWOT Analysis
- 16.2.3.4. Recent Developments
- 16.2.3.5. Financials (Based on Availability)
- 16.2.4 Tantalus System Corporation
- 16.2.4.1. Overview
- 16.2.4.2. Products
- 16.2.4.3. SWOT Analysis
- 16.2.4.4. Recent Developments
- 16.2.4.5. Financials (Based on Availability)
- 16.2.5 Amdocs Corporation
- 16.2.5.1. Overview
- 16.2.5.2. Products
- 16.2.5.3. SWOT Analysis
- 16.2.5.4. Recent Developments
- 16.2.5.5. Financials (Based on Availability)
- 16.2.6 Uplight Inc
- 16.2.6.1. Overview
- 16.2.6.2. Products
- 16.2.6.3. SWOT Analysis
- 16.2.6.4. Recent Developments
- 16.2.6.5. Financials (Based on Availability)
- 16.2.7 IBM Corporation
- 16.2.7.1. Overview
- 16.2.7.2. Products
- 16.2.7.3. SWOT Analysis
- 16.2.7.4. Recent Developments
- 16.2.7.5. Financials (Based on Availability)
- 16.2.8 Landis & Gyr Group AG
- 16.2.8.1. Overview
- 16.2.8.2. Products
- 16.2.8.3. SWOT Analysis
- 16.2.8.4. Recent Developments
- 16.2.8.5. Financials (Based on Availability)
- 16.2.9 Hitachi Ltd
- 16.2.9.1. Overview
- 16.2.9.2. Products
- 16.2.9.3. SWOT Analysis
- 16.2.9.4. Recent Developments
- 16.2.9.5. Financials (Based on Availability)
- 16.2.10 Siemens AG
- 16.2.10.1. Overview
- 16.2.10.2. Products
- 16.2.10.3. SWOT Analysis
- 16.2.10.4. Recent Developments
- 16.2.10.5. Financials (Based on Availability)
- 16.2.11 Schneider Electric SE
- 16.2.11.1. Overview
- 16.2.11.2. Products
- 16.2.11.3. SWOT Analysis
- 16.2.11.4. Recent Developments
- 16.2.11.5. Financials (Based on Availability)
- 16.2.12 Sensus USA Inc (Xylem Inc )*List Not Exhaustive
- 16.2.12.1. Overview
- 16.2.12.2. Products
- 16.2.12.3. SWOT Analysis
- 16.2.12.4. Recent Developments
- 16.2.12.5. Financials (Based on Availability)
- 16.2.13 Oracle Corporation
- 16.2.13.1. Overview
- 16.2.13.2. Products
- 16.2.13.3. SWOT Analysis
- 16.2.13.4. Recent Developments
- 16.2.13.5. Financials (Based on Availability)
- 16.2.14 Uptake Technologies Inc
- 16.2.14.1. Overview
- 16.2.14.2. Products
- 16.2.14.3. SWOT Analysis
- 16.2.14.4. Recent Developments
- 16.2.14.5. Financials (Based on Availability)
- 16.2.15 General Electric Company
- 16.2.15.1. Overview
- 16.2.15.2. Products
- 16.2.15.3. SWOT Analysis
- 16.2.15.4. Recent Developments
- 16.2.15.5. Financials (Based on Availability)
- 16.2.16 SAP SE
- 16.2.16.1. Overview
- 16.2.16.2. Products
- 16.2.16.3. SWOT Analysis
- 16.2.16.4. Recent Developments
- 16.2.16.5. Financials (Based on Availability)
- 16.2.1 AutoGrid Systems Inc
List of Figures
- Figure 1: Global Smart Grid Data Analytics Industry Revenue Breakdown (Million, %) by Region 2024 & 2032
- Figure 2: North America Smart Grid Data Analytics Industry Revenue (Million), by Country 2024 & 2032
- Figure 3: North America Smart Grid Data Analytics Industry Revenue Share (%), by Country 2024 & 2032
- Figure 4: Europe Smart Grid Data Analytics Industry Revenue (Million), by Country 2024 & 2032
- Figure 5: Europe Smart Grid Data Analytics Industry Revenue Share (%), by Country 2024 & 2032
- Figure 6: Asia Pacific Smart Grid Data Analytics Industry Revenue (Million), by Country 2024 & 2032
- Figure 7: Asia Pacific Smart Grid Data Analytics Industry Revenue Share (%), by Country 2024 & 2032
- Figure 8: Latin America Smart Grid Data Analytics Industry Revenue (Million), by Country 2024 & 2032
- Figure 9: Latin America Smart Grid Data Analytics Industry Revenue Share (%), by Country 2024 & 2032
- Figure 10: Middle East Smart Grid Data Analytics Industry Revenue (Million), by Country 2024 & 2032
- Figure 11: Middle East Smart Grid Data Analytics Industry Revenue Share (%), by Country 2024 & 2032
- Figure 12: North America Smart Grid Data Analytics Industry Revenue (Million), by Deployment 2024 & 2032
- Figure 13: North America Smart Grid Data Analytics Industry Revenue Share (%), by Deployment 2024 & 2032
- Figure 14: North America Smart Grid Data Analytics Industry Revenue (Million), by Solution 2024 & 2032
- Figure 15: North America Smart Grid Data Analytics Industry Revenue Share (%), by Solution 2024 & 2032
- Figure 16: North America Smart Grid Data Analytics Industry Revenue (Million), by Application 2024 & 2032
- Figure 17: North America Smart Grid Data Analytics Industry Revenue Share (%), by Application 2024 & 2032
- Figure 18: North America Smart Grid Data Analytics Industry Revenue (Million), by End-user Vertical 2024 & 2032
- Figure 19: North America Smart Grid Data Analytics Industry Revenue Share (%), by End-user Vertical 2024 & 2032
- Figure 20: North America Smart Grid Data Analytics Industry Revenue (Million), by Country 2024 & 2032
- Figure 21: North America Smart Grid Data Analytics Industry Revenue Share (%), by Country 2024 & 2032
- Figure 22: Europe Smart Grid Data Analytics Industry Revenue (Million), by Deployment 2024 & 2032
- Figure 23: Europe Smart Grid Data Analytics Industry Revenue Share (%), by Deployment 2024 & 2032
- Figure 24: Europe Smart Grid Data Analytics Industry Revenue (Million), by Solution 2024 & 2032
- Figure 25: Europe Smart Grid Data Analytics Industry Revenue Share (%), by Solution 2024 & 2032
- Figure 26: Europe Smart Grid Data Analytics Industry Revenue (Million), by Application 2024 & 2032
- Figure 27: Europe Smart Grid Data Analytics Industry Revenue Share (%), by Application 2024 & 2032
- Figure 28: Europe Smart Grid Data Analytics Industry Revenue (Million), by End-user Vertical 2024 & 2032
- Figure 29: Europe Smart Grid Data Analytics Industry Revenue Share (%), by End-user Vertical 2024 & 2032
- Figure 30: Europe Smart Grid Data Analytics Industry Revenue (Million), by Country 2024 & 2032
- Figure 31: Europe Smart Grid Data Analytics Industry Revenue Share (%), by Country 2024 & 2032
- Figure 32: Asia Pacific Smart Grid Data Analytics Industry Revenue (Million), by Deployment 2024 & 2032
- Figure 33: Asia Pacific Smart Grid Data Analytics Industry Revenue Share (%), by Deployment 2024 & 2032
- Figure 34: Asia Pacific Smart Grid Data Analytics Industry Revenue (Million), by Solution 2024 & 2032
- Figure 35: Asia Pacific Smart Grid Data Analytics Industry Revenue Share (%), by Solution 2024 & 2032
- Figure 36: Asia Pacific Smart Grid Data Analytics Industry Revenue (Million), by Application 2024 & 2032
- Figure 37: Asia Pacific Smart Grid Data Analytics Industry Revenue Share (%), by Application 2024 & 2032
- Figure 38: Asia Pacific Smart Grid Data Analytics Industry Revenue (Million), by End-user Vertical 2024 & 2032
- Figure 39: Asia Pacific Smart Grid Data Analytics Industry Revenue Share (%), by End-user Vertical 2024 & 2032
- Figure 40: Asia Pacific Smart Grid Data Analytics Industry Revenue (Million), by Country 2024 & 2032
- Figure 41: Asia Pacific Smart Grid Data Analytics Industry Revenue Share (%), by Country 2024 & 2032
- Figure 42: Latin America Smart Grid Data Analytics Industry Revenue (Million), by Deployment 2024 & 2032
- Figure 43: Latin America Smart Grid Data Analytics Industry Revenue Share (%), by Deployment 2024 & 2032
- Figure 44: Latin America Smart Grid Data Analytics Industry Revenue (Million), by Solution 2024 & 2032
- Figure 45: Latin America Smart Grid Data Analytics Industry Revenue Share (%), by Solution 2024 & 2032
- Figure 46: Latin America Smart Grid Data Analytics Industry Revenue (Million), by Application 2024 & 2032
- Figure 47: Latin America Smart Grid Data Analytics Industry Revenue Share (%), by Application 2024 & 2032
- Figure 48: Latin America Smart Grid Data Analytics Industry Revenue (Million), by End-user Vertical 2024 & 2032
- Figure 49: Latin America Smart Grid Data Analytics Industry Revenue Share (%), by End-user Vertical 2024 & 2032
- Figure 50: Latin America Smart Grid Data Analytics Industry Revenue (Million), by Country 2024 & 2032
- Figure 51: Latin America Smart Grid Data Analytics Industry Revenue Share (%), by Country 2024 & 2032
- Figure 52: Middle East Smart Grid Data Analytics Industry Revenue (Million), by Deployment 2024 & 2032
- Figure 53: Middle East Smart Grid Data Analytics Industry Revenue Share (%), by Deployment 2024 & 2032
- Figure 54: Middle East Smart Grid Data Analytics Industry Revenue (Million), by Solution 2024 & 2032
- Figure 55: Middle East Smart Grid Data Analytics Industry Revenue Share (%), by Solution 2024 & 2032
- Figure 56: Middle East Smart Grid Data Analytics Industry Revenue (Million), by Application 2024 & 2032
- Figure 57: Middle East Smart Grid Data Analytics Industry Revenue Share (%), by Application 2024 & 2032
- Figure 58: Middle East Smart Grid Data Analytics Industry Revenue (Million), by End-user Vertical 2024 & 2032
- Figure 59: Middle East Smart Grid Data Analytics Industry Revenue Share (%), by End-user Vertical 2024 & 2032
- Figure 60: Middle East Smart Grid Data Analytics Industry Revenue (Million), by Country 2024 & 2032
- Figure 61: Middle East Smart Grid Data Analytics Industry Revenue Share (%), by Country 2024 & 2032
List of Tables
- Table 1: Global Smart Grid Data Analytics Industry Revenue Million Forecast, by Region 2019 & 2032
- Table 2: Global Smart Grid Data Analytics Industry Revenue Million Forecast, by Deployment 2019 & 2032
- Table 3: Global Smart Grid Data Analytics Industry Revenue Million Forecast, by Solution 2019 & 2032
- Table 4: Global Smart Grid Data Analytics Industry Revenue Million Forecast, by Application 2019 & 2032
- Table 5: Global Smart Grid Data Analytics Industry Revenue Million Forecast, by End-user Vertical 2019 & 2032
- Table 6: Global Smart Grid Data Analytics Industry Revenue Million Forecast, by Region 2019 & 2032
- Table 7: Global Smart Grid Data Analytics Industry Revenue Million Forecast, by Country 2019 & 2032
- Table 8: Smart Grid Data Analytics Industry Revenue (Million) Forecast, by Application 2019 & 2032
- Table 9: Global Smart Grid Data Analytics Industry Revenue Million Forecast, by Country 2019 & 2032
- Table 10: Smart Grid Data Analytics Industry Revenue (Million) Forecast, by Application 2019 & 2032
- Table 11: Global Smart Grid Data Analytics Industry Revenue Million Forecast, by Country 2019 & 2032
- Table 12: Smart Grid Data Analytics Industry Revenue (Million) Forecast, by Application 2019 & 2032
- Table 13: Global Smart Grid Data Analytics Industry Revenue Million Forecast, by Country 2019 & 2032
- Table 14: Smart Grid Data Analytics Industry Revenue (Million) Forecast, by Application 2019 & 2032
- Table 15: Global Smart Grid Data Analytics Industry Revenue Million Forecast, by Country 2019 & 2032
- Table 16: Smart Grid Data Analytics Industry Revenue (Million) Forecast, by Application 2019 & 2032
- Table 17: Global Smart Grid Data Analytics Industry Revenue Million Forecast, by Deployment 2019 & 2032
- Table 18: Global Smart Grid Data Analytics Industry Revenue Million Forecast, by Solution 2019 & 2032
- Table 19: Global Smart Grid Data Analytics Industry Revenue Million Forecast, by Application 2019 & 2032
- Table 20: Global Smart Grid Data Analytics Industry Revenue Million Forecast, by End-user Vertical 2019 & 2032
- Table 21: Global Smart Grid Data Analytics Industry Revenue Million Forecast, by Country 2019 & 2032
- Table 22: Global Smart Grid Data Analytics Industry Revenue Million Forecast, by Deployment 2019 & 2032
- Table 23: Global Smart Grid Data Analytics Industry Revenue Million Forecast, by Solution 2019 & 2032
- Table 24: Global Smart Grid Data Analytics Industry Revenue Million Forecast, by Application 2019 & 2032
- Table 25: Global Smart Grid Data Analytics Industry Revenue Million Forecast, by End-user Vertical 2019 & 2032
- Table 26: Global Smart Grid Data Analytics Industry Revenue Million Forecast, by Country 2019 & 2032
- Table 27: Global Smart Grid Data Analytics Industry Revenue Million Forecast, by Deployment 2019 & 2032
- Table 28: Global Smart Grid Data Analytics Industry Revenue Million Forecast, by Solution 2019 & 2032
- Table 29: Global Smart Grid Data Analytics Industry Revenue Million Forecast, by Application 2019 & 2032
- Table 30: Global Smart Grid Data Analytics Industry Revenue Million Forecast, by End-user Vertical 2019 & 2032
- Table 31: Global Smart Grid Data Analytics Industry Revenue Million Forecast, by Country 2019 & 2032
- Table 32: Global Smart Grid Data Analytics Industry Revenue Million Forecast, by Deployment 2019 & 2032
- Table 33: Global Smart Grid Data Analytics Industry Revenue Million Forecast, by Solution 2019 & 2032
- Table 34: Global Smart Grid Data Analytics Industry Revenue Million Forecast, by Application 2019 & 2032
- Table 35: Global Smart Grid Data Analytics Industry Revenue Million Forecast, by End-user Vertical 2019 & 2032
- Table 36: Global Smart Grid Data Analytics Industry Revenue Million Forecast, by Country 2019 & 2032
- Table 37: Global Smart Grid Data Analytics Industry Revenue Million Forecast, by Deployment 2019 & 2032
- Table 38: Global Smart Grid Data Analytics Industry Revenue Million Forecast, by Solution 2019 & 2032
- Table 39: Global Smart Grid Data Analytics Industry Revenue Million Forecast, by Application 2019 & 2032
- Table 40: Global Smart Grid Data Analytics Industry Revenue Million Forecast, by End-user Vertical 2019 & 2032
- Table 41: Global Smart Grid Data Analytics Industry Revenue Million Forecast, by Country 2019 & 2032
Frequently Asked Questions
1. What is the projected Compound Annual Growth Rate (CAGR) of the Smart Grid Data Analytics Industry?
The projected CAGR is approximately 12.76%.
2. Which companies are prominent players in the Smart Grid Data Analytics Industry?
Key companies in the market include AutoGrid Systems Inc, SAS Institute Inc, Itron Inc, Tantalus System Corporation, Amdocs Corporation, Uplight Inc, IBM Corporation, Landis & Gyr Group AG, Hitachi Ltd, Siemens AG, Schneider Electric SE, Sensus USA Inc (Xylem Inc )*List Not Exhaustive, Oracle Corporation, Uptake Technologies Inc, General Electric Company, SAP SE.
3. What are the main segments of the Smart Grid Data Analytics Industry?
The market segments include Deployment, Solution, Application, End-user Vertical.
4. Can you provide details about the market size?
The market size is estimated to be USD XX Million as of 2022.
5. What are some drivers contributing to market growth?
Growing Investments in Smart Grid Projects; Enormous Influx of Data.
6. What are the notable trends driving market growth?
Growing Investments in Smart Grid Projects.
7. Are there any restraints impacting market growth?
Technical Difficulties.
8. Can you provide examples of recent developments in the market?
November 2022: Siemens Smart Infrastructure partnered with SEW, a prominent cloud platform provider that specializes in digital customer experiences and workforce experiences for utility providers, to support utilities globally, improve the customer and workforce experiences for utility smart meter users, and facilitate the transition to a world powered entirely by renewable energy sources. The companies say that this move could lead to a long-term partnership that will help move forward the new platform paradigm in energy and utilities and speed up the digital transformation process.
9. What pricing options are available for accessing the report?
Pricing options include single-user, multi-user, and enterprise licenses priced at USD 4750, USD 5250, and USD 8750 respectively.
10. Is the market size provided in terms of value or volume?
The market size is provided in terms of value, measured in Million.
11. Are there any specific market keywords associated with the report?
Yes, the market keyword associated with the report is "Smart Grid Data Analytics Industry," which aids in identifying and referencing the specific market segment covered.
12. How do I determine which pricing option suits my needs best?
The pricing options vary based on user requirements and access needs. Individual users may opt for single-user licenses, while businesses requiring broader access may choose multi-user or enterprise licenses for cost-effective access to the report.
13. Are there any additional resources or data provided in the Smart Grid Data Analytics Industry report?
While the report offers comprehensive insights, it's advisable to review the specific contents or supplementary materials provided to ascertain if additional resources or data are available.
14. How can I stay updated on further developments or reports in the Smart Grid Data Analytics Industry?
To stay informed about further developments, trends, and reports in the Smart Grid Data Analytics Industry, consider subscribing to industry newsletters, following relevant companies and organizations, or regularly checking reputable industry news sources and publications.
Methodology
Step 1 - Identification of Relevant Samples Size from Population Database


Step 2 - Approaches for Defining Global Market Size (Value, Volume* & Price*)

Note*: In applicable scenarios
Step 3 - Data Sources
Primary Research
- Web Analytics
- Survey Reports
- Research Institute
- Latest Research Reports
- Opinion Leaders
Secondary Research
- Annual Reports
- White Paper
- Latest Press Release
- Industry Association
- Paid Database
- Investor Presentations

Step 4 - Data Triangulation
Involves using different sources of information in order to increase the validity of a study
These sources are likely to be stakeholders in a program - participants, other researchers, program staff, other community members, and so on.
Then we put all data in single framework & apply various statistical tools to find out the dynamic on the market.
During the analysis stage, feedback from the stakeholder groups would be compared to determine areas of agreement as well as areas of divergence


