
Key Insights
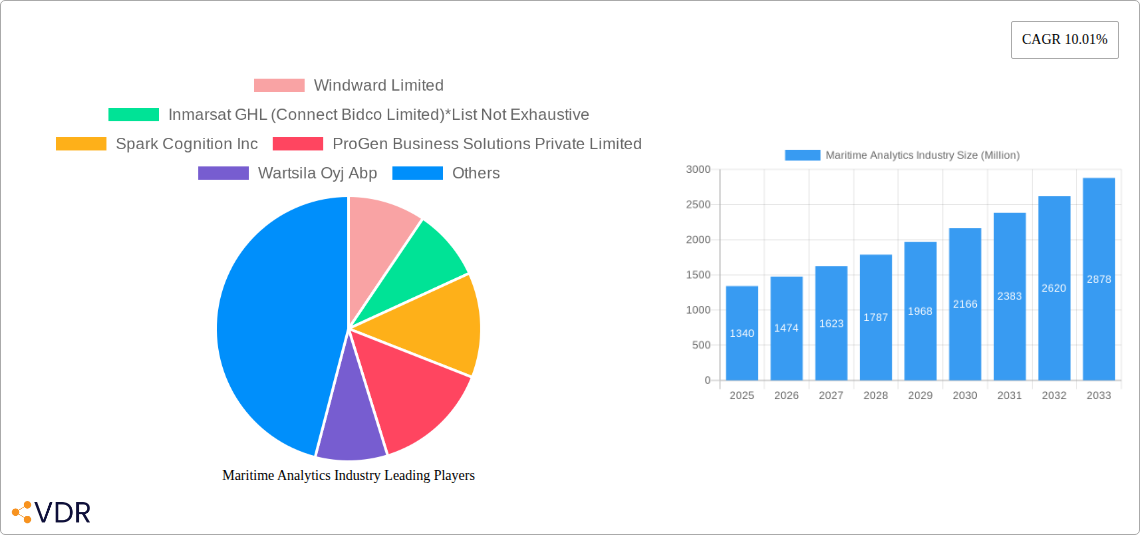
The Maritime Analytics market, valued at $1.34 billion in 2025, is poised for substantial growth, exhibiting a Compound Annual Growth Rate (CAGR) of 10.01% from 2025 to 2033. This robust expansion is driven by several key factors. The increasing need for enhanced operational efficiency and safety within the shipping industry is a major catalyst. Maritime analytics solutions, encompassing predictive and prescriptive maintenance, voyage optimization, and fleet management, offer significant cost savings and risk mitigation. Furthermore, stricter regulatory compliance requirements and the growing adoption of digital technologies across the maritime sector are fueling demand. The Government segment is a significant contributor, driven by initiatives to enhance maritime security and environmental protection. The Commercial segment, encompassing shipping companies and logistics providers, is also witnessing strong growth due to the competitive advantages offered by data-driven decision-making. Specific applications like predictive maintenance are gaining traction as they enable proactive interventions, minimizing downtime and operational disruptions.
The market segmentation reveals a diverse landscape, with significant contributions from North America and Europe, representing mature markets with advanced technological adoption. However, the Asia-Pacific region is expected to witness the fastest growth, fueled by increasing maritime trade and investment in digital infrastructure. Key players like Windward Limited, Inmarsat, and Spark Cognition are actively shaping the market through innovation and strategic partnerships. While challenges remain, such as data integration complexities and the need for skilled professionals, the overall market outlook remains highly positive, indicating substantial growth opportunities in the coming years. The ongoing development of advanced analytics techniques, such as AI and machine learning, will further accelerate market expansion and enhance the capabilities of maritime analytics solutions. This will lead to more sophisticated predictive models and improved decision-making processes across various maritime applications.
This comprehensive report provides a detailed analysis of the Maritime Analytics market, encompassing market size, growth trends, key players, and future outlook. With a focus on the parent market of Maritime Technology and the child market of Vessel Analytics, this report is essential for industry professionals, investors, and strategic decision-makers seeking a deep understanding of this dynamic sector. The study period covers 2019-2033, with 2025 as the base and estimated year. The forecast period spans 2025-2033, and the historical period is 2019-2024. The market is valued in millions of units.
Maritime Analytics Industry Market Dynamics & Structure
The Maritime Analytics market is characterized by moderate concentration, with several key players vying for market share. Technological innovation, particularly in AI and IoT, is a major driver, while regulatory frameworks like IMO 2020 and evolving cybersecurity concerns significantly influence market dynamics. The market witnesses continuous mergers and acquisitions (M&A) activity, reflecting consolidation and expansion strategies amongst players. Competitive substitutes include traditional methods of data analysis, but the efficiency and predictive capabilities of analytics are driving adoption. End-user demographics are shifting towards greater adoption by both government and commercial entities, emphasizing the importance of data-driven decision-making.
- Market Concentration: Moderately concentrated, with top 5 players holding approximately xx% market share in 2024.
- Technological Innovation: AI, machine learning, IoT, and big data analytics are key drivers, enabling predictive maintenance and route optimization.
- Regulatory Framework: IMO 2020 regulations and cybersecurity standards are shaping market demands for compliant solutions.
- M&A Activity: A notable increase in M&A activity observed in recent years (xx deals in 2024, xx% increase year-on-year).
- End-User Demographics: A balanced mix of government and commercial end-users, with increasing adoption across both sectors.
- Innovation Barriers: High initial investment costs, integration complexity, and data security concerns present barriers to entry.
Maritime Analytics Industry Growth Trends & Insights
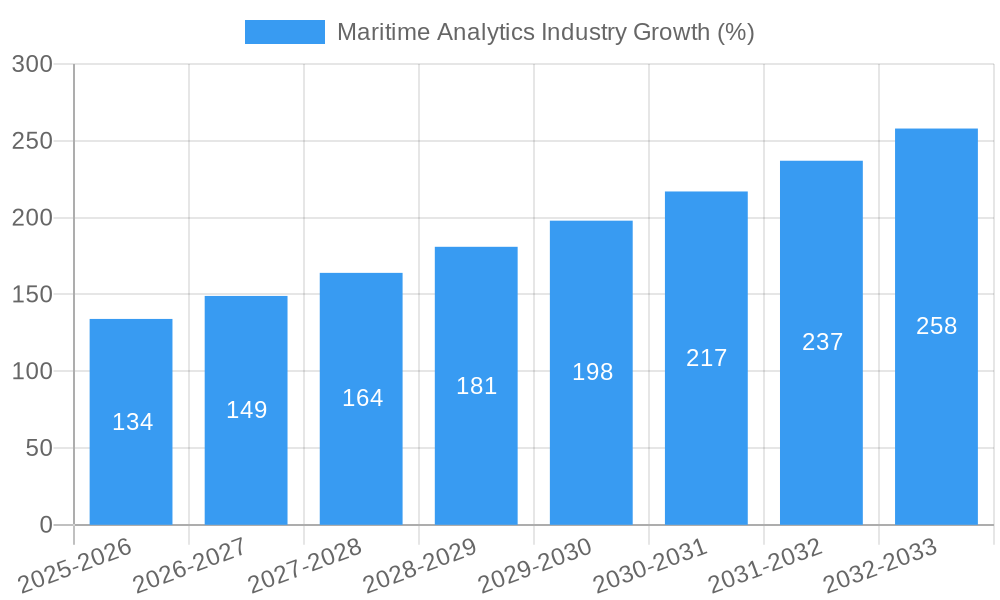
The Maritime Analytics market is experiencing robust growth, driven by the increasing need for operational efficiency, safety enhancements, and regulatory compliance within the shipping industry. The adoption rate of analytics solutions is steadily increasing, particularly among larger shipping companies and government agencies. Technological disruptions, such as the integration of AI and IoT, are revolutionizing data analysis capabilities, leading to significant improvements in predictive maintenance, route optimization, and fuel efficiency. Consumer behavior is shifting towards proactive risk management and cost reduction, fueling demand for sophisticated analytics platforms.
The market size is projected to reach xx Million in 2025 and xx Million by 2033, exhibiting a CAGR of xx% during the forecast period. Market penetration is expected to increase from xx% in 2024 to xx% by 2033, driven by widespread adoption across various vessel types and applications.
Dominant Regions, Countries, or Segments in Maritime Analytics Industry
The Maritime Analytics market is geographically diverse, with notable dominance in specific regions and segments. North America and Europe currently lead the market, driven by robust technological infrastructure, high adoption rates, and stringent regulatory frameworks. Within the end-user segment, the commercial sector accounts for a significant share of the market, propelled by the growing need for operational efficiency and cost optimization within shipping companies. By application, Predictive and Prescriptive Maintenance and Voyage Operations are the most significant drivers, owing to their direct impact on operational costs and vessel safety.
- Leading Region: North America and Europe hold significant market share (xx% and xx%, respectively, in 2024).
- Dominant End-User: Commercial sector leads with xx% market share in 2024, driven by cost optimization needs.
- Key Application: Predictive and Prescriptive Maintenance and Voyage Operations are leading applications, contributing xx% and xx% to total market value respectively in 2024.
- Growth Potential: Asia-Pacific presents significant growth potential due to increasing shipping activities and infrastructure development.
Maritime Analytics Industry Product Landscape
The Maritime Analytics product landscape is evolving rapidly, with innovative solutions offering enhanced functionalities. Products range from basic fleet management systems to sophisticated AI-powered predictive maintenance platforms. Key features include real-time data visualization, predictive analytics capabilities, and integration with existing vessel systems. Unique selling propositions often involve proprietary algorithms, advanced data processing capabilities, and seamless integration with existing workflows. Technological advancements are focused on improving data accuracy, reducing latency, and expanding the range of analytical applications.
Key Drivers, Barriers & Challenges in Maritime Analytics Industry
Key Drivers: Increased operational efficiency demands, stringent environmental regulations (like IMO 2020), and the need for improved vessel safety are driving market growth. Technological advancements in AI and IoT are enabling advanced analytical capabilities. Government initiatives promoting digitalization in the maritime sector further accelerate adoption.
Key Challenges and Restraints: High implementation costs, lack of skilled workforce, data security concerns, and integration complexities hinder widespread adoption. Supply chain disruptions can impact the availability of hardware and software components. Regulatory hurdles and competitive pressures also present challenges. The impact of these challenges is estimated to reduce market growth by approximately xx% by 2033.
Emerging Opportunities in Maritime Analytics Industry
Untapped markets in developing economies, increasing focus on cybersecurity in the maritime domain, and the integration of blockchain technology for secure data management offer significant opportunities. The rise of autonomous vessels and the development of advanced analytics for route optimization and fuel efficiency are also creating new avenues for growth. Growing concerns around sustainability are pushing demand for solutions addressing fuel efficiency and emissions monitoring.
Growth Accelerators in the Maritime Analytics Industry Industry
Technological breakthroughs in AI and machine learning, strategic partnerships between technology providers and shipping companies, and market expansion into new geographical regions are key growth accelerators. Government support for digitalization initiatives in the maritime sector is further propelling market growth. The increasing adoption of cloud-based solutions and the development of open-standard data exchange platforms are also contributing to accelerated growth.
Key Players Shaping the Maritime Analytics Industry Market
- Windward Limited
- Inmarsat GHL (Connect Bidco Limited)
- Spark Cognition Inc
- ProGen Business Solutions Private Limited
- Wartsila Oyj Abp
- Amplify Mindware Private Limited
- ABB Limited
- Prisma Electronics SA (Laros)
- U-Ming Marine Transport Corporation
- Spire Global Inc
Notable Milestones in Maritime Analytics Industry Sector
- May 2022: Wärtsilä developed and received orders for 70 vessels, increasing market share to over 20% and installing over 100 MWh of battery capacity. This demonstrates the growing adoption of hybrid propulsion systems.
- March 2022: The launch of M.V. Cemtex Excellence showcased advancements in eco-efficient features and digital operating systems, highlighting the role of analytics in improving vessel performance.
- January 2022: NAVTOR's acquisition of Ingenium Marine and Tres Solutions strengthened its e-Navigation and performance optimization offerings, demonstrating consolidation in the market.
In-Depth Maritime Analytics Industry Market Outlook
The Maritime Analytics market is poised for significant growth, driven by continuous technological innovation, increasing regulatory pressure, and the persistent demand for enhanced operational efficiency within the shipping industry. Strategic partnerships and collaborations are expected to accelerate market penetration, while expansion into new geographic markets and applications will create new revenue streams. The potential for further market consolidation through mergers and acquisitions also points towards a promising future for the sector.
Maritime Analytics Industry Segmentation
-
1. Application
- 1.1. Predictive and Prescriptive Maintenance
- 1.2. Voyage Operations
- 1.3. Fleet Management
- 1.4. Other Applications
-
2. End-User
- 2.1. Government
- 2.2. Commercial
Maritime Analytics Industry Segmentation By Geography
- 1. North America
- 2. Europe
- 3. Asia Pacific
- 4. Rest of the World

Maritime Analytics Industry REPORT HIGHLIGHTS
| Aspects | Details |
|---|---|
| Study Period | 2019-2033 |
| Base Year | 2024 |
| Estimated Year | 2025 |
| Forecast Period | 2025-2033 |
| Historical Period | 2019-2024 |
| Growth Rate | CAGR of 10.01% from 2019-2033 |
| Segmentation |
|
Table of Contents
- 1. Introduction
- 1.1. Research Scope
- 1.2. Market Segmentation
- 1.3. Research Methodology
- 1.4. Definitions and Assumptions
- 2. Executive Summary
- 2.1. Introduction
- 3. Market Dynamics
- 3.1. Introduction
- 3.2. Market Drivers
- 3.2.1. Increasing Penetration of Digitization in the Maritime Industry; Increase in Seaborne Trade
- 3.3. Market Restrains
- 3.3.1. High Installation Cost; Lack of Uninterrupted and Seamless Internet Connectivity
- 3.4. Market Trends
- 3.4.1. Government Segment is Expected to Drive the Market
- 4. Market Factor Analysis
- 4.1. Porters Five Forces
- 4.2. Supply/Value Chain
- 4.3. PESTEL analysis
- 4.4. Market Entropy
- 4.5. Patent/Trademark Analysis
- 5. Global Maritime Analytics Industry Analysis, Insights and Forecast, 2019-2031
- 5.1. Market Analysis, Insights and Forecast - by Application
- 5.1.1. Predictive and Prescriptive Maintenance
- 5.1.2. Voyage Operations
- 5.1.3. Fleet Management
- 5.1.4. Other Applications
- 5.2. Market Analysis, Insights and Forecast - by End-User
- 5.2.1. Government
- 5.2.2. Commercial
- 5.3. Market Analysis, Insights and Forecast - by Region
- 5.3.1. North America
- 5.3.2. Europe
- 5.3.3. Asia Pacific
- 5.3.4. Rest of the World
- 5.1. Market Analysis, Insights and Forecast - by Application
- 6. North America Maritime Analytics Industry Analysis, Insights and Forecast, 2019-2031
- 6.1. Market Analysis, Insights and Forecast - by Application
- 6.1.1. Predictive and Prescriptive Maintenance
- 6.1.2. Voyage Operations
- 6.1.3. Fleet Management
- 6.1.4. Other Applications
- 6.2. Market Analysis, Insights and Forecast - by End-User
- 6.2.1. Government
- 6.2.2. Commercial
- 6.1. Market Analysis, Insights and Forecast - by Application
- 7. Europe Maritime Analytics Industry Analysis, Insights and Forecast, 2019-2031
- 7.1. Market Analysis, Insights and Forecast - by Application
- 7.1.1. Predictive and Prescriptive Maintenance
- 7.1.2. Voyage Operations
- 7.1.3. Fleet Management
- 7.1.4. Other Applications
- 7.2. Market Analysis, Insights and Forecast - by End-User
- 7.2.1. Government
- 7.2.2. Commercial
- 7.1. Market Analysis, Insights and Forecast - by Application
- 8. Asia Pacific Maritime Analytics Industry Analysis, Insights and Forecast, 2019-2031
- 8.1. Market Analysis, Insights and Forecast - by Application
- 8.1.1. Predictive and Prescriptive Maintenance
- 8.1.2. Voyage Operations
- 8.1.3. Fleet Management
- 8.1.4. Other Applications
- 8.2. Market Analysis, Insights and Forecast - by End-User
- 8.2.1. Government
- 8.2.2. Commercial
- 8.1. Market Analysis, Insights and Forecast - by Application
- 9. Rest of the World Maritime Analytics Industry Analysis, Insights and Forecast, 2019-2031
- 9.1. Market Analysis, Insights and Forecast - by Application
- 9.1.1. Predictive and Prescriptive Maintenance
- 9.1.2. Voyage Operations
- 9.1.3. Fleet Management
- 9.1.4. Other Applications
- 9.2. Market Analysis, Insights and Forecast - by End-User
- 9.2.1. Government
- 9.2.2. Commercial
- 9.1. Market Analysis, Insights and Forecast - by Application
- 10. North America Maritime Analytics Industry Analysis, Insights and Forecast, 2019-2031
- 10.1. Market Analysis, Insights and Forecast - By Country/Sub-region
- 10.1.1.
- 11. Europe Maritime Analytics Industry Analysis, Insights and Forecast, 2019-2031
- 11.1. Market Analysis, Insights and Forecast - By Country/Sub-region
- 11.1.1.
- 12. Asia Pacific Maritime Analytics Industry Analysis, Insights and Forecast, 2019-2031
- 12.1. Market Analysis, Insights and Forecast - By Country/Sub-region
- 12.1.1.
- 13. Rest of the World Maritime Analytics Industry Analysis, Insights and Forecast, 2019-2031
- 13.1. Market Analysis, Insights and Forecast - By Country/Sub-region
- 13.1.1.
- 14. Competitive Analysis
- 14.1. Global Market Share Analysis 2024
- 14.2. Company Profiles
- 14.2.1 Windward Limited
- 14.2.1.1. Overview
- 14.2.1.2. Products
- 14.2.1.3. SWOT Analysis
- 14.2.1.4. Recent Developments
- 14.2.1.5. Financials (Based on Availability)
- 14.2.2 Inmarsat GHL (Connect Bidco Limited)*List Not Exhaustive
- 14.2.2.1. Overview
- 14.2.2.2. Products
- 14.2.2.3. SWOT Analysis
- 14.2.2.4. Recent Developments
- 14.2.2.5. Financials (Based on Availability)
- 14.2.3 Spark Cognition Inc
- 14.2.3.1. Overview
- 14.2.3.2. Products
- 14.2.3.3. SWOT Analysis
- 14.2.3.4. Recent Developments
- 14.2.3.5. Financials (Based on Availability)
- 14.2.4 ProGen Business Solutions Private Limited
- 14.2.4.1. Overview
- 14.2.4.2. Products
- 14.2.4.3. SWOT Analysis
- 14.2.4.4. Recent Developments
- 14.2.4.5. Financials (Based on Availability)
- 14.2.5 Wartsila Oyj Abp
- 14.2.5.1. Overview
- 14.2.5.2. Products
- 14.2.5.3. SWOT Analysis
- 14.2.5.4. Recent Developments
- 14.2.5.5. Financials (Based on Availability)
- 14.2.6 Amplify Mindware Private Limited
- 14.2.6.1. Overview
- 14.2.6.2. Products
- 14.2.6.3. SWOT Analysis
- 14.2.6.4. Recent Developments
- 14.2.6.5. Financials (Based on Availability)
- 14.2.7 ABB Limited
- 14.2.7.1. Overview
- 14.2.7.2. Products
- 14.2.7.3. SWOT Analysis
- 14.2.7.4. Recent Developments
- 14.2.7.5. Financials (Based on Availability)
- 14.2.8 Prisma Electronics SA (Laros)
- 14.2.8.1. Overview
- 14.2.8.2. Products
- 14.2.8.3. SWOT Analysis
- 14.2.8.4. Recent Developments
- 14.2.8.5. Financials (Based on Availability)
- 14.2.9 U-Ming Marine Transport Corporation
- 14.2.9.1. Overview
- 14.2.9.2. Products
- 14.2.9.3. SWOT Analysis
- 14.2.9.4. Recent Developments
- 14.2.9.5. Financials (Based on Availability)
- 14.2.10 Spire Global Inc
- 14.2.10.1. Overview
- 14.2.10.2. Products
- 14.2.10.3. SWOT Analysis
- 14.2.10.4. Recent Developments
- 14.2.10.5. Financials (Based on Availability)
- 14.2.1 Windward Limited
List of Figures
- Figure 1: Global Maritime Analytics Industry Revenue Breakdown (Million, %) by Region 2024 & 2032
- Figure 2: North America Maritime Analytics Industry Revenue (Million), by Country 2024 & 2032
- Figure 3: North America Maritime Analytics Industry Revenue Share (%), by Country 2024 & 2032
- Figure 4: Europe Maritime Analytics Industry Revenue (Million), by Country 2024 & 2032
- Figure 5: Europe Maritime Analytics Industry Revenue Share (%), by Country 2024 & 2032
- Figure 6: Asia Pacific Maritime Analytics Industry Revenue (Million), by Country 2024 & 2032
- Figure 7: Asia Pacific Maritime Analytics Industry Revenue Share (%), by Country 2024 & 2032
- Figure 8: Rest of the World Maritime Analytics Industry Revenue (Million), by Country 2024 & 2032
- Figure 9: Rest of the World Maritime Analytics Industry Revenue Share (%), by Country 2024 & 2032
- Figure 10: North America Maritime Analytics Industry Revenue (Million), by Application 2024 & 2032
- Figure 11: North America Maritime Analytics Industry Revenue Share (%), by Application 2024 & 2032
- Figure 12: North America Maritime Analytics Industry Revenue (Million), by End-User 2024 & 2032
- Figure 13: North America Maritime Analytics Industry Revenue Share (%), by End-User 2024 & 2032
- Figure 14: North America Maritime Analytics Industry Revenue (Million), by Country 2024 & 2032
- Figure 15: North America Maritime Analytics Industry Revenue Share (%), by Country 2024 & 2032
- Figure 16: Europe Maritime Analytics Industry Revenue (Million), by Application 2024 & 2032
- Figure 17: Europe Maritime Analytics Industry Revenue Share (%), by Application 2024 & 2032
- Figure 18: Europe Maritime Analytics Industry Revenue (Million), by End-User 2024 & 2032
- Figure 19: Europe Maritime Analytics Industry Revenue Share (%), by End-User 2024 & 2032
- Figure 20: Europe Maritime Analytics Industry Revenue (Million), by Country 2024 & 2032
- Figure 21: Europe Maritime Analytics Industry Revenue Share (%), by Country 2024 & 2032
- Figure 22: Asia Pacific Maritime Analytics Industry Revenue (Million), by Application 2024 & 2032
- Figure 23: Asia Pacific Maritime Analytics Industry Revenue Share (%), by Application 2024 & 2032
- Figure 24: Asia Pacific Maritime Analytics Industry Revenue (Million), by End-User 2024 & 2032
- Figure 25: Asia Pacific Maritime Analytics Industry Revenue Share (%), by End-User 2024 & 2032
- Figure 26: Asia Pacific Maritime Analytics Industry Revenue (Million), by Country 2024 & 2032
- Figure 27: Asia Pacific Maritime Analytics Industry Revenue Share (%), by Country 2024 & 2032
- Figure 28: Rest of the World Maritime Analytics Industry Revenue (Million), by Application 2024 & 2032
- Figure 29: Rest of the World Maritime Analytics Industry Revenue Share (%), by Application 2024 & 2032
- Figure 30: Rest of the World Maritime Analytics Industry Revenue (Million), by End-User 2024 & 2032
- Figure 31: Rest of the World Maritime Analytics Industry Revenue Share (%), by End-User 2024 & 2032
- Figure 32: Rest of the World Maritime Analytics Industry Revenue (Million), by Country 2024 & 2032
- Figure 33: Rest of the World Maritime Analytics Industry Revenue Share (%), by Country 2024 & 2032
List of Tables
- Table 1: Global Maritime Analytics Industry Revenue Million Forecast, by Region 2019 & 2032
- Table 2: Global Maritime Analytics Industry Revenue Million Forecast, by Application 2019 & 2032
- Table 3: Global Maritime Analytics Industry Revenue Million Forecast, by End-User 2019 & 2032
- Table 4: Global Maritime Analytics Industry Revenue Million Forecast, by Region 2019 & 2032
- Table 5: Global Maritime Analytics Industry Revenue Million Forecast, by Country 2019 & 2032
- Table 6: Maritime Analytics Industry Revenue (Million) Forecast, by Application 2019 & 2032
- Table 7: Global Maritime Analytics Industry Revenue Million Forecast, by Country 2019 & 2032
- Table 8: Maritime Analytics Industry Revenue (Million) Forecast, by Application 2019 & 2032
- Table 9: Global Maritime Analytics Industry Revenue Million Forecast, by Country 2019 & 2032
- Table 10: Maritime Analytics Industry Revenue (Million) Forecast, by Application 2019 & 2032
- Table 11: Global Maritime Analytics Industry Revenue Million Forecast, by Country 2019 & 2032
- Table 12: Maritime Analytics Industry Revenue (Million) Forecast, by Application 2019 & 2032
- Table 13: Global Maritime Analytics Industry Revenue Million Forecast, by Application 2019 & 2032
- Table 14: Global Maritime Analytics Industry Revenue Million Forecast, by End-User 2019 & 2032
- Table 15: Global Maritime Analytics Industry Revenue Million Forecast, by Country 2019 & 2032
- Table 16: Global Maritime Analytics Industry Revenue Million Forecast, by Application 2019 & 2032
- Table 17: Global Maritime Analytics Industry Revenue Million Forecast, by End-User 2019 & 2032
- Table 18: Global Maritime Analytics Industry Revenue Million Forecast, by Country 2019 & 2032
- Table 19: Global Maritime Analytics Industry Revenue Million Forecast, by Application 2019 & 2032
- Table 20: Global Maritime Analytics Industry Revenue Million Forecast, by End-User 2019 & 2032
- Table 21: Global Maritime Analytics Industry Revenue Million Forecast, by Country 2019 & 2032
- Table 22: Global Maritime Analytics Industry Revenue Million Forecast, by Application 2019 & 2032
- Table 23: Global Maritime Analytics Industry Revenue Million Forecast, by End-User 2019 & 2032
- Table 24: Global Maritime Analytics Industry Revenue Million Forecast, by Country 2019 & 2032
Frequently Asked Questions
1. What is the projected Compound Annual Growth Rate (CAGR) of the Maritime Analytics Industry?
The projected CAGR is approximately 10.01%.
2. Which companies are prominent players in the Maritime Analytics Industry?
Key companies in the market include Windward Limited, Inmarsat GHL (Connect Bidco Limited)*List Not Exhaustive, Spark Cognition Inc, ProGen Business Solutions Private Limited, Wartsila Oyj Abp, Amplify Mindware Private Limited, ABB Limited, Prisma Electronics SA (Laros), U-Ming Marine Transport Corporation, Spire Global Inc.
3. What are the main segments of the Maritime Analytics Industry?
The market segments include Application, End-User.
4. Can you provide details about the market size?
The market size is estimated to be USD 1.34 Million as of 2022.
5. What are some drivers contributing to market growth?
Increasing Penetration of Digitization in the Maritime Industry; Increase in Seaborne Trade.
6. What are the notable trends driving market growth?
Government Segment is Expected to Drive the Market.
7. Are there any restraints impacting market growth?
High Installation Cost; Lack of Uninterrupted and Seamless Internet Connectivity.
8. Can you provide examples of recent developments in the market?
May 2022 - Wartsila had developed and received orders for 70 vessels, and this number is still rising. The company currently holds a market share of over 20% and has installed batteries with a combined capacity that exceeds 100 MWh. Hybrid vessels are more sophisticated than diesel-mechanical or fully electric vessels since their propulsion systems often mix engines and batteries.
9. What pricing options are available for accessing the report?
Pricing options include single-user, multi-user, and enterprise licenses priced at USD 4750, USD 5250, and USD 8750 respectively.
10. Is the market size provided in terms of value or volume?
The market size is provided in terms of value, measured in Million.
11. Are there any specific market keywords associated with the report?
Yes, the market keyword associated with the report is "Maritime Analytics Industry," which aids in identifying and referencing the specific market segment covered.
12. How do I determine which pricing option suits my needs best?
The pricing options vary based on user requirements and access needs. Individual users may opt for single-user licenses, while businesses requiring broader access may choose multi-user or enterprise licenses for cost-effective access to the report.
13. Are there any additional resources or data provided in the Maritime Analytics Industry report?
While the report offers comprehensive insights, it's advisable to review the specific contents or supplementary materials provided to ascertain if additional resources or data are available.
14. How can I stay updated on further developments or reports in the Maritime Analytics Industry?
To stay informed about further developments, trends, and reports in the Maritime Analytics Industry, consider subscribing to industry newsletters, following relevant companies and organizations, or regularly checking reputable industry news sources and publications.
Methodology
Step 1 - Identification of Relevant Samples Size from Population Database


Step 2 - Approaches for Defining Global Market Size (Value, Volume* & Price*)

Note*: In applicable scenarios
Step 3 - Data Sources
Primary Research
- Web Analytics
- Survey Reports
- Research Institute
- Latest Research Reports
- Opinion Leaders
Secondary Research
- Annual Reports
- White Paper
- Latest Press Release
- Industry Association
- Paid Database
- Investor Presentations

Step 4 - Data Triangulation
Involves using different sources of information in order to increase the validity of a study
These sources are likely to be stakeholders in a program - participants, other researchers, program staff, other community members, and so on.
Then we put all data in single framework & apply various statistical tools to find out the dynamic on the market.
During the analysis stage, feedback from the stakeholder groups would be compared to determine areas of agreement as well as areas of divergence


