
Key Insights
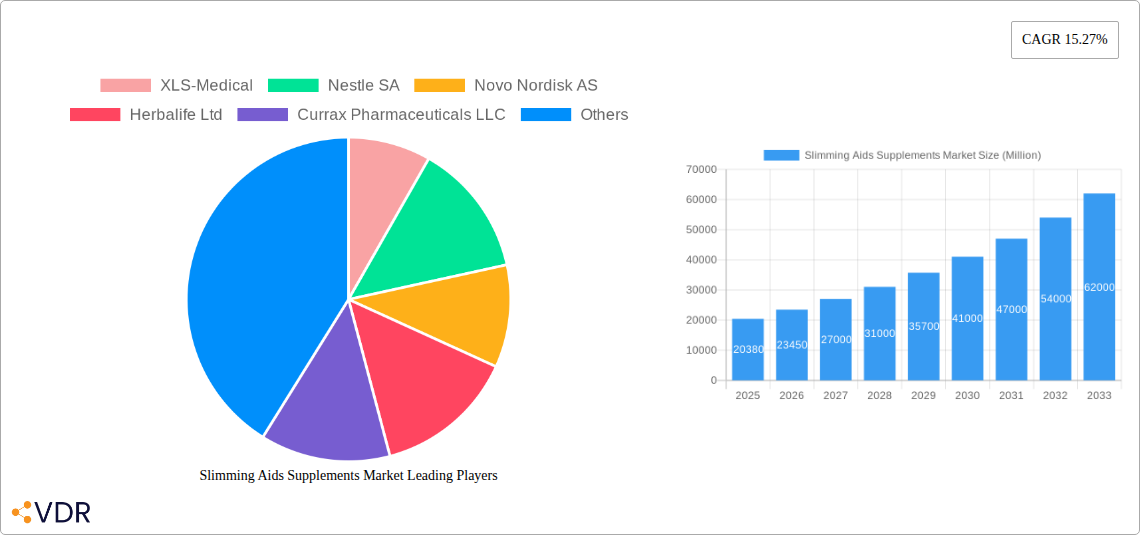
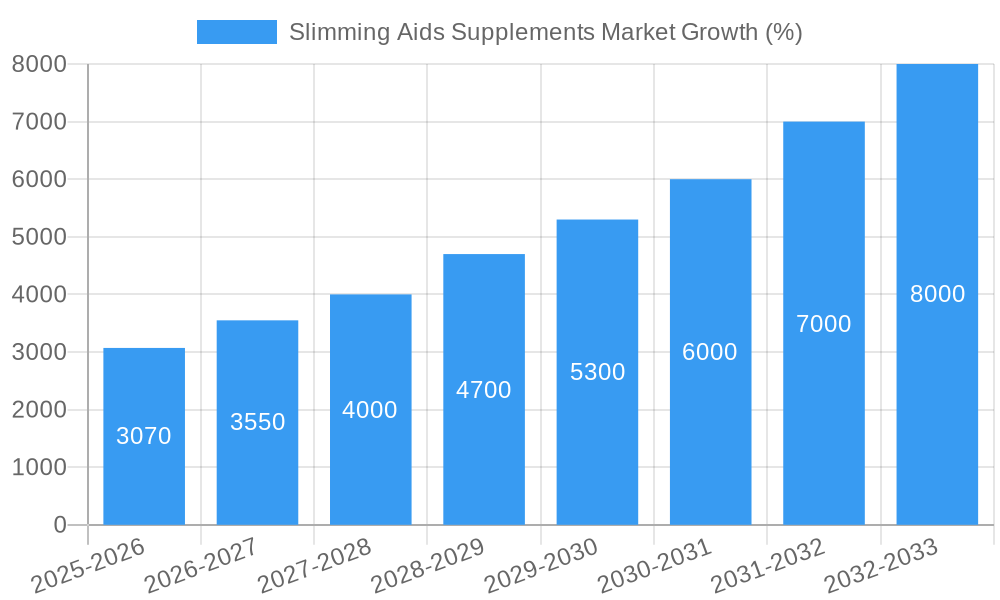
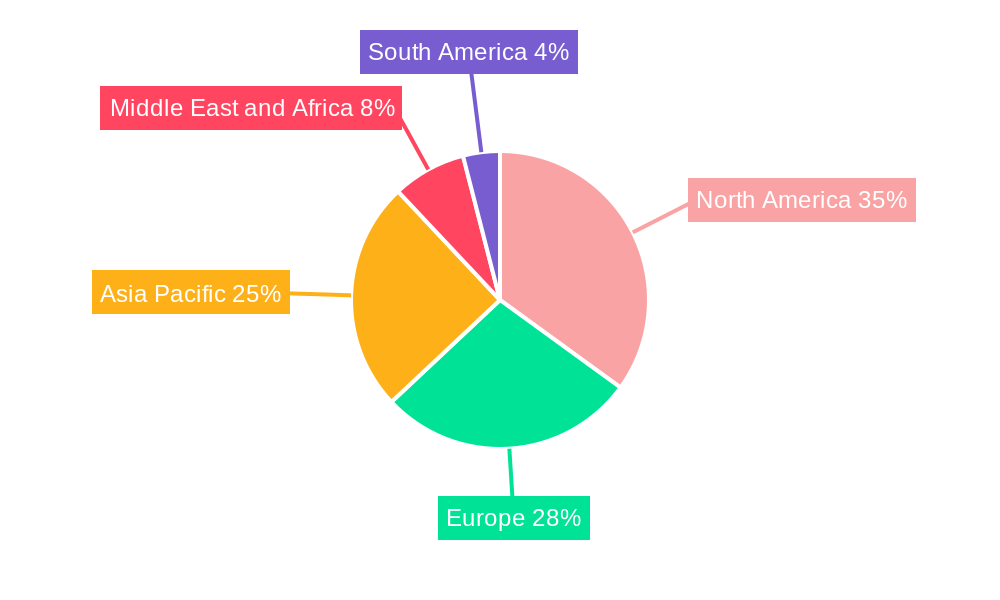
The global slimming aids supplements market, valued at $20.38 billion in 2025, is projected to experience robust growth, exhibiting a compound annual growth rate (CAGR) of 15.27% from 2025 to 2033. This expansion is fueled by several key drivers. Rising obesity rates worldwide, coupled with increasing health consciousness and a growing preference for non-invasive weight management solutions, significantly contribute to market demand. The diverse product portfolio, encompassing natural, synthetic, and semi-synthetic supplements available in various forms like tablets, capsules, powders, syrups, and injections, caters to diverse consumer preferences and needs. Furthermore, aggressive marketing strategies employed by major players like XLS-Medical, Nestle SA, and Herbalife, along with the rising popularity of online sales channels, contribute to market expansion. However, the market faces certain challenges, including concerns regarding the safety and efficacy of some supplements, stringent regulatory approvals, and potential side effects. Despite these restraints, the increasing prevalence of lifestyle diseases and the growing demand for convenient weight loss options are expected to propel the market's growth trajectory in the coming years. The Asia-Pacific region, particularly countries like China and India, is anticipated to be a significant growth driver due to its large population and increasing disposable incomes. The North American market, while mature, will also see continued growth driven by strong consumer demand and established distribution channels.
The segmentation of the slimming aids supplements market by product type (natural, synthetic, semi-synthetic) and mode of consumption (tablets & capsules, powder, syrups, injections) reflects the diverse needs and preferences of consumers. The natural segment is experiencing particularly strong growth due to the increasing consumer preference for natural and organic products. The dominant mode of consumption remains tablets and capsules due to their ease of use and portability. However, the powder and syrup segments are witnessing increasing popularity, driven by their perceived ease of incorporation into daily routines. Competitive dynamics are intense, with established players and emerging companies vying for market share through product innovation, strategic partnerships, and acquisitions. The market's future growth hinges on addressing consumer concerns about safety and efficacy, while also adapting to evolving regulatory landscapes and maintaining robust supply chains.
Slimming Aids Supplements Market: A Comprehensive Report (2019-2033)
This comprehensive report provides an in-depth analysis of the global Slimming Aids Supplements market, encompassing market dynamics, growth trends, regional dominance, product landscape, key players, and future outlook. The study period covers 2019-2033, with 2025 as the base year and a forecast period of 2025-2033. The report segments the market by Product Type (Natural, Synthetic, Semi-Synthetic) and Mode of Consumption (Tablets and Capsules, Powder, Syrups, Injection), providing granular insights into each segment's performance and growth potential. The parent market is the weight management market and the child market is slimming aid supplements.
Slimming Aids Supplements Market Market Dynamics & Structure
The Slimming Aids Supplements market is characterized by a moderately concentrated landscape, with key players such as Herbalife Ltd, Nestle SA, and Novo Nordisk AS holding significant market shares. Technological innovation, particularly in the development of novel formulations and delivery systems, is a key driver of growth. Stringent regulatory frameworks governing the safety and efficacy of supplements pose challenges, impacting market entry and product development. The market faces competition from alternative weight management solutions, including prescription medications and lifestyle interventions. End-user demographics are shifting towards a more health-conscious and wellness-focused population, driving demand for natural and effective slimming aids. Mergers and acquisitions (M&A) activity within the industry is moderate, with larger players strategically acquiring smaller companies to expand their product portfolios and market reach.
- Market Concentration: Moderately concentrated, with top 5 players holding approximately xx% market share in 2024.
- Technological Innovation: Focus on enhanced absorption rates, personalized formulations, and novel delivery systems.
- Regulatory Framework: Stringent regulations impacting product approvals and marketing claims.
- Competitive Substitutes: Prescription medications, lifestyle interventions (diet and exercise).
- End-User Demographics: Growing health consciousness and demand for natural solutions are driving market expansion.
- M&A Activity: Moderate activity, driven by strategic expansion and portfolio diversification. Estimated xx M&A deals in the last 5 years.
Slimming Aids Supplements Market Growth Trends & Insights
The global Slimming Aids Supplements market experienced significant growth during the historical period (2019-2024), driven by increasing awareness of obesity and related health issues. Market size expanded from xx million units in 2019 to xx million units in 2024, exhibiting a CAGR of xx%. Adoption rates are growing steadily, particularly in developed economies with high prevalence of obesity. Technological disruptions, such as the introduction of personalized nutrition plans and advanced ingredient formulations, are further accelerating market expansion. Consumer behavior is shifting towards a preference for natural and clinically proven supplements. This trend is expected to continue, with projected growth driven by increasing demand for effective and safe weight management solutions. The market is expected to reach xx million units by 2033, exhibiting a projected CAGR of xx% during the forecast period (2025-2033).
Dominant Regions, Countries, or Segments in Slimming Aids Supplements Market
North America currently dominates the Slimming Aids Supplements market, driven by high obesity prevalence, increased health awareness, and strong consumer spending on wellness products. Within product types, the Natural segment holds the largest market share, reflecting a growing consumer preference for naturally derived ingredients. Tablets and Capsules dominate the mode of consumption segment due to convenience and ease of use.
- Key Drivers in North America: High disposable incomes, robust healthcare infrastructure, and strong regulatory frameworks for supplements.
- Market Share: North America holds an estimated xx% market share in 2024.
- Growth Potential: Emerging markets in Asia-Pacific and Latin America present significant growth opportunities.
- Natural Segment Dominance: Driven by consumer preference for naturally derived ingredients and perceived health benefits.
- Tablets and Capsules: Preferred due to convenience and established market penetration.
Slimming Aids Supplements Market Product Landscape
The Slimming Aids Supplements market offers a diverse range of products, including natural extracts (e.g., green tea, garcinia cambogia), synthetic compounds (e.g., conjugated linoleic acid), and semi-synthetic formulations. Innovations focus on enhanced bioavailability, improved efficacy, and targeted weight management solutions. Unique selling propositions include clinically proven results, natural ingredients, and specialized formulations addressing specific needs. Technological advancements involve the development of advanced delivery systems (e.g., liposomal encapsulation) for better absorption and efficacy.
Key Drivers, Barriers & Challenges in Slimming Aids Supplements Market
Key Drivers:
- Rising prevalence of obesity and related health issues.
- Increasing health awareness and consumer interest in natural weight management solutions.
- Technological advancements in formulation and delivery systems.
- Growing demand for personalized nutrition plans.
Challenges and Restraints:
- Stringent regulatory requirements and varying regulations across different regions. This impacts product approvals and marketing claims, creating a significant barrier to market entry.
- Concerns about the safety and efficacy of certain ingredients, negatively affecting consumer trust and market growth. This is further exacerbated by inconsistent quality control and standardization issues.
- Competition from prescription medications and other weight loss solutions. The market is highly competitive, with existing players and new entrants constantly vying for market share.
- Supply chain disruptions, which impact availability and cost of raw materials.
Emerging Opportunities in Slimming Aids Supplements Market
- Expanding into untapped markets in emerging economies.
- Development of personalized and targeted weight management solutions using genomics and AI.
- Growing demand for functional foods and beverages incorporating slimming aids.
- Focus on innovative delivery systems and improved bioavailability.
Growth Accelerators in the Slimming Aids Supplements Market Industry
Long-term growth is expected to be driven by technological breakthroughs in personalized nutrition, strategic partnerships between supplement manufacturers and healthcare providers, and expansion into new geographical markets. The development of scientifically validated and effective slimming aid supplements will play a crucial role in maintaining market confidence and growth.
Key Players Shaping the Slimming Aids Supplements Market Market
- XLS-Medical
- Nestle SA
- Novo Nordisk AS
- Herbalife Ltd
- Currax Pharmaceuticals LLC
- Amway Corp
- Lovate Health Sciences
- ELI LILLY AND COMPANY
- Himalaya Wellness Company
- Isagenix Worldwide Inc
- Glanbia Plc
- Creative Bioscience
- Nutrawise Health & Beauty Corporation (Youtheory)
Notable Milestones in Slimming Aids Supplements Market Sector
- February 2024: Herbalife launched the Herbalife GLP-1 Nutrition Companion, expanding its product portfolio and targeting a specific market segment.
- February 2024: Lilly planned to launch its obesity drug tirzepatide in India as early as 2025, potentially impacting the competitive landscape.
In-Depth Slimming Aids Supplements Market Market Outlook
The Slimming Aids Supplements market is poised for continued growth, driven by the increasing prevalence of obesity, rising consumer awareness of health and wellness, and ongoing technological innovations. Strategic partnerships, product diversification, and expansion into new geographical markets will further accelerate market growth. The market presents significant opportunities for companies that can develop effective, safe, and consumer-friendly slimming aid supplements.
Slimming Aids Supplements Market Segmentation
-
1. Product Type
- 1.1. Natural
- 1.2. Synthetic
- 1.3. Semi Synthetic
-
2. Mode of Consumption
- 2.1. Tablets and Capsules
- 2.2. Powder
- 2.3. Syrups
- 2.4. Injection
Slimming Aids Supplements Market Segmentation By Geography
-
1. North America
- 1.1. United States
- 1.2. Canada
- 1.3. Mexico
-
2. Europe
- 2.1. Germany
- 2.2. United Kingdom
- 2.3. France
- 2.4. Italy
- 2.5. Spain
- 2.6. Rest of Europe
-
3. Asia Pacific
- 3.1. China
- 3.2. Japan
- 3.3. India
- 3.4. Australia
- 3.5. South Korea
- 3.6. Rest of Asia Pacific
-
4. Middle East and Africa
- 4.1. GCC
- 4.2. South Africa
- 4.3. Rest of Middle East and Africa
-
5. South America
- 5.1. Brazil
- 5.2. Argentina
- 5.3. Rest of South America
Slimming Aids Supplements Market REPORT HIGHLIGHTS
| Aspects | Details |
|---|---|
| Study Period | 2019-2033 |
| Base Year | 2024 |
| Estimated Year | 2025 |
| Forecast Period | 2025-2033 |
| Historical Period | 2019-2024 |
| Growth Rate | CAGR of 15.27% from 2019-2033 |
| Segmentation |
|
Table of Contents
- 1. Introduction
- 1.1. Research Scope
- 1.2. Market Segmentation
- 1.3. Research Methodology
- 1.4. Definitions and Assumptions
- 2. Executive Summary
- 2.1. Introduction
- 3. Market Dynamics
- 3.1. Introduction
- 3.2. Market Drivers
- 3.2.1. Increasing Rate of Obesity; Changing Lifestyle and Growing Fast Food Industry; Launch of New and Advanced Products
- 3.3. Market Restrains
- 3.3.1. Deceptive Marketing Practices; Presence of Counterfeit Products
- 3.4. Market Trends
- 3.4.1. The Natural Products Segment is Expected to Hold Significant Share in the Slimming Aids Market Over the Forecast Period
- 4. Market Factor Analysis
- 4.1. Porters Five Forces
- 4.2. Supply/Value Chain
- 4.3. PESTEL analysis
- 4.4. Market Entropy
- 4.5. Patent/Trademark Analysis
- 5. Global Slimming Aids Supplements Market Analysis, Insights and Forecast, 2019-2031
- 5.1. Market Analysis, Insights and Forecast - by Product Type
- 5.1.1. Natural
- 5.1.2. Synthetic
- 5.1.3. Semi Synthetic
- 5.2. Market Analysis, Insights and Forecast - by Mode of Consumption
- 5.2.1. Tablets and Capsules
- 5.2.2. Powder
- 5.2.3. Syrups
- 5.2.4. Injection
- 5.3. Market Analysis, Insights and Forecast - by Region
- 5.3.1. North America
- 5.3.2. Europe
- 5.3.3. Asia Pacific
- 5.3.4. Middle East and Africa
- 5.3.5. South America
- 5.1. Market Analysis, Insights and Forecast - by Product Type
- 6. North America Slimming Aids Supplements Market Analysis, Insights and Forecast, 2019-2031
- 6.1. Market Analysis, Insights and Forecast - by Product Type
- 6.1.1. Natural
- 6.1.2. Synthetic
- 6.1.3. Semi Synthetic
- 6.2. Market Analysis, Insights and Forecast - by Mode of Consumption
- 6.2.1. Tablets and Capsules
- 6.2.2. Powder
- 6.2.3. Syrups
- 6.2.4. Injection
- 6.1. Market Analysis, Insights and Forecast - by Product Type
- 7. Europe Slimming Aids Supplements Market Analysis, Insights and Forecast, 2019-2031
- 7.1. Market Analysis, Insights and Forecast - by Product Type
- 7.1.1. Natural
- 7.1.2. Synthetic
- 7.1.3. Semi Synthetic
- 7.2. Market Analysis, Insights and Forecast - by Mode of Consumption
- 7.2.1. Tablets and Capsules
- 7.2.2. Powder
- 7.2.3. Syrups
- 7.2.4. Injection
- 7.1. Market Analysis, Insights and Forecast - by Product Type
- 8. Asia Pacific Slimming Aids Supplements Market Analysis, Insights and Forecast, 2019-2031
- 8.1. Market Analysis, Insights and Forecast - by Product Type
- 8.1.1. Natural
- 8.1.2. Synthetic
- 8.1.3. Semi Synthetic
- 8.2. Market Analysis, Insights and Forecast - by Mode of Consumption
- 8.2.1. Tablets and Capsules
- 8.2.2. Powder
- 8.2.3. Syrups
- 8.2.4. Injection
- 8.1. Market Analysis, Insights and Forecast - by Product Type
- 9. Middle East and Africa Slimming Aids Supplements Market Analysis, Insights and Forecast, 2019-2031
- 9.1. Market Analysis, Insights and Forecast - by Product Type
- 9.1.1. Natural
- 9.1.2. Synthetic
- 9.1.3. Semi Synthetic
- 9.2. Market Analysis, Insights and Forecast - by Mode of Consumption
- 9.2.1. Tablets and Capsules
- 9.2.2. Powder
- 9.2.3. Syrups
- 9.2.4. Injection
- 9.1. Market Analysis, Insights and Forecast - by Product Type
- 10. South America Slimming Aids Supplements Market Analysis, Insights and Forecast, 2019-2031
- 10.1. Market Analysis, Insights and Forecast - by Product Type
- 10.1.1. Natural
- 10.1.2. Synthetic
- 10.1.3. Semi Synthetic
- 10.2. Market Analysis, Insights and Forecast - by Mode of Consumption
- 10.2.1. Tablets and Capsules
- 10.2.2. Powder
- 10.2.3. Syrups
- 10.2.4. Injection
- 10.1. Market Analysis, Insights and Forecast - by Product Type
- 11. North America Slimming Aids Supplements Market Analysis, Insights and Forecast, 2019-2031
- 11.1. Market Analysis, Insights and Forecast - By Country/Sub-region
- 11.1.1 United States
- 11.1.2 Canada
- 11.1.3 Mexico
- 12. Europe Slimming Aids Supplements Market Analysis, Insights and Forecast, 2019-2031
- 12.1. Market Analysis, Insights and Forecast - By Country/Sub-region
- 12.1.1 Germany
- 12.1.2 United Kingdom
- 12.1.3 France
- 12.1.4 Italy
- 12.1.5 Spain
- 12.1.6 Rest of Europe
- 13. Asia Pacific Slimming Aids Supplements Market Analysis, Insights and Forecast, 2019-2031
- 13.1. Market Analysis, Insights and Forecast - By Country/Sub-region
- 13.1.1 China
- 13.1.2 Japan
- 13.1.3 India
- 13.1.4 Australia
- 13.1.5 South Korea
- 13.1.6 Rest of Asia Pacific
- 14. Middle East and Africa Slimming Aids Supplements Market Analysis, Insights and Forecast, 2019-2031
- 14.1. Market Analysis, Insights and Forecast - By Country/Sub-region
- 14.1.1 GCC
- 14.1.2 South Africa
- 14.1.3 Rest of Middle East and Africa
- 15. South America Slimming Aids Supplements Market Analysis, Insights and Forecast, 2019-2031
- 15.1. Market Analysis, Insights and Forecast - By Country/Sub-region
- 15.1.1 Brazil
- 15.1.2 Argentina
- 15.1.3 Rest of South America
- 16. Competitive Analysis
- 16.1. Global Market Share Analysis 2024
- 16.2. Company Profiles
- 16.2.1 XLS-Medical
- 16.2.1.1. Overview
- 16.2.1.2. Products
- 16.2.1.3. SWOT Analysis
- 16.2.1.4. Recent Developments
- 16.2.1.5. Financials (Based on Availability)
- 16.2.2 Nestle SA
- 16.2.2.1. Overview
- 16.2.2.2. Products
- 16.2.2.3. SWOT Analysis
- 16.2.2.4. Recent Developments
- 16.2.2.5. Financials (Based on Availability)
- 16.2.3 Novo Nordisk AS
- 16.2.3.1. Overview
- 16.2.3.2. Products
- 16.2.3.3. SWOT Analysis
- 16.2.3.4. Recent Developments
- 16.2.3.5. Financials (Based on Availability)
- 16.2.4 Herbalife Ltd
- 16.2.4.1. Overview
- 16.2.4.2. Products
- 16.2.4.3. SWOT Analysis
- 16.2.4.4. Recent Developments
- 16.2.4.5. Financials (Based on Availability)
- 16.2.5 Currax Pharmaceuticals LLC
- 16.2.5.1. Overview
- 16.2.5.2. Products
- 16.2.5.3. SWOT Analysis
- 16.2.5.4. Recent Developments
- 16.2.5.5. Financials (Based on Availability)
- 16.2.6 Amway Corp
- 16.2.6.1. Overview
- 16.2.6.2. Products
- 16.2.6.3. SWOT Analysis
- 16.2.6.4. Recent Developments
- 16.2.6.5. Financials (Based on Availability)
- 16.2.7 Lovate Health Sciences
- 16.2.7.1. Overview
- 16.2.7.2. Products
- 16.2.7.3. SWOT Analysis
- 16.2.7.4. Recent Developments
- 16.2.7.5. Financials (Based on Availability)
- 16.2.8 ELI LILLY AND COMPANY
- 16.2.8.1. Overview
- 16.2.8.2. Products
- 16.2.8.3. SWOT Analysis
- 16.2.8.4. Recent Developments
- 16.2.8.5. Financials (Based on Availability)
- 16.2.9 Himalaya Wellness Company
- 16.2.9.1. Overview
- 16.2.9.2. Products
- 16.2.9.3. SWOT Analysis
- 16.2.9.4. Recent Developments
- 16.2.9.5. Financials (Based on Availability)
- 16.2.10 Isagenix Worldwide Inc
- 16.2.10.1. Overview
- 16.2.10.2. Products
- 16.2.10.3. SWOT Analysis
- 16.2.10.4. Recent Developments
- 16.2.10.5. Financials (Based on Availability)
- 16.2.11 Glanbia Plc
- 16.2.11.1. Overview
- 16.2.11.2. Products
- 16.2.11.3. SWOT Analysis
- 16.2.11.4. Recent Developments
- 16.2.11.5. Financials (Based on Availability)
- 16.2.12 Creative Bioscience
- 16.2.12.1. Overview
- 16.2.12.2. Products
- 16.2.12.3. SWOT Analysis
- 16.2.12.4. Recent Developments
- 16.2.12.5. Financials (Based on Availability)
- 16.2.13 Nutrawise Health & Beauty Corporation (Youtheory)
- 16.2.13.1. Overview
- 16.2.13.2. Products
- 16.2.13.3. SWOT Analysis
- 16.2.13.4. Recent Developments
- 16.2.13.5. Financials (Based on Availability)
- 16.2.1 XLS-Medical
List of Figures
- Figure 1: Global Slimming Aids Supplements Market Revenue Breakdown (Million, %) by Region 2024 & 2032
- Figure 2: Global Slimming Aids Supplements Market Volume Breakdown (K Unit, %) by Region 2024 & 2032
- Figure 3: North America Slimming Aids Supplements Market Revenue (Million), by Country 2024 & 2032
- Figure 4: North America Slimming Aids Supplements Market Volume (K Unit), by Country 2024 & 2032
- Figure 5: North America Slimming Aids Supplements Market Revenue Share (%), by Country 2024 & 2032
- Figure 6: North America Slimming Aids Supplements Market Volume Share (%), by Country 2024 & 2032
- Figure 7: Europe Slimming Aids Supplements Market Revenue (Million), by Country 2024 & 2032
- Figure 8: Europe Slimming Aids Supplements Market Volume (K Unit), by Country 2024 & 2032
- Figure 9: Europe Slimming Aids Supplements Market Revenue Share (%), by Country 2024 & 2032
- Figure 10: Europe Slimming Aids Supplements Market Volume Share (%), by Country 2024 & 2032
- Figure 11: Asia Pacific Slimming Aids Supplements Market Revenue (Million), by Country 2024 & 2032
- Figure 12: Asia Pacific Slimming Aids Supplements Market Volume (K Unit), by Country 2024 & 2032
- Figure 13: Asia Pacific Slimming Aids Supplements Market Revenue Share (%), by Country 2024 & 2032
- Figure 14: Asia Pacific Slimming Aids Supplements Market Volume Share (%), by Country 2024 & 2032
- Figure 15: Middle East and Africa Slimming Aids Supplements Market Revenue (Million), by Country 2024 & 2032
- Figure 16: Middle East and Africa Slimming Aids Supplements Market Volume (K Unit), by Country 2024 & 2032
- Figure 17: Middle East and Africa Slimming Aids Supplements Market Revenue Share (%), by Country 2024 & 2032
- Figure 18: Middle East and Africa Slimming Aids Supplements Market Volume Share (%), by Country 2024 & 2032
- Figure 19: South America Slimming Aids Supplements Market Revenue (Million), by Country 2024 & 2032
- Figure 20: South America Slimming Aids Supplements Market Volume (K Unit), by Country 2024 & 2032
- Figure 21: South America Slimming Aids Supplements Market Revenue Share (%), by Country 2024 & 2032
- Figure 22: South America Slimming Aids Supplements Market Volume Share (%), by Country 2024 & 2032
- Figure 23: North America Slimming Aids Supplements Market Revenue (Million), by Product Type 2024 & 2032
- Figure 24: North America Slimming Aids Supplements Market Volume (K Unit), by Product Type 2024 & 2032
- Figure 25: North America Slimming Aids Supplements Market Revenue Share (%), by Product Type 2024 & 2032
- Figure 26: North America Slimming Aids Supplements Market Volume Share (%), by Product Type 2024 & 2032
- Figure 27: North America Slimming Aids Supplements Market Revenue (Million), by Mode of Consumption 2024 & 2032
- Figure 28: North America Slimming Aids Supplements Market Volume (K Unit), by Mode of Consumption 2024 & 2032
- Figure 29: North America Slimming Aids Supplements Market Revenue Share (%), by Mode of Consumption 2024 & 2032
- Figure 30: North America Slimming Aids Supplements Market Volume Share (%), by Mode of Consumption 2024 & 2032
- Figure 31: North America Slimming Aids Supplements Market Revenue (Million), by Country 2024 & 2032
- Figure 32: North America Slimming Aids Supplements Market Volume (K Unit), by Country 2024 & 2032
- Figure 33: North America Slimming Aids Supplements Market Revenue Share (%), by Country 2024 & 2032
- Figure 34: North America Slimming Aids Supplements Market Volume Share (%), by Country 2024 & 2032
- Figure 35: Europe Slimming Aids Supplements Market Revenue (Million), by Product Type 2024 & 2032
- Figure 36: Europe Slimming Aids Supplements Market Volume (K Unit), by Product Type 2024 & 2032
- Figure 37: Europe Slimming Aids Supplements Market Revenue Share (%), by Product Type 2024 & 2032
- Figure 38: Europe Slimming Aids Supplements Market Volume Share (%), by Product Type 2024 & 2032
- Figure 39: Europe Slimming Aids Supplements Market Revenue (Million), by Mode of Consumption 2024 & 2032
- Figure 40: Europe Slimming Aids Supplements Market Volume (K Unit), by Mode of Consumption 2024 & 2032
- Figure 41: Europe Slimming Aids Supplements Market Revenue Share (%), by Mode of Consumption 2024 & 2032
- Figure 42: Europe Slimming Aids Supplements Market Volume Share (%), by Mode of Consumption 2024 & 2032
- Figure 43: Europe Slimming Aids Supplements Market Revenue (Million), by Country 2024 & 2032
- Figure 44: Europe Slimming Aids Supplements Market Volume (K Unit), by Country 2024 & 2032
- Figure 45: Europe Slimming Aids Supplements Market Revenue Share (%), by Country 2024 & 2032
- Figure 46: Europe Slimming Aids Supplements Market Volume Share (%), by Country 2024 & 2032
- Figure 47: Asia Pacific Slimming Aids Supplements Market Revenue (Million), by Product Type 2024 & 2032
- Figure 48: Asia Pacific Slimming Aids Supplements Market Volume (K Unit), by Product Type 2024 & 2032
- Figure 49: Asia Pacific Slimming Aids Supplements Market Revenue Share (%), by Product Type 2024 & 2032
- Figure 50: Asia Pacific Slimming Aids Supplements Market Volume Share (%), by Product Type 2024 & 2032
- Figure 51: Asia Pacific Slimming Aids Supplements Market Revenue (Million), by Mode of Consumption 2024 & 2032
- Figure 52: Asia Pacific Slimming Aids Supplements Market Volume (K Unit), by Mode of Consumption 2024 & 2032
- Figure 53: Asia Pacific Slimming Aids Supplements Market Revenue Share (%), by Mode of Consumption 2024 & 2032
- Figure 54: Asia Pacific Slimming Aids Supplements Market Volume Share (%), by Mode of Consumption 2024 & 2032
- Figure 55: Asia Pacific Slimming Aids Supplements Market Revenue (Million), by Country 2024 & 2032
- Figure 56: Asia Pacific Slimming Aids Supplements Market Volume (K Unit), by Country 2024 & 2032
- Figure 57: Asia Pacific Slimming Aids Supplements Market Revenue Share (%), by Country 2024 & 2032
- Figure 58: Asia Pacific Slimming Aids Supplements Market Volume Share (%), by Country 2024 & 2032
- Figure 59: Middle East and Africa Slimming Aids Supplements Market Revenue (Million), by Product Type 2024 & 2032
- Figure 60: Middle East and Africa Slimming Aids Supplements Market Volume (K Unit), by Product Type 2024 & 2032
- Figure 61: Middle East and Africa Slimming Aids Supplements Market Revenue Share (%), by Product Type 2024 & 2032
- Figure 62: Middle East and Africa Slimming Aids Supplements Market Volume Share (%), by Product Type 2024 & 2032
- Figure 63: Middle East and Africa Slimming Aids Supplements Market Revenue (Million), by Mode of Consumption 2024 & 2032
- Figure 64: Middle East and Africa Slimming Aids Supplements Market Volume (K Unit), by Mode of Consumption 2024 & 2032
- Figure 65: Middle East and Africa Slimming Aids Supplements Market Revenue Share (%), by Mode of Consumption 2024 & 2032
- Figure 66: Middle East and Africa Slimming Aids Supplements Market Volume Share (%), by Mode of Consumption 2024 & 2032
- Figure 67: Middle East and Africa Slimming Aids Supplements Market Revenue (Million), by Country 2024 & 2032
- Figure 68: Middle East and Africa Slimming Aids Supplements Market Volume (K Unit), by Country 2024 & 2032
- Figure 69: Middle East and Africa Slimming Aids Supplements Market Revenue Share (%), by Country 2024 & 2032
- Figure 70: Middle East and Africa Slimming Aids Supplements Market Volume Share (%), by Country 2024 & 2032
- Figure 71: South America Slimming Aids Supplements Market Revenue (Million), by Product Type 2024 & 2032
- Figure 72: South America Slimming Aids Supplements Market Volume (K Unit), by Product Type 2024 & 2032
- Figure 73: South America Slimming Aids Supplements Market Revenue Share (%), by Product Type 2024 & 2032
- Figure 74: South America Slimming Aids Supplements Market Volume Share (%), by Product Type 2024 & 2032
- Figure 75: South America Slimming Aids Supplements Market Revenue (Million), by Mode of Consumption 2024 & 2032
- Figure 76: South America Slimming Aids Supplements Market Volume (K Unit), by Mode of Consumption 2024 & 2032
- Figure 77: South America Slimming Aids Supplements Market Revenue Share (%), by Mode of Consumption 2024 & 2032
- Figure 78: South America Slimming Aids Supplements Market Volume Share (%), by Mode of Consumption 2024 & 2032
- Figure 79: South America Slimming Aids Supplements Market Revenue (Million), by Country 2024 & 2032
- Figure 80: South America Slimming Aids Supplements Market Volume (K Unit), by Country 2024 & 2032
- Figure 81: South America Slimming Aids Supplements Market Revenue Share (%), by Country 2024 & 2032
- Figure 82: South America Slimming Aids Supplements Market Volume Share (%), by Country 2024 & 2032
List of Tables
- Table 1: Global Slimming Aids Supplements Market Revenue Million Forecast, by Region 2019 & 2032
- Table 2: Global Slimming Aids Supplements Market Volume K Unit Forecast, by Region 2019 & 2032
- Table 3: Global Slimming Aids Supplements Market Revenue Million Forecast, by Product Type 2019 & 2032
- Table 4: Global Slimming Aids Supplements Market Volume K Unit Forecast, by Product Type 2019 & 2032
- Table 5: Global Slimming Aids Supplements Market Revenue Million Forecast, by Mode of Consumption 2019 & 2032
- Table 6: Global Slimming Aids Supplements Market Volume K Unit Forecast, by Mode of Consumption 2019 & 2032
- Table 7: Global Slimming Aids Supplements Market Revenue Million Forecast, by Region 2019 & 2032
- Table 8: Global Slimming Aids Supplements Market Volume K Unit Forecast, by Region 2019 & 2032
- Table 9: Global Slimming Aids Supplements Market Revenue Million Forecast, by Country 2019 & 2032
- Table 10: Global Slimming Aids Supplements Market Volume K Unit Forecast, by Country 2019 & 2032
- Table 11: United States Slimming Aids Supplements Market Revenue (Million) Forecast, by Application 2019 & 2032
- Table 12: United States Slimming Aids Supplements Market Volume (K Unit) Forecast, by Application 2019 & 2032
- Table 13: Canada Slimming Aids Supplements Market Revenue (Million) Forecast, by Application 2019 & 2032
- Table 14: Canada Slimming Aids Supplements Market Volume (K Unit) Forecast, by Application 2019 & 2032
- Table 15: Mexico Slimming Aids Supplements Market Revenue (Million) Forecast, by Application 2019 & 2032
- Table 16: Mexico Slimming Aids Supplements Market Volume (K Unit) Forecast, by Application 2019 & 2032
- Table 17: Global Slimming Aids Supplements Market Revenue Million Forecast, by Country 2019 & 2032
- Table 18: Global Slimming Aids Supplements Market Volume K Unit Forecast, by Country 2019 & 2032
- Table 19: Germany Slimming Aids Supplements Market Revenue (Million) Forecast, by Application 2019 & 2032
- Table 20: Germany Slimming Aids Supplements Market Volume (K Unit) Forecast, by Application 2019 & 2032
- Table 21: United Kingdom Slimming Aids Supplements Market Revenue (Million) Forecast, by Application 2019 & 2032
- Table 22: United Kingdom Slimming Aids Supplements Market Volume (K Unit) Forecast, by Application 2019 & 2032
- Table 23: France Slimming Aids Supplements Market Revenue (Million) Forecast, by Application 2019 & 2032
- Table 24: France Slimming Aids Supplements Market Volume (K Unit) Forecast, by Application 2019 & 2032
- Table 25: Italy Slimming Aids Supplements Market Revenue (Million) Forecast, by Application 2019 & 2032
- Table 26: Italy Slimming Aids Supplements Market Volume (K Unit) Forecast, by Application 2019 & 2032
- Table 27: Spain Slimming Aids Supplements Market Revenue (Million) Forecast, by Application 2019 & 2032
- Table 28: Spain Slimming Aids Supplements Market Volume (K Unit) Forecast, by Application 2019 & 2032
- Table 29: Rest of Europe Slimming Aids Supplements Market Revenue (Million) Forecast, by Application 2019 & 2032
- Table 30: Rest of Europe Slimming Aids Supplements Market Volume (K Unit) Forecast, by Application 2019 & 2032
- Table 31: Global Slimming Aids Supplements Market Revenue Million Forecast, by Country 2019 & 2032
- Table 32: Global Slimming Aids Supplements Market Volume K Unit Forecast, by Country 2019 & 2032
- Table 33: China Slimming Aids Supplements Market Revenue (Million) Forecast, by Application 2019 & 2032
- Table 34: China Slimming Aids Supplements Market Volume (K Unit) Forecast, by Application 2019 & 2032
- Table 35: Japan Slimming Aids Supplements Market Revenue (Million) Forecast, by Application 2019 & 2032
- Table 36: Japan Slimming Aids Supplements Market Volume (K Unit) Forecast, by Application 2019 & 2032
- Table 37: India Slimming Aids Supplements Market Revenue (Million) Forecast, by Application 2019 & 2032
- Table 38: India Slimming Aids Supplements Market Volume (K Unit) Forecast, by Application 2019 & 2032
- Table 39: Australia Slimming Aids Supplements Market Revenue (Million) Forecast, by Application 2019 & 2032
- Table 40: Australia Slimming Aids Supplements Market Volume (K Unit) Forecast, by Application 2019 & 2032
- Table 41: South Korea Slimming Aids Supplements Market Revenue (Million) Forecast, by Application 2019 & 2032
- Table 42: South Korea Slimming Aids Supplements Market Volume (K Unit) Forecast, by Application 2019 & 2032
- Table 43: Rest of Asia Pacific Slimming Aids Supplements Market Revenue (Million) Forecast, by Application 2019 & 2032
- Table 44: Rest of Asia Pacific Slimming Aids Supplements Market Volume (K Unit) Forecast, by Application 2019 & 2032
- Table 45: Global Slimming Aids Supplements Market Revenue Million Forecast, by Country 2019 & 2032
- Table 46: Global Slimming Aids Supplements Market Volume K Unit Forecast, by Country 2019 & 2032
- Table 47: GCC Slimming Aids Supplements Market Revenue (Million) Forecast, by Application 2019 & 2032
- Table 48: GCC Slimming Aids Supplements Market Volume (K Unit) Forecast, by Application 2019 & 2032
- Table 49: South Africa Slimming Aids Supplements Market Revenue (Million) Forecast, by Application 2019 & 2032
- Table 50: South Africa Slimming Aids Supplements Market Volume (K Unit) Forecast, by Application 2019 & 2032
- Table 51: Rest of Middle East and Africa Slimming Aids Supplements Market Revenue (Million) Forecast, by Application 2019 & 2032
- Table 52: Rest of Middle East and Africa Slimming Aids Supplements Market Volume (K Unit) Forecast, by Application 2019 & 2032
- Table 53: Global Slimming Aids Supplements Market Revenue Million Forecast, by Country 2019 & 2032
- Table 54: Global Slimming Aids Supplements Market Volume K Unit Forecast, by Country 2019 & 2032
- Table 55: Brazil Slimming Aids Supplements Market Revenue (Million) Forecast, by Application 2019 & 2032
- Table 56: Brazil Slimming Aids Supplements Market Volume (K Unit) Forecast, by Application 2019 & 2032
- Table 57: Argentina Slimming Aids Supplements Market Revenue (Million) Forecast, by Application 2019 & 2032
- Table 58: Argentina Slimming Aids Supplements Market Volume (K Unit) Forecast, by Application 2019 & 2032
- Table 59: Rest of South America Slimming Aids Supplements Market Revenue (Million) Forecast, by Application 2019 & 2032
- Table 60: Rest of South America Slimming Aids Supplements Market Volume (K Unit) Forecast, by Application 2019 & 2032
- Table 61: Global Slimming Aids Supplements Market Revenue Million Forecast, by Product Type 2019 & 2032
- Table 62: Global Slimming Aids Supplements Market Volume K Unit Forecast, by Product Type 2019 & 2032
- Table 63: Global Slimming Aids Supplements Market Revenue Million Forecast, by Mode of Consumption 2019 & 2032
- Table 64: Global Slimming Aids Supplements Market Volume K Unit Forecast, by Mode of Consumption 2019 & 2032
- Table 65: Global Slimming Aids Supplements Market Revenue Million Forecast, by Country 2019 & 2032
- Table 66: Global Slimming Aids Supplements Market Volume K Unit Forecast, by Country 2019 & 2032
- Table 67: United States Slimming Aids Supplements Market Revenue (Million) Forecast, by Application 2019 & 2032
- Table 68: United States Slimming Aids Supplements Market Volume (K Unit) Forecast, by Application 2019 & 2032
- Table 69: Canada Slimming Aids Supplements Market Revenue (Million) Forecast, by Application 2019 & 2032
- Table 70: Canada Slimming Aids Supplements Market Volume (K Unit) Forecast, by Application 2019 & 2032
- Table 71: Mexico Slimming Aids Supplements Market Revenue (Million) Forecast, by Application 2019 & 2032
- Table 72: Mexico Slimming Aids Supplements Market Volume (K Unit) Forecast, by Application 2019 & 2032
- Table 73: Global Slimming Aids Supplements Market Revenue Million Forecast, by Product Type 2019 & 2032
- Table 74: Global Slimming Aids Supplements Market Volume K Unit Forecast, by Product Type 2019 & 2032
- Table 75: Global Slimming Aids Supplements Market Revenue Million Forecast, by Mode of Consumption 2019 & 2032
- Table 76: Global Slimming Aids Supplements Market Volume K Unit Forecast, by Mode of Consumption 2019 & 2032
- Table 77: Global Slimming Aids Supplements Market Revenue Million Forecast, by Country 2019 & 2032
- Table 78: Global Slimming Aids Supplements Market Volume K Unit Forecast, by Country 2019 & 2032
- Table 79: Germany Slimming Aids Supplements Market Revenue (Million) Forecast, by Application 2019 & 2032
- Table 80: Germany Slimming Aids Supplements Market Volume (K Unit) Forecast, by Application 2019 & 2032
- Table 81: United Kingdom Slimming Aids Supplements Market Revenue (Million) Forecast, by Application 2019 & 2032
- Table 82: United Kingdom Slimming Aids Supplements Market Volume (K Unit) Forecast, by Application 2019 & 2032
- Table 83: France Slimming Aids Supplements Market Revenue (Million) Forecast, by Application 2019 & 2032
- Table 84: France Slimming Aids Supplements Market Volume (K Unit) Forecast, by Application 2019 & 2032
- Table 85: Italy Slimming Aids Supplements Market Revenue (Million) Forecast, by Application 2019 & 2032
- Table 86: Italy Slimming Aids Supplements Market Volume (K Unit) Forecast, by Application 2019 & 2032
- Table 87: Spain Slimming Aids Supplements Market Revenue (Million) Forecast, by Application 2019 & 2032
- Table 88: Spain Slimming Aids Supplements Market Volume (K Unit) Forecast, by Application 2019 & 2032
- Table 89: Rest of Europe Slimming Aids Supplements Market Revenue (Million) Forecast, by Application 2019 & 2032
- Table 90: Rest of Europe Slimming Aids Supplements Market Volume (K Unit) Forecast, by Application 2019 & 2032
- Table 91: Global Slimming Aids Supplements Market Revenue Million Forecast, by Product Type 2019 & 2032
- Table 92: Global Slimming Aids Supplements Market Volume K Unit Forecast, by Product Type 2019 & 2032
- Table 93: Global Slimming Aids Supplements Market Revenue Million Forecast, by Mode of Consumption 2019 & 2032
- Table 94: Global Slimming Aids Supplements Market Volume K Unit Forecast, by Mode of Consumption 2019 & 2032
- Table 95: Global Slimming Aids Supplements Market Revenue Million Forecast, by Country 2019 & 2032
- Table 96: Global Slimming Aids Supplements Market Volume K Unit Forecast, by Country 2019 & 2032
- Table 97: China Slimming Aids Supplements Market Revenue (Million) Forecast, by Application 2019 & 2032
- Table 98: China Slimming Aids Supplements Market Volume (K Unit) Forecast, by Application 2019 & 2032
- Table 99: Japan Slimming Aids Supplements Market Revenue (Million) Forecast, by Application 2019 & 2032
- Table 100: Japan Slimming Aids Supplements Market Volume (K Unit) Forecast, by Application 2019 & 2032
- Table 101: India Slimming Aids Supplements Market Revenue (Million) Forecast, by Application 2019 & 2032
- Table 102: India Slimming Aids Supplements Market Volume (K Unit) Forecast, by Application 2019 & 2032
- Table 103: Australia Slimming Aids Supplements Market Revenue (Million) Forecast, by Application 2019 & 2032
- Table 104: Australia Slimming Aids Supplements Market Volume (K Unit) Forecast, by Application 2019 & 2032
- Table 105: South Korea Slimming Aids Supplements Market Revenue (Million) Forecast, by Application 2019 & 2032
- Table 106: South Korea Slimming Aids Supplements Market Volume (K Unit) Forecast, by Application 2019 & 2032
- Table 107: Rest of Asia Pacific Slimming Aids Supplements Market Revenue (Million) Forecast, by Application 2019 & 2032
- Table 108: Rest of Asia Pacific Slimming Aids Supplements Market Volume (K Unit) Forecast, by Application 2019 & 2032
- Table 109: Global Slimming Aids Supplements Market Revenue Million Forecast, by Product Type 2019 & 2032
- Table 110: Global Slimming Aids Supplements Market Volume K Unit Forecast, by Product Type 2019 & 2032
- Table 111: Global Slimming Aids Supplements Market Revenue Million Forecast, by Mode of Consumption 2019 & 2032
- Table 112: Global Slimming Aids Supplements Market Volume K Unit Forecast, by Mode of Consumption 2019 & 2032
- Table 113: Global Slimming Aids Supplements Market Revenue Million Forecast, by Country 2019 & 2032
- Table 114: Global Slimming Aids Supplements Market Volume K Unit Forecast, by Country 2019 & 2032
- Table 115: GCC Slimming Aids Supplements Market Revenue (Million) Forecast, by Application 2019 & 2032
- Table 116: GCC Slimming Aids Supplements Market Volume (K Unit) Forecast, by Application 2019 & 2032
- Table 117: South Africa Slimming Aids Supplements Market Revenue (Million) Forecast, by Application 2019 & 2032
- Table 118: South Africa Slimming Aids Supplements Market Volume (K Unit) Forecast, by Application 2019 & 2032
- Table 119: Rest of Middle East and Africa Slimming Aids Supplements Market Revenue (Million) Forecast, by Application 2019 & 2032
- Table 120: Rest of Middle East and Africa Slimming Aids Supplements Market Volume (K Unit) Forecast, by Application 2019 & 2032
- Table 121: Global Slimming Aids Supplements Market Revenue Million Forecast, by Product Type 2019 & 2032
- Table 122: Global Slimming Aids Supplements Market Volume K Unit Forecast, by Product Type 2019 & 2032
- Table 123: Global Slimming Aids Supplements Market Revenue Million Forecast, by Mode of Consumption 2019 & 2032
- Table 124: Global Slimming Aids Supplements Market Volume K Unit Forecast, by Mode of Consumption 2019 & 2032
- Table 125: Global Slimming Aids Supplements Market Revenue Million Forecast, by Country 2019 & 2032
- Table 126: Global Slimming Aids Supplements Market Volume K Unit Forecast, by Country 2019 & 2032
- Table 127: Brazil Slimming Aids Supplements Market Revenue (Million) Forecast, by Application 2019 & 2032
- Table 128: Brazil Slimming Aids Supplements Market Volume (K Unit) Forecast, by Application 2019 & 2032
- Table 129: Argentina Slimming Aids Supplements Market Revenue (Million) Forecast, by Application 2019 & 2032
- Table 130: Argentina Slimming Aids Supplements Market Volume (K Unit) Forecast, by Application 2019 & 2032
- Table 131: Rest of South America Slimming Aids Supplements Market Revenue (Million) Forecast, by Application 2019 & 2032
- Table 132: Rest of South America Slimming Aids Supplements Market Volume (K Unit) Forecast, by Application 2019 & 2032
Frequently Asked Questions
1. What is the projected Compound Annual Growth Rate (CAGR) of the Slimming Aids Supplements Market?
The projected CAGR is approximately 15.27%.
2. Which companies are prominent players in the Slimming Aids Supplements Market?
Key companies in the market include XLS-Medical, Nestle SA, Novo Nordisk AS, Herbalife Ltd, Currax Pharmaceuticals LLC, Amway Corp, Lovate Health Sciences, ELI LILLY AND COMPANY, Himalaya Wellness Company, Isagenix Worldwide Inc, Glanbia Plc, Creative Bioscience, Nutrawise Health & Beauty Corporation (Youtheory).
3. What are the main segments of the Slimming Aids Supplements Market?
The market segments include Product Type, Mode of Consumption.
4. Can you provide details about the market size?
The market size is estimated to be USD 20.38 Million as of 2022.
5. What are some drivers contributing to market growth?
Increasing Rate of Obesity; Changing Lifestyle and Growing Fast Food Industry; Launch of New and Advanced Products.
6. What are the notable trends driving market growth?
The Natural Products Segment is Expected to Hold Significant Share in the Slimming Aids Market Over the Forecast Period.
7. Are there any restraints impacting market growth?
Deceptive Marketing Practices; Presence of Counterfeit Products.
8. Can you provide examples of recent developments in the market?
February 2024: Herbalife launched the Herbalife GLP-1 Nutrition Companion, a new range of food and supplement product combos intended to support the nutritional needs of individuals on GLP-1 and other weight-loss medications.
9. What pricing options are available for accessing the report?
Pricing options include single-user, multi-user, and enterprise licenses priced at USD 4750, USD 5250, and USD 8750 respectively.
10. Is the market size provided in terms of value or volume?
The market size is provided in terms of value, measured in Million and volume, measured in K Unit.
11. Are there any specific market keywords associated with the report?
Yes, the market keyword associated with the report is "Slimming Aids Supplements Market," which aids in identifying and referencing the specific market segment covered.
12. How do I determine which pricing option suits my needs best?
The pricing options vary based on user requirements and access needs. Individual users may opt for single-user licenses, while businesses requiring broader access may choose multi-user or enterprise licenses for cost-effective access to the report.
13. Are there any additional resources or data provided in the Slimming Aids Supplements Market report?
While the report offers comprehensive insights, it's advisable to review the specific contents or supplementary materials provided to ascertain if additional resources or data are available.
14. How can I stay updated on further developments or reports in the Slimming Aids Supplements Market?
To stay informed about further developments, trends, and reports in the Slimming Aids Supplements Market, consider subscribing to industry newsletters, following relevant companies and organizations, or regularly checking reputable industry news sources and publications.
Methodology
Step 1 - Identification of Relevant Samples Size from Population Database


Step 2 - Approaches for Defining Global Market Size (Value, Volume* & Price*)

Note*: In applicable scenarios
Step 3 - Data Sources
Primary Research
- Web Analytics
- Survey Reports
- Research Institute
- Latest Research Reports
- Opinion Leaders
Secondary Research
- Annual Reports
- White Paper
- Latest Press Release
- Industry Association
- Paid Database
- Investor Presentations

Step 4 - Data Triangulation
Involves using different sources of information in order to increase the validity of a study
These sources are likely to be stakeholders in a program - participants, other researchers, program staff, other community members, and so on.
Then we put all data in single framework & apply various statistical tools to find out the dynamic on the market.
During the analysis stage, feedback from the stakeholder groups would be compared to determine areas of agreement as well as areas of divergence


