
Key Insights
The global sleep technology market is experiencing robust growth, projected to reach a significant size by 2033, driven by a confluence of factors. Rising awareness of sleep disorders like insomnia and sleep apnea, coupled with the increasing prevalence of chronic health conditions exacerbated by poor sleep, are key drivers. Technological advancements in wearables, such as smartwatches and sleep trackers offering personalized sleep data and insights, are fueling market expansion. Furthermore, the integration of sleep technology with other health and wellness applications, along with the increasing acceptance of telehealth and remote patient monitoring, are contributing to market growth. The market is segmented by product type (wearables, non-wearables like sleep masks and pillows, and other emerging technologies) and end-user (hospitals, homecare settings, and others). Wearables currently hold a substantial market share, however, non-wearable solutions are showing rapid growth, driven by consumer preference for comfort and ease of use.
The market's geographical distribution reflects varying levels of technological adoption and healthcare infrastructure development. North America, particularly the United States, currently holds a significant market share due to higher per capita spending on healthcare and a strong focus on wellness. However, the Asia-Pacific region is predicted to witness substantial growth, fueled by expanding populations, rising disposable incomes, and increasing awareness of sleep health. Europe also represents a sizeable market, with diverse offerings catering to various consumer preferences and healthcare needs. While the market faces restraints such as high initial costs of some technologies and concerns about data privacy and security, the overall positive trends suggest sustained expansion. The competitive landscape includes established players like Philips and emerging innovative companies, leading to continuous advancements and increased market diversification. The forecast period will likely see a continued rise in personalized sleep solutions and further integration with broader healthcare ecosystems.
Sleep Tech Industry Market Report: 2019-2033
This comprehensive report provides an in-depth analysis of the Sleep Tech industry, encompassing market dynamics, growth trends, key players, and future outlook. The study period covers 2019-2033, with a base year of 2025 and a forecast period of 2025-2033. This report is invaluable for industry professionals, investors, and anyone seeking to understand the evolving landscape of sleep technology. The report segments the market by product (wearables, non-wearables, others) and end-user (hospitals, homecare settings, others).
Sleep Tech Industry Market Dynamics & Structure
The global sleep tech market, valued at XX million units in 2024, is characterized by moderate concentration with several key players vying for market share. Technological innovation, particularly in AI-powered sleep analysis and personalized sleep solutions, is a major driver. Regulatory frameworks concerning data privacy and medical device approvals significantly influence market growth. Competitive substitutes include traditional sleep aids and therapies. The end-user demographic is expanding, driven by increased awareness of sleep health and the rising prevalence of sleep disorders. M&A activity has been moderate, with a total of XX deals in the last five years.
- Market Concentration: Moderately concentrated, with top 5 players holding approximately XX% market share.
- Technological Innovation: AI-driven sleep analysis, personalized sleep solutions, and advanced sensor technologies.
- Regulatory Landscape: Stringent regulations for medical devices impact market entry and product development.
- Competitive Substitutes: Traditional sleep aids, cognitive behavioral therapy for insomnia (CBT-I).
- End-User Demographics: Aging population, rising awareness of sleep disorders, increased disposable income.
- M&A Activity: XX deals (2019-2024), indicating consolidation and expansion strategies among key players.
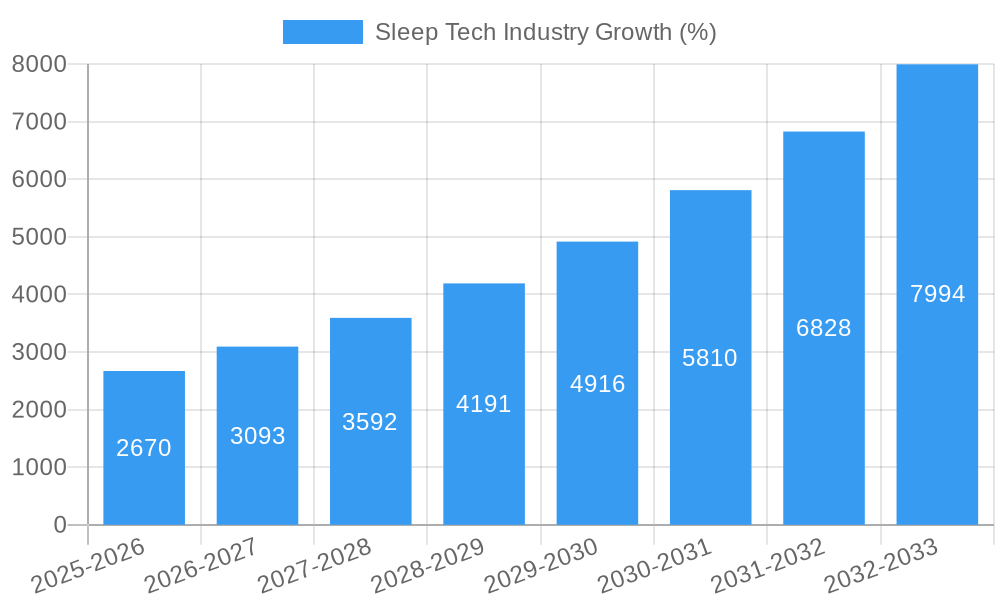
Sleep Tech Industry Growth Trends & Insights
The global sleep tech market is experiencing robust growth, driven by several factors. The market size expanded from XX million units in 2019 to XX million units in 2024, demonstrating a CAGR of XX%. Adoption rates are increasing, particularly for wearable sleep trackers, fueled by rising consumer awareness and the availability of affordable, user-friendly devices. Technological disruptions, such as AI-powered sleep analysis and personalized sleep interventions, are significantly impacting the market. Consumer behavior is shifting towards proactive sleep management and the integration of sleep technology into daily routines. Market penetration is projected to reach XX% by 2033.
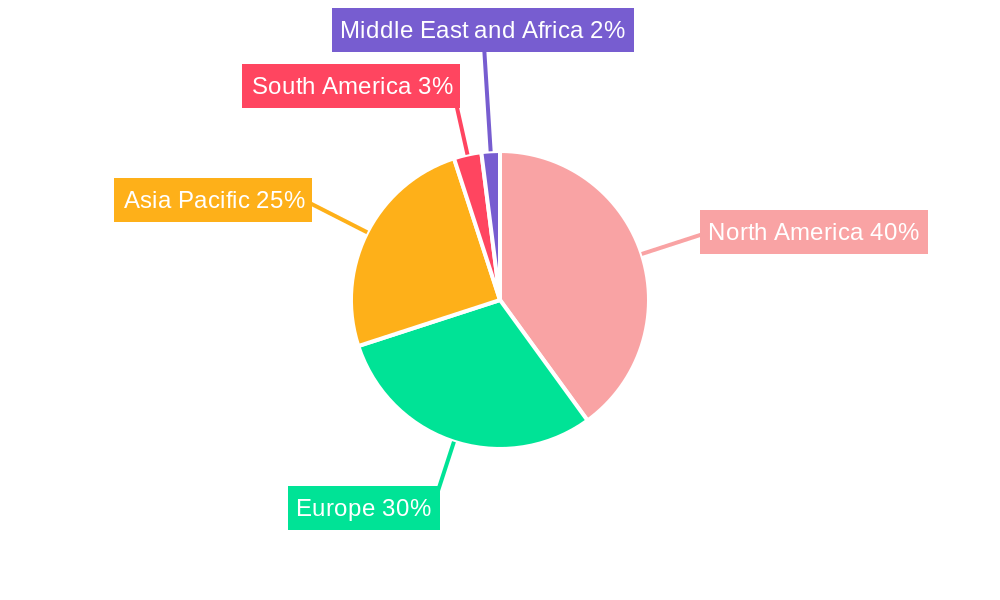
Dominant Regions, Countries, or Segments in Sleep Tech Industry
North America currently dominates the sleep tech market, driven by high consumer adoption rates, strong regulatory frameworks and substantial investment in sleep technology research. Within the product segment, wearables account for the largest market share, reflecting the ease of use and increasing affordability of these devices. In terms of end-users, the homecare segment is experiencing significant growth, propelled by rising demand for at-home sleep solutions.
- Key Drivers (North America): High consumer disposable income, advanced healthcare infrastructure, strong regulatory support, early adoption of technological advancements.
- Product Segment Dominance: Wearables (XX% market share), followed by non-wearables (XX%) and others (XX%).
- End-User Segment Dominance: Homecare settings (XX% market share), followed by hospitals (XX%) and others (XX%).
Sleep Tech Industry Product Landscape
The sleep tech product landscape is characterized by a wide range of devices and solutions, encompassing wearable trackers, smart beds, sleep masks, and other non-wearable technologies. These products offer diverse features, such as sleep stage tracking, sleep apnea detection, personalized sleep coaching, and environmental control. Technological advancements, such as improved sensor technology and AI-powered analysis, are driving the development of more accurate and insightful sleep monitoring and management tools. Unique selling propositions include personalized sleep recommendations, seamless integration with other health apps, and improved user experience.
Key Drivers, Barriers & Challenges in Sleep Tech Industry
Key Drivers: Increasing prevalence of sleep disorders, rising awareness of sleep health, technological advancements in sleep tracking and analysis, and increasing availability of affordable products.
Key Challenges: Data privacy concerns, regulatory hurdles in medical device approvals, high upfront investment costs for advanced technologies, and intense competition from existing and emerging players. Supply chain disruptions may also impact market growth. The lack of standardization in sleep data measurement and interpretation poses a further challenge for market development.
Emerging Opportunities in Sleep Tech Industry
Emerging opportunities lie in the development of personalized sleep solutions, leveraging AI and machine learning to tailor interventions to individual needs. Untapped markets exist in developing countries with growing awareness of sleep health. Integrations with other wellness technologies, such as smart home devices and fitness trackers, offer significant potential. Furthermore, exploring opportunities within corporate wellness programs and telehealth platforms can greatly expand the market.
Growth Accelerators in the Sleep Tech Industry Industry
Long-term growth will be accelerated by technological breakthroughs in areas such as AI-powered sleep analysis and personalized sleep interventions. Strategic partnerships between sleep technology companies and healthcare providers can enhance market penetration. Expansion into new geographical markets, particularly in developing economies with rising healthcare spending, presents significant growth potential. Furthermore, increasing consumer awareness and education campaigns can further boost demand for sleep technology solutions.
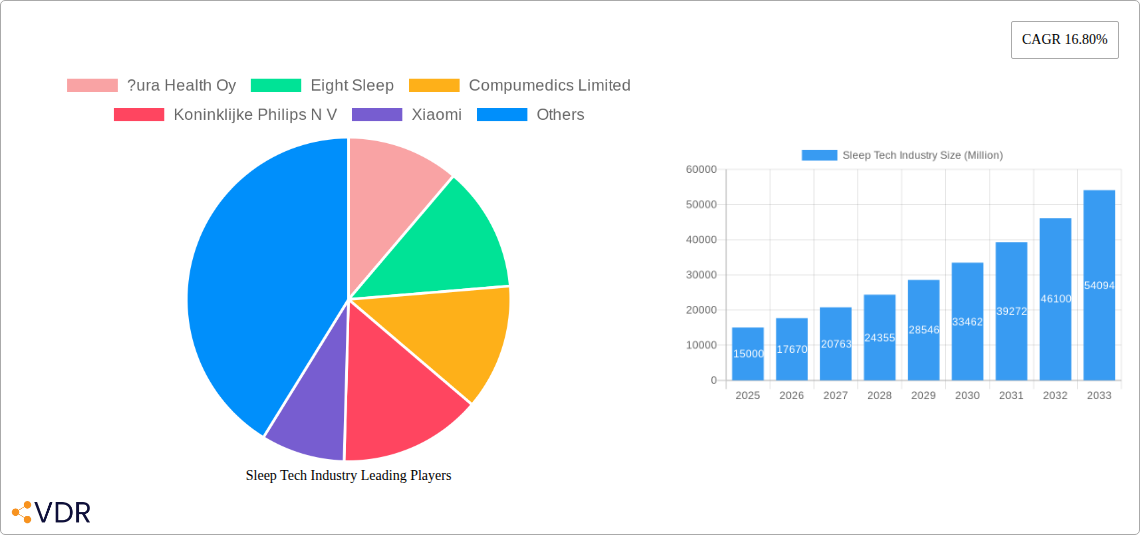
Key Players Shaping the Sleep Tech Industry Market
- ?ura Health Oy
- Eight Sleep
- Compumedics Limited
- Koninklijke Philips N V
- Xiaomi
- Huawei Technologies Co Ltd
- Casper
- Sleep Shepherd LLC
- Nihon Kohden Corporation
- Sleepace
Notable Milestones in Sleep Tech Industry Sector
- September 2022: Sleepme Inc. (ChiliSleep's parent company) launched Hiber-AI and a new sleep tracker.
- May 2022: Huawei Vietnam launched three new smartwatches with advanced sleep tracking features.
In-Depth Sleep Tech Industry Market Outlook
The future of the sleep tech market looks promising, driven by continuous technological advancements, expanding market penetration, and growing consumer awareness. Strategic partnerships and market expansions into untapped geographical regions will further fuel growth. The focus on personalized sleep solutions and integration with other health technologies will reshape the market landscape, creating significant opportunities for innovation and market expansion. The market is projected to reach XX million units by 2033, with a CAGR of XX% from 2025 onwards.
Sleep Tech Industry Segmentation
-
1. Product
-
1.1. Wearables
- 1.1.1. Smart Watches and Bands
- 1.1.2. Other Wearable Products
-
1.2. Non-Wearables
- 1.2.1. Sleep Monitors
- 1.2.2. Beds
- 1.2.3. Other Non-Wearable Products
-
1.1. Wearables
-
2. End User
- 2.1. Hospitals
- 2.2. Homecare Settings
- 2.3. Other End Users
Sleep Tech Industry Segmentation By Geography
-
1. North America
- 1.1. United States
- 1.2. Canada
- 1.3. Mexico
-
2. Europe
- 2.1. Germany
- 2.2. United Kingdom
- 2.3. France
- 2.4. Italy
- 2.5. Spain
- 2.6. Rest of Europe
-
3. Asia Pacific
- 3.1. China
- 3.2. Japan
- 3.3. India
- 3.4. Australia
- 3.5. South Korea
- 3.6. Rest of Asia Pacific
-
4. Middle East and Africa
- 4.1. GCC
- 4.2. South Africa
- 4.3. Rest of Middle East and Africa
-
5. South America
- 5.1. Brazil
- 5.2. Argentina
- 5.3. Rest of South America
Sleep Tech Industry REPORT HIGHLIGHTS
| Aspects | Details |
|---|---|
| Study Period | 2019-2033 |
| Base Year | 2024 |
| Estimated Year | 2025 |
| Forecast Period | 2025-2033 |
| Historical Period | 2019-2024 |
| Growth Rate | CAGR of 16.80% from 2019-2033 |
| Segmentation |
|
Table of Contents
- 1. Introduction
- 1.1. Research Scope
- 1.2. Market Segmentation
- 1.3. Research Methodology
- 1.4. Definitions and Assumptions
- 2. Executive Summary
- 2.1. Introduction
- 3. Market Dynamics
- 3.1. Introduction
- 3.2. Market Drivers
- 3.2.1. Increasing Prevalence of Sleep Disorders; Technological Advancements
- 3.3. Market Restrains
- 3.3.1. High Cost of Sleep Tech Devices
- 3.4. Market Trends
- 3.4.1. Smart Watches and Bands Segment is Expected to Hold a Significant Share of the Sleep Tech Devices Market Over the Forecast Period
- 4. Market Factor Analysis
- 4.1. Porters Five Forces
- 4.2. Supply/Value Chain
- 4.3. PESTEL analysis
- 4.4. Market Entropy
- 4.5. Patent/Trademark Analysis
- 5. Global Sleep Tech Industry Analysis, Insights and Forecast, 2019-2031
- 5.1. Market Analysis, Insights and Forecast - by Product
- 5.1.1. Wearables
- 5.1.1.1. Smart Watches and Bands
- 5.1.1.2. Other Wearable Products
- 5.1.2. Non-Wearables
- 5.1.2.1. Sleep Monitors
- 5.1.2.2. Beds
- 5.1.2.3. Other Non-Wearable Products
- 5.1.1. Wearables
- 5.2. Market Analysis, Insights and Forecast - by End User
- 5.2.1. Hospitals
- 5.2.2. Homecare Settings
- 5.2.3. Other End Users
- 5.3. Market Analysis, Insights and Forecast - by Region
- 5.3.1. North America
- 5.3.2. Europe
- 5.3.3. Asia Pacific
- 5.3.4. Middle East and Africa
- 5.3.5. South America
- 5.1. Market Analysis, Insights and Forecast - by Product
- 6. North America Sleep Tech Industry Analysis, Insights and Forecast, 2019-2031
- 6.1. Market Analysis, Insights and Forecast - by Product
- 6.1.1. Wearables
- 6.1.1.1. Smart Watches and Bands
- 6.1.1.2. Other Wearable Products
- 6.1.2. Non-Wearables
- 6.1.2.1. Sleep Monitors
- 6.1.2.2. Beds
- 6.1.2.3. Other Non-Wearable Products
- 6.1.1. Wearables
- 6.2. Market Analysis, Insights and Forecast - by End User
- 6.2.1. Hospitals
- 6.2.2. Homecare Settings
- 6.2.3. Other End Users
- 6.1. Market Analysis, Insights and Forecast - by Product
- 7. Europe Sleep Tech Industry Analysis, Insights and Forecast, 2019-2031
- 7.1. Market Analysis, Insights and Forecast - by Product
- 7.1.1. Wearables
- 7.1.1.1. Smart Watches and Bands
- 7.1.1.2. Other Wearable Products
- 7.1.2. Non-Wearables
- 7.1.2.1. Sleep Monitors
- 7.1.2.2. Beds
- 7.1.2.3. Other Non-Wearable Products
- 7.1.1. Wearables
- 7.2. Market Analysis, Insights and Forecast - by End User
- 7.2.1. Hospitals
- 7.2.2. Homecare Settings
- 7.2.3. Other End Users
- 7.1. Market Analysis, Insights and Forecast - by Product
- 8. Asia Pacific Sleep Tech Industry Analysis, Insights and Forecast, 2019-2031
- 8.1. Market Analysis, Insights and Forecast - by Product
- 8.1.1. Wearables
- 8.1.1.1. Smart Watches and Bands
- 8.1.1.2. Other Wearable Products
- 8.1.2. Non-Wearables
- 8.1.2.1. Sleep Monitors
- 8.1.2.2. Beds
- 8.1.2.3. Other Non-Wearable Products
- 8.1.1. Wearables
- 8.2. Market Analysis, Insights and Forecast - by End User
- 8.2.1. Hospitals
- 8.2.2. Homecare Settings
- 8.2.3. Other End Users
- 8.1. Market Analysis, Insights and Forecast - by Product
- 9. Middle East and Africa Sleep Tech Industry Analysis, Insights and Forecast, 2019-2031
- 9.1. Market Analysis, Insights and Forecast - by Product
- 9.1.1. Wearables
- 9.1.1.1. Smart Watches and Bands
- 9.1.1.2. Other Wearable Products
- 9.1.2. Non-Wearables
- 9.1.2.1. Sleep Monitors
- 9.1.2.2. Beds
- 9.1.2.3. Other Non-Wearable Products
- 9.1.1. Wearables
- 9.2. Market Analysis, Insights and Forecast - by End User
- 9.2.1. Hospitals
- 9.2.2. Homecare Settings
- 9.2.3. Other End Users
- 9.1. Market Analysis, Insights and Forecast - by Product
- 10. South America Sleep Tech Industry Analysis, Insights and Forecast, 2019-2031
- 10.1. Market Analysis, Insights and Forecast - by Product
- 10.1.1. Wearables
- 10.1.1.1. Smart Watches and Bands
- 10.1.1.2. Other Wearable Products
- 10.1.2. Non-Wearables
- 10.1.2.1. Sleep Monitors
- 10.1.2.2. Beds
- 10.1.2.3. Other Non-Wearable Products
- 10.1.1. Wearables
- 10.2. Market Analysis, Insights and Forecast - by End User
- 10.2.1. Hospitals
- 10.2.2. Homecare Settings
- 10.2.3. Other End Users
- 10.1. Market Analysis, Insights and Forecast - by Product
- 11. North America Sleep Tech Industry Analysis, Insights and Forecast, 2019-2031
- 11.1. Market Analysis, Insights and Forecast - By Country/Sub-region
- 11.1.1 United States
- 11.1.2 Canada
- 11.1.3 Mexico
- 12. Europe Sleep Tech Industry Analysis, Insights and Forecast, 2019-2031
- 12.1. Market Analysis, Insights and Forecast - By Country/Sub-region
- 12.1.1 Germany
- 12.1.2 United Kingdom
- 12.1.3 France
- 12.1.4 Italy
- 12.1.5 Spain
- 12.1.6 Rest of Europe
- 13. Asia Pacific Sleep Tech Industry Analysis, Insights and Forecast, 2019-2031
- 13.1. Market Analysis, Insights and Forecast - By Country/Sub-region
- 13.1.1 China
- 13.1.2 Japan
- 13.1.3 India
- 13.1.4 Australia
- 13.1.5 South Korea
- 13.1.6 Rest of Asia Pacific
- 14. South America Sleep Tech Industry Analysis, Insights and Forecast, 2019-2031
- 14.1. Market Analysis, Insights and Forecast - By Country/Sub-region
- 14.1.1 Brazil
- 14.1.2 Argentina
- 14.1.3 Rest of South America
- 15. Middle East and Africa Sleep Tech Industry Analysis, Insights and Forecast, 2019-2031
- 15.1. Market Analysis, Insights and Forecast - By Country/Sub-region
- 15.1.1 GCC
- 15.1.2 South Africa
- 15.1.3 Rest of Middle East and Africa
- 16. Competitive Analysis
- 16.1. Global Market Share Analysis 2024
- 16.2. Company Profiles
- 16.2.1 ?ura Health Oy
- 16.2.1.1. Overview
- 16.2.1.2. Products
- 16.2.1.3. SWOT Analysis
- 16.2.1.4. Recent Developments
- 16.2.1.5. Financials (Based on Availability)
- 16.2.2 Eight Sleep
- 16.2.2.1. Overview
- 16.2.2.2. Products
- 16.2.2.3. SWOT Analysis
- 16.2.2.4. Recent Developments
- 16.2.2.5. Financials (Based on Availability)
- 16.2.3 Compumedics Limited
- 16.2.3.1. Overview
- 16.2.3.2. Products
- 16.2.3.3. SWOT Analysis
- 16.2.3.4. Recent Developments
- 16.2.3.5. Financials (Based on Availability)
- 16.2.4 Koninklijke Philips N V
- 16.2.4.1. Overview
- 16.2.4.2. Products
- 16.2.4.3. SWOT Analysis
- 16.2.4.4. Recent Developments
- 16.2.4.5. Financials (Based on Availability)
- 16.2.5 Xiaomi
- 16.2.5.1. Overview
- 16.2.5.2. Products
- 16.2.5.3. SWOT Analysis
- 16.2.5.4. Recent Developments
- 16.2.5.5. Financials (Based on Availability)
- 16.2.6 Huawei Technologies Co Ltd
- 16.2.6.1. Overview
- 16.2.6.2. Products
- 16.2.6.3. SWOT Analysis
- 16.2.6.4. Recent Developments
- 16.2.6.5. Financials (Based on Availability)
- 16.2.7 Casper
- 16.2.7.1. Overview
- 16.2.7.2. Products
- 16.2.7.3. SWOT Analysis
- 16.2.7.4. Recent Developments
- 16.2.7.5. Financials (Based on Availability)
- 16.2.8 Sleep Shepherd LLC
- 16.2.8.1. Overview
- 16.2.8.2. Products
- 16.2.8.3. SWOT Analysis
- 16.2.8.4. Recent Developments
- 16.2.8.5. Financials (Based on Availability)
- 16.2.9 Nihon Kohden Corporation
- 16.2.9.1. Overview
- 16.2.9.2. Products
- 16.2.9.3. SWOT Analysis
- 16.2.9.4. Recent Developments
- 16.2.9.5. Financials (Based on Availability)
- 16.2.10 Sleepace
- 16.2.10.1. Overview
- 16.2.10.2. Products
- 16.2.10.3. SWOT Analysis
- 16.2.10.4. Recent Developments
- 16.2.10.5. Financials (Based on Availability)
- 16.2.1 ?ura Health Oy
List of Figures
- Figure 1: Global Sleep Tech Industry Revenue Breakdown (Million, %) by Region 2024 & 2032
- Figure 2: North America Sleep Tech Industry Revenue (Million), by Country 2024 & 2032
- Figure 3: North America Sleep Tech Industry Revenue Share (%), by Country 2024 & 2032
- Figure 4: Europe Sleep Tech Industry Revenue (Million), by Country 2024 & 2032
- Figure 5: Europe Sleep Tech Industry Revenue Share (%), by Country 2024 & 2032
- Figure 6: Asia Pacific Sleep Tech Industry Revenue (Million), by Country 2024 & 2032
- Figure 7: Asia Pacific Sleep Tech Industry Revenue Share (%), by Country 2024 & 2032
- Figure 8: South America Sleep Tech Industry Revenue (Million), by Country 2024 & 2032
- Figure 9: South America Sleep Tech Industry Revenue Share (%), by Country 2024 & 2032
- Figure 10: Middle East and Africa Sleep Tech Industry Revenue (Million), by Country 2024 & 2032
- Figure 11: Middle East and Africa Sleep Tech Industry Revenue Share (%), by Country 2024 & 2032
- Figure 12: North America Sleep Tech Industry Revenue (Million), by Product 2024 & 2032
- Figure 13: North America Sleep Tech Industry Revenue Share (%), by Product 2024 & 2032
- Figure 14: North America Sleep Tech Industry Revenue (Million), by End User 2024 & 2032
- Figure 15: North America Sleep Tech Industry Revenue Share (%), by End User 2024 & 2032
- Figure 16: North America Sleep Tech Industry Revenue (Million), by Country 2024 & 2032
- Figure 17: North America Sleep Tech Industry Revenue Share (%), by Country 2024 & 2032
- Figure 18: Europe Sleep Tech Industry Revenue (Million), by Product 2024 & 2032
- Figure 19: Europe Sleep Tech Industry Revenue Share (%), by Product 2024 & 2032
- Figure 20: Europe Sleep Tech Industry Revenue (Million), by End User 2024 & 2032
- Figure 21: Europe Sleep Tech Industry Revenue Share (%), by End User 2024 & 2032
- Figure 22: Europe Sleep Tech Industry Revenue (Million), by Country 2024 & 2032
- Figure 23: Europe Sleep Tech Industry Revenue Share (%), by Country 2024 & 2032
- Figure 24: Asia Pacific Sleep Tech Industry Revenue (Million), by Product 2024 & 2032
- Figure 25: Asia Pacific Sleep Tech Industry Revenue Share (%), by Product 2024 & 2032
- Figure 26: Asia Pacific Sleep Tech Industry Revenue (Million), by End User 2024 & 2032
- Figure 27: Asia Pacific Sleep Tech Industry Revenue Share (%), by End User 2024 & 2032
- Figure 28: Asia Pacific Sleep Tech Industry Revenue (Million), by Country 2024 & 2032
- Figure 29: Asia Pacific Sleep Tech Industry Revenue Share (%), by Country 2024 & 2032
- Figure 30: Middle East and Africa Sleep Tech Industry Revenue (Million), by Product 2024 & 2032
- Figure 31: Middle East and Africa Sleep Tech Industry Revenue Share (%), by Product 2024 & 2032
- Figure 32: Middle East and Africa Sleep Tech Industry Revenue (Million), by End User 2024 & 2032
- Figure 33: Middle East and Africa Sleep Tech Industry Revenue Share (%), by End User 2024 & 2032
- Figure 34: Middle East and Africa Sleep Tech Industry Revenue (Million), by Country 2024 & 2032
- Figure 35: Middle East and Africa Sleep Tech Industry Revenue Share (%), by Country 2024 & 2032
- Figure 36: South America Sleep Tech Industry Revenue (Million), by Product 2024 & 2032
- Figure 37: South America Sleep Tech Industry Revenue Share (%), by Product 2024 & 2032
- Figure 38: South America Sleep Tech Industry Revenue (Million), by End User 2024 & 2032
- Figure 39: South America Sleep Tech Industry Revenue Share (%), by End User 2024 & 2032
- Figure 40: South America Sleep Tech Industry Revenue (Million), by Country 2024 & 2032
- Figure 41: South America Sleep Tech Industry Revenue Share (%), by Country 2024 & 2032
List of Tables
- Table 1: Global Sleep Tech Industry Revenue Million Forecast, by Region 2019 & 2032
- Table 2: Global Sleep Tech Industry Revenue Million Forecast, by Product 2019 & 2032
- Table 3: Global Sleep Tech Industry Revenue Million Forecast, by End User 2019 & 2032
- Table 4: Global Sleep Tech Industry Revenue Million Forecast, by Region 2019 & 2032
- Table 5: Global Sleep Tech Industry Revenue Million Forecast, by Country 2019 & 2032
- Table 6: United States Sleep Tech Industry Revenue (Million) Forecast, by Application 2019 & 2032
- Table 7: Canada Sleep Tech Industry Revenue (Million) Forecast, by Application 2019 & 2032
- Table 8: Mexico Sleep Tech Industry Revenue (Million) Forecast, by Application 2019 & 2032
- Table 9: Global Sleep Tech Industry Revenue Million Forecast, by Country 2019 & 2032
- Table 10: Germany Sleep Tech Industry Revenue (Million) Forecast, by Application 2019 & 2032
- Table 11: United Kingdom Sleep Tech Industry Revenue (Million) Forecast, by Application 2019 & 2032
- Table 12: France Sleep Tech Industry Revenue (Million) Forecast, by Application 2019 & 2032
- Table 13: Italy Sleep Tech Industry Revenue (Million) Forecast, by Application 2019 & 2032
- Table 14: Spain Sleep Tech Industry Revenue (Million) Forecast, by Application 2019 & 2032
- Table 15: Rest of Europe Sleep Tech Industry Revenue (Million) Forecast, by Application 2019 & 2032
- Table 16: Global Sleep Tech Industry Revenue Million Forecast, by Country 2019 & 2032
- Table 17: China Sleep Tech Industry Revenue (Million) Forecast, by Application 2019 & 2032
- Table 18: Japan Sleep Tech Industry Revenue (Million) Forecast, by Application 2019 & 2032
- Table 19: India Sleep Tech Industry Revenue (Million) Forecast, by Application 2019 & 2032
- Table 20: Australia Sleep Tech Industry Revenue (Million) Forecast, by Application 2019 & 2032
- Table 21: South Korea Sleep Tech Industry Revenue (Million) Forecast, by Application 2019 & 2032
- Table 22: Rest of Asia Pacific Sleep Tech Industry Revenue (Million) Forecast, by Application 2019 & 2032
- Table 23: Global Sleep Tech Industry Revenue Million Forecast, by Country 2019 & 2032
- Table 24: Brazil Sleep Tech Industry Revenue (Million) Forecast, by Application 2019 & 2032
- Table 25: Argentina Sleep Tech Industry Revenue (Million) Forecast, by Application 2019 & 2032
- Table 26: Rest of South America Sleep Tech Industry Revenue (Million) Forecast, by Application 2019 & 2032
- Table 27: Global Sleep Tech Industry Revenue Million Forecast, by Country 2019 & 2032
- Table 28: GCC Sleep Tech Industry Revenue (Million) Forecast, by Application 2019 & 2032
- Table 29: South Africa Sleep Tech Industry Revenue (Million) Forecast, by Application 2019 & 2032
- Table 30: Rest of Middle East and Africa Sleep Tech Industry Revenue (Million) Forecast, by Application 2019 & 2032
- Table 31: Global Sleep Tech Industry Revenue Million Forecast, by Product 2019 & 2032
- Table 32: Global Sleep Tech Industry Revenue Million Forecast, by End User 2019 & 2032
- Table 33: Global Sleep Tech Industry Revenue Million Forecast, by Country 2019 & 2032
- Table 34: United States Sleep Tech Industry Revenue (Million) Forecast, by Application 2019 & 2032
- Table 35: Canada Sleep Tech Industry Revenue (Million) Forecast, by Application 2019 & 2032
- Table 36: Mexico Sleep Tech Industry Revenue (Million) Forecast, by Application 2019 & 2032
- Table 37: Global Sleep Tech Industry Revenue Million Forecast, by Product 2019 & 2032
- Table 38: Global Sleep Tech Industry Revenue Million Forecast, by End User 2019 & 2032
- Table 39: Global Sleep Tech Industry Revenue Million Forecast, by Country 2019 & 2032
- Table 40: Germany Sleep Tech Industry Revenue (Million) Forecast, by Application 2019 & 2032
- Table 41: United Kingdom Sleep Tech Industry Revenue (Million) Forecast, by Application 2019 & 2032
- Table 42: France Sleep Tech Industry Revenue (Million) Forecast, by Application 2019 & 2032
- Table 43: Italy Sleep Tech Industry Revenue (Million) Forecast, by Application 2019 & 2032
- Table 44: Spain Sleep Tech Industry Revenue (Million) Forecast, by Application 2019 & 2032
- Table 45: Rest of Europe Sleep Tech Industry Revenue (Million) Forecast, by Application 2019 & 2032
- Table 46: Global Sleep Tech Industry Revenue Million Forecast, by Product 2019 & 2032
- Table 47: Global Sleep Tech Industry Revenue Million Forecast, by End User 2019 & 2032
- Table 48: Global Sleep Tech Industry Revenue Million Forecast, by Country 2019 & 2032
- Table 49: China Sleep Tech Industry Revenue (Million) Forecast, by Application 2019 & 2032
- Table 50: Japan Sleep Tech Industry Revenue (Million) Forecast, by Application 2019 & 2032
- Table 51: India Sleep Tech Industry Revenue (Million) Forecast, by Application 2019 & 2032
- Table 52: Australia Sleep Tech Industry Revenue (Million) Forecast, by Application 2019 & 2032
- Table 53: South Korea Sleep Tech Industry Revenue (Million) Forecast, by Application 2019 & 2032
- Table 54: Rest of Asia Pacific Sleep Tech Industry Revenue (Million) Forecast, by Application 2019 & 2032
- Table 55: Global Sleep Tech Industry Revenue Million Forecast, by Product 2019 & 2032
- Table 56: Global Sleep Tech Industry Revenue Million Forecast, by End User 2019 & 2032
- Table 57: Global Sleep Tech Industry Revenue Million Forecast, by Country 2019 & 2032
- Table 58: GCC Sleep Tech Industry Revenue (Million) Forecast, by Application 2019 & 2032
- Table 59: South Africa Sleep Tech Industry Revenue (Million) Forecast, by Application 2019 & 2032
- Table 60: Rest of Middle East and Africa Sleep Tech Industry Revenue (Million) Forecast, by Application 2019 & 2032
- Table 61: Global Sleep Tech Industry Revenue Million Forecast, by Product 2019 & 2032
- Table 62: Global Sleep Tech Industry Revenue Million Forecast, by End User 2019 & 2032
- Table 63: Global Sleep Tech Industry Revenue Million Forecast, by Country 2019 & 2032
- Table 64: Brazil Sleep Tech Industry Revenue (Million) Forecast, by Application 2019 & 2032
- Table 65: Argentina Sleep Tech Industry Revenue (Million) Forecast, by Application 2019 & 2032
- Table 66: Rest of South America Sleep Tech Industry Revenue (Million) Forecast, by Application 2019 & 2032
Frequently Asked Questions
1. What is the projected Compound Annual Growth Rate (CAGR) of the Sleep Tech Industry?
The projected CAGR is approximately 16.80%.
2. Which companies are prominent players in the Sleep Tech Industry?
Key companies in the market include ?ura Health Oy, Eight Sleep, Compumedics Limited, Koninklijke Philips N V, Xiaomi, Huawei Technologies Co Ltd, Casper, Sleep Shepherd LLC, Nihon Kohden Corporation, Sleepace.
3. What are the main segments of the Sleep Tech Industry?
The market segments include Product, End User.
4. Can you provide details about the market size?
The market size is estimated to be USD XX Million as of 2022.
5. What are some drivers contributing to market growth?
Increasing Prevalence of Sleep Disorders; Technological Advancements.
6. What are the notable trends driving market growth?
Smart Watches and Bands Segment is Expected to Hold a Significant Share of the Sleep Tech Devices Market Over the Forecast Period.
7. Are there any restraints impacting market growth?
High Cost of Sleep Tech Devices.
8. Can you provide examples of recent developments in the market?
Sept 2022: Sleepme Inc., the parent company of ChiliSleep, released its first-of-its-kind technology, Hiber-AI, along with a non-wearable sleep tracker that collects, analyzes, and acts on sleep data in real-time. Both are part of the new sleepme+ membership.
9. What pricing options are available for accessing the report?
Pricing options include single-user, multi-user, and enterprise licenses priced at USD 4750, USD 5250, and USD 8750 respectively.
10. Is the market size provided in terms of value or volume?
The market size is provided in terms of value, measured in Million.
11. Are there any specific market keywords associated with the report?
Yes, the market keyword associated with the report is "Sleep Tech Industry," which aids in identifying and referencing the specific market segment covered.
12. How do I determine which pricing option suits my needs best?
The pricing options vary based on user requirements and access needs. Individual users may opt for single-user licenses, while businesses requiring broader access may choose multi-user or enterprise licenses for cost-effective access to the report.
13. Are there any additional resources or data provided in the Sleep Tech Industry report?
While the report offers comprehensive insights, it's advisable to review the specific contents or supplementary materials provided to ascertain if additional resources or data are available.
14. How can I stay updated on further developments or reports in the Sleep Tech Industry?
To stay informed about further developments, trends, and reports in the Sleep Tech Industry, consider subscribing to industry newsletters, following relevant companies and organizations, or regularly checking reputable industry news sources and publications.
Methodology
Step 1 - Identification of Relevant Samples Size from Population Database


Step 2 - Approaches for Defining Global Market Size (Value, Volume* & Price*)

Note*: In applicable scenarios
Step 3 - Data Sources
Primary Research
- Web Analytics
- Survey Reports
- Research Institute
- Latest Research Reports
- Opinion Leaders
Secondary Research
- Annual Reports
- White Paper
- Latest Press Release
- Industry Association
- Paid Database
- Investor Presentations

Step 4 - Data Triangulation
Involves using different sources of information in order to increase the validity of a study
These sources are likely to be stakeholders in a program - participants, other researchers, program staff, other community members, and so on.
Then we put all data in single framework & apply various statistical tools to find out the dynamic on the market.
During the analysis stage, feedback from the stakeholder groups would be compared to determine areas of agreement as well as areas of divergence


