
Key Insights
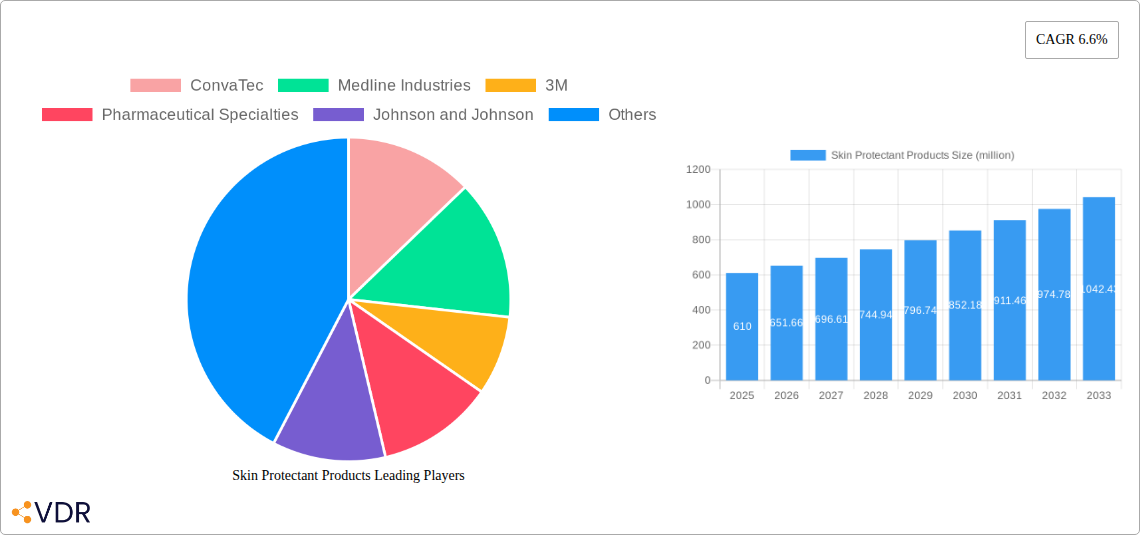
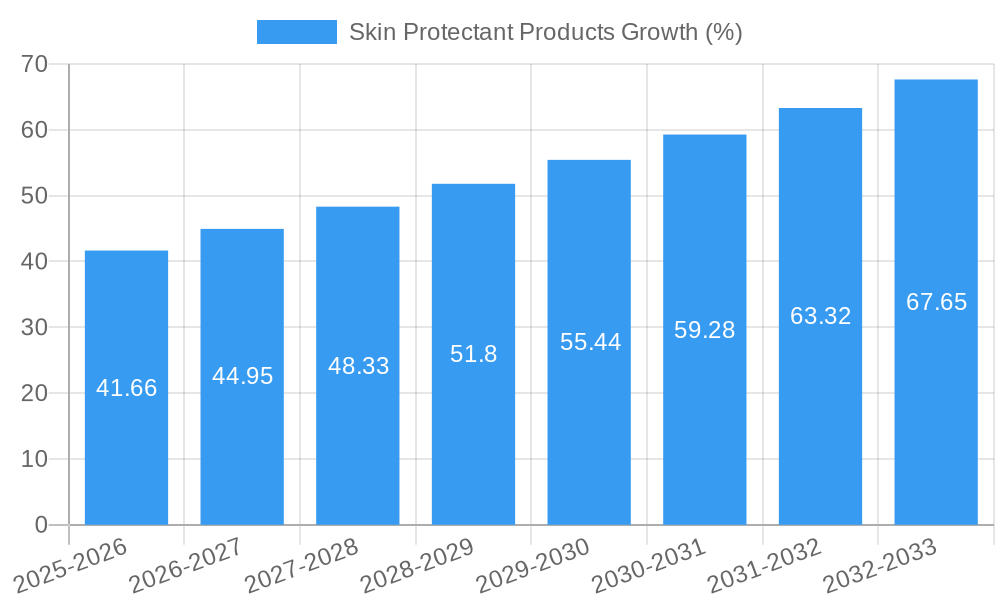
The global skin protectant products market, valued at $610 million in 2025, is projected to experience robust growth, driven by a compound annual growth rate (CAGR) of 6.6% from 2025 to 2033. This expansion is fueled by several key factors. The rising prevalence of chronic wounds, including pressure ulcers and diabetic foot ulcers, necessitates the consistent use of skin protectants for effective management and prevention. Furthermore, an aging global population, with its associated increase in skin fragility and susceptibility to injury, significantly contributes to market growth. Technological advancements leading to the development of more effective and user-friendly skin protectant formulations, such as those incorporating advanced barrier technologies and antimicrobial agents, are further stimulating market demand. The growing awareness among healthcare professionals and consumers regarding the importance of proactive skin protection is also playing a crucial role in market expansion. Major players like ConvaTec, Medline Industries, 3M, and Johnson & Johnson are actively investing in research and development, further contributing to market innovation and growth.
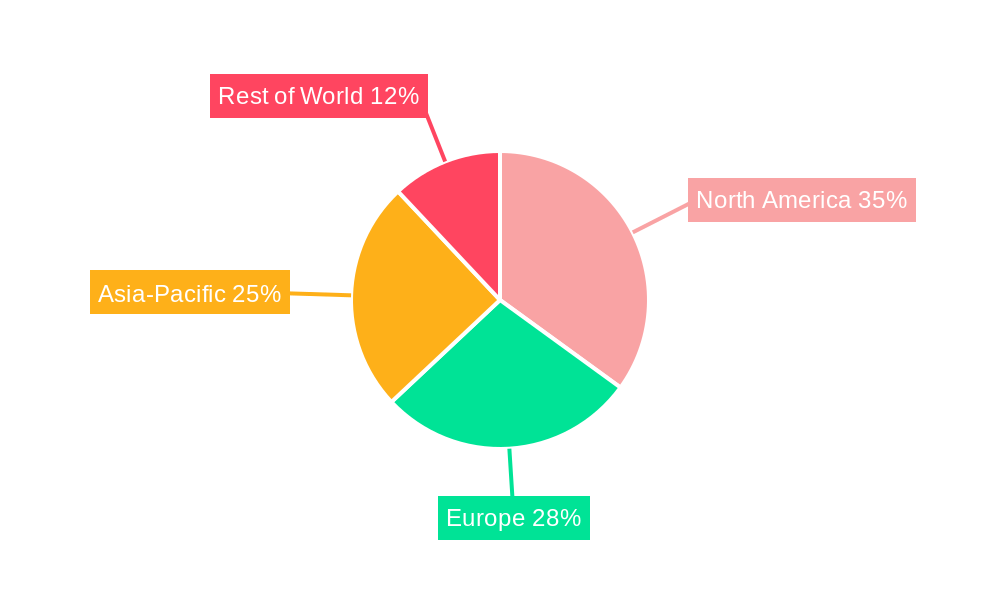
The market segmentation is likely diverse, encompassing various product types like barrier creams, ointments, films, and sprays, each catering to specific needs and wound types. Geographical variations in market size and growth rates are expected, with developed regions like North America and Europe potentially exhibiting higher adoption rates due to increased healthcare spending and awareness. However, emerging economies are also poised for significant growth, driven by rising disposable incomes and improving healthcare infrastructure. While regulatory hurdles and pricing pressures might pose some challenges, the overall market outlook remains positive, suggesting continued expansion over the forecast period. The competitive landscape is characterized by both large multinational corporations and specialized smaller players, leading to innovation and diverse product offerings.
Skin Protectant Products Market Report: 2019-2033
This comprehensive report provides a detailed analysis of the global skin protectant products market, encompassing historical data (2019-2024), current estimations (2025), and future projections (2025-2033). The report segments the market by product type (e.g., barrier creams, ointments, films), application (e.g., wound care, incontinence care, dermatological conditions), and geography, offering granular insights for informed decision-making. Key players such as ConvaTec, Medline Industries, 3M, Johnson & Johnson, and Pfizer are thoroughly examined, along with emerging opportunities and challenges within this dynamic market, valued at xx million units in 2025.
Skin Protectant Products Market Dynamics & Structure
The global skin protectant products market is characterized by moderate concentration, with a few major players holding significant market share. The market is driven by technological innovations focused on enhanced efficacy, improved patient comfort, and reduced healthcare costs. Stringent regulatory frameworks govern product development and marketing, influencing market dynamics. Competitive substitutes include traditional wound care methods and other topical treatments. The end-user demographics are broad, encompassing hospitals, nursing homes, home healthcare settings, and individual consumers. M&A activity has been moderate, with strategic acquisitions aimed at expanding product portfolios and geographical reach.
- Market Concentration: Moderately concentrated, with the top 5 players holding approximately xx% of market share in 2025.
- Technological Innovation: Focus on advanced wound healing technologies, biodegradable materials, and improved delivery systems.
- Regulatory Framework: Stringent guidelines on efficacy, safety, and labeling impacting product development and approval times.
- Competitive Substitutes: Traditional wound dressings, topical antibiotics, and home remedies compete for market share.
- End-User Demographics: Hospitals, nursing homes, home healthcare, and individual consumers across various age groups.
- M&A Trends: xx major acquisitions recorded between 2019 and 2024, primarily focused on expanding product lines and geographic reach.
Skin Protectant Products Growth Trends & Insights
The global skin protectant products market experienced a CAGR of xx% during the historical period (2019-2024), reaching an estimated xx million units in 2025. Adoption rates are high in developed regions due to increasing prevalence of chronic wounds and skin conditions, coupled with rising healthcare expenditure. Technological disruptions, including the development of advanced wound dressings and bioengineered skin substitutes, are driving market expansion. Consumer behavior shifts toward self-care and preference for convenient, easy-to-use products are impacting market demand. The market is expected to maintain a robust growth trajectory in the forecast period (2025-2033), fueled by aging populations, rising prevalence of chronic diseases, and technological advancements. Market penetration is expected to reach xx% by 2033.
Dominant Regions, Countries, or Segments in Skin Protectant Products
North America currently dominates the skin protectant products market, driven by high healthcare expenditure, technological advancements, and a significant aging population. Europe holds a substantial market share, while Asia-Pacific is experiencing rapid growth fueled by rising disposable incomes and improving healthcare infrastructure. The wound care segment within skin protectant products accounts for a significant share of the overall market due to rising incidence of chronic wounds associated with diabetes and aging.
- North America: High healthcare expenditure, aging population, and advanced healthcare infrastructure.
- Europe: Mature market with substantial demand, driven by chronic wound prevalence.
- Asia-Pacific: Rapidly growing market driven by increasing healthcare awareness and disposable incomes.
- Wound Care Segment: Dominant segment driven by the high prevalence of chronic wounds.
Skin Protectant Products Product Landscape
The skin protectant products market encompasses a wide range of products, including barrier creams, ointments, films, and gels, each with unique formulations and applications. Innovation focuses on improving adherence, enhancing breathability, and minimizing allergic reactions. Products are formulated for various applications, including wound care, incontinence management, and skin protection in various medical settings. Performance metrics prioritize efficacy in preventing skin breakdown, reducing infection risk, and promoting wound healing. Key selling propositions often involve ease of application, improved comfort, and cost-effectiveness.
Key Drivers, Barriers & Challenges in Skin Protectant Products
Key Drivers:
- Increasing prevalence of chronic wounds and skin conditions.
- Aging global population leading to increased demand for skin protection.
- Technological advancements resulting in improved product efficacy and convenience.
- Rising healthcare expenditure in developed and developing nations.
Key Barriers & Challenges:
- Stringent regulatory approvals and compliance requirements.
- High research and development costs associated with new product development.
- Competition from generic and substitute products.
- Supply chain disruptions impacting product availability and cost. This led to a xx% increase in prices in 2022.
Emerging Opportunities in Skin Protectant Products
- Untapped markets in developing countries with rising healthcare awareness.
- Development of bio-engineered skin substitutes and advanced wound dressings.
- Growing demand for home healthcare products and convenient self-care solutions.
- Customized skin protectant products addressing specific skin conditions and patient needs.
Growth Accelerators in the Skin Protectant Products Industry
Strategic partnerships between pharmaceutical companies and medical device manufacturers are accelerating market growth by facilitating product development and distribution. Technological breakthroughs in wound healing technologies are leading to the development of more effective and convenient skin protectant products. Market expansion into developing economies with rising healthcare awareness presents significant growth opportunities.
Key Players Shaping the Skin Protectant Products Market
- ConvaTec
- Medline Industries
- 3M
- Pharmaceutical Specialties
- Johnson & Johnson
- Pfizer
- Unilever
- DermaRite Industries
- Smith & Nephew
- Essity
- Coloplast
Notable Milestones in Skin Protectant Products Sector
- 2020: Launch of a new bioengineered skin substitute by a major player.
- 2021: Acquisition of a smaller skin protectant company by a leading manufacturer.
- 2022: Introduction of a new line of hypoallergenic barrier creams.
- 2023: Publication of key clinical trial data supporting the efficacy of a novel wound healing technology.
In-Depth Skin Protectant Products Market Outlook
The skin protectant products market is poised for sustained growth driven by technological innovation, demographic shifts, and increasing healthcare expenditure. Strategic partnerships, expansion into emerging markets, and the development of advanced wound healing technologies will drive future market potential. Companies focusing on personalized medicine and innovative product development will gain a competitive advantage in this rapidly evolving landscape.
Skin Protectant Products Segmentation
-
1. Application
- 1.1. Adults
- 1.2. Baby & Kids
-
2. Types
- 2.1. Personal Care Skin Protectants
- 2.2. Medical Skin Protectants
Skin Protectant Products Segmentation By Geography
-
1. North America
- 1.1. United States
- 1.2. Canada
- 1.3. Mexico
-
2. South America
- 2.1. Brazil
- 2.2. Argentina
- 2.3. Rest of South America
-
3. Europe
- 3.1. United Kingdom
- 3.2. Germany
- 3.3. France
- 3.4. Italy
- 3.5. Spain
- 3.6. Russia
- 3.7. Benelux
- 3.8. Nordics
- 3.9. Rest of Europe
-
4. Middle East & Africa
- 4.1. Turkey
- 4.2. Israel
- 4.3. GCC
- 4.4. North Africa
- 4.5. South Africa
- 4.6. Rest of Middle East & Africa
-
5. Asia Pacific
- 5.1. China
- 5.2. India
- 5.3. Japan
- 5.4. South Korea
- 5.5. ASEAN
- 5.6. Oceania
- 5.7. Rest of Asia Pacific
Skin Protectant Products REPORT HIGHLIGHTS
| Aspects | Details |
|---|---|
| Study Period | 2019-2033 |
| Base Year | 2024 |
| Estimated Year | 2025 |
| Forecast Period | 2025-2033 |
| Historical Period | 2019-2024 |
| Growth Rate | CAGR of 6.6% from 2019-2033 |
| Segmentation |
|
Table of Contents
- 1. Introduction
- 1.1. Research Scope
- 1.2. Market Segmentation
- 1.3. Research Methodology
- 1.4. Definitions and Assumptions
- 2. Executive Summary
- 2.1. Introduction
- 3. Market Dynamics
- 3.1. Introduction
- 3.2. Market Drivers
- 3.3. Market Restrains
- 3.4. Market Trends
- 4. Market Factor Analysis
- 4.1. Porters Five Forces
- 4.2. Supply/Value Chain
- 4.3. PESTEL analysis
- 4.4. Market Entropy
- 4.5. Patent/Trademark Analysis
- 5. Global Skin Protectant Products Analysis, Insights and Forecast, 2019-2031
- 5.1. Market Analysis, Insights and Forecast - by Application
- 5.1.1. Adults
- 5.1.2. Baby & Kids
- 5.2. Market Analysis, Insights and Forecast - by Types
- 5.2.1. Personal Care Skin Protectants
- 5.2.2. Medical Skin Protectants
- 5.3. Market Analysis, Insights and Forecast - by Region
- 5.3.1. North America
- 5.3.2. South America
- 5.3.3. Europe
- 5.3.4. Middle East & Africa
- 5.3.5. Asia Pacific
- 5.1. Market Analysis, Insights and Forecast - by Application
- 6. North America Skin Protectant Products Analysis, Insights and Forecast, 2019-2031
- 6.1. Market Analysis, Insights and Forecast - by Application
- 6.1.1. Adults
- 6.1.2. Baby & Kids
- 6.2. Market Analysis, Insights and Forecast - by Types
- 6.2.1. Personal Care Skin Protectants
- 6.2.2. Medical Skin Protectants
- 6.1. Market Analysis, Insights and Forecast - by Application
- 7. South America Skin Protectant Products Analysis, Insights and Forecast, 2019-2031
- 7.1. Market Analysis, Insights and Forecast - by Application
- 7.1.1. Adults
- 7.1.2. Baby & Kids
- 7.2. Market Analysis, Insights and Forecast - by Types
- 7.2.1. Personal Care Skin Protectants
- 7.2.2. Medical Skin Protectants
- 7.1. Market Analysis, Insights and Forecast - by Application
- 8. Europe Skin Protectant Products Analysis, Insights and Forecast, 2019-2031
- 8.1. Market Analysis, Insights and Forecast - by Application
- 8.1.1. Adults
- 8.1.2. Baby & Kids
- 8.2. Market Analysis, Insights and Forecast - by Types
- 8.2.1. Personal Care Skin Protectants
- 8.2.2. Medical Skin Protectants
- 8.1. Market Analysis, Insights and Forecast - by Application
- 9. Middle East & Africa Skin Protectant Products Analysis, Insights and Forecast, 2019-2031
- 9.1. Market Analysis, Insights and Forecast - by Application
- 9.1.1. Adults
- 9.1.2. Baby & Kids
- 9.2. Market Analysis, Insights and Forecast - by Types
- 9.2.1. Personal Care Skin Protectants
- 9.2.2. Medical Skin Protectants
- 9.1. Market Analysis, Insights and Forecast - by Application
- 10. Asia Pacific Skin Protectant Products Analysis, Insights and Forecast, 2019-2031
- 10.1. Market Analysis, Insights and Forecast - by Application
- 10.1.1. Adults
- 10.1.2. Baby & Kids
- 10.2. Market Analysis, Insights and Forecast - by Types
- 10.2.1. Personal Care Skin Protectants
- 10.2.2. Medical Skin Protectants
- 10.1. Market Analysis, Insights and Forecast - by Application
- 11. Competitive Analysis
- 11.1. Global Market Share Analysis 2024
- 11.2. Company Profiles
- 11.2.1 ConvaTec
- 11.2.1.1. Overview
- 11.2.1.2. Products
- 11.2.1.3. SWOT Analysis
- 11.2.1.4. Recent Developments
- 11.2.1.5. Financials (Based on Availability)
- 11.2.2 Medline Industries
- 11.2.2.1. Overview
- 11.2.2.2. Products
- 11.2.2.3. SWOT Analysis
- 11.2.2.4. Recent Developments
- 11.2.2.5. Financials (Based on Availability)
- 11.2.3 3M
- 11.2.3.1. Overview
- 11.2.3.2. Products
- 11.2.3.3. SWOT Analysis
- 11.2.3.4. Recent Developments
- 11.2.3.5. Financials (Based on Availability)
- 11.2.4 Pharmaceutical Specialties
- 11.2.4.1. Overview
- 11.2.4.2. Products
- 11.2.4.3. SWOT Analysis
- 11.2.4.4. Recent Developments
- 11.2.4.5. Financials (Based on Availability)
- 11.2.5 Johnson and Johnson
- 11.2.5.1. Overview
- 11.2.5.2. Products
- 11.2.5.3. SWOT Analysis
- 11.2.5.4. Recent Developments
- 11.2.5.5. Financials (Based on Availability)
- 11.2.6 Pfizer
- 11.2.6.1. Overview
- 11.2.6.2. Products
- 11.2.6.3. SWOT Analysis
- 11.2.6.4. Recent Developments
- 11.2.6.5. Financials (Based on Availability)
- 11.2.7 Unilever
- 11.2.7.1. Overview
- 11.2.7.2. Products
- 11.2.7.3. SWOT Analysis
- 11.2.7.4. Recent Developments
- 11.2.7.5. Financials (Based on Availability)
- 11.2.8 DermaRite Industries
- 11.2.8.1. Overview
- 11.2.8.2. Products
- 11.2.8.3. SWOT Analysis
- 11.2.8.4. Recent Developments
- 11.2.8.5. Financials (Based on Availability)
- 11.2.9 Smith & Nephew
- 11.2.9.1. Overview
- 11.2.9.2. Products
- 11.2.9.3. SWOT Analysis
- 11.2.9.4. Recent Developments
- 11.2.9.5. Financials (Based on Availability)
- 11.2.10 Essity
- 11.2.10.1. Overview
- 11.2.10.2. Products
- 11.2.10.3. SWOT Analysis
- 11.2.10.4. Recent Developments
- 11.2.10.5. Financials (Based on Availability)
- 11.2.11 Coloplast
- 11.2.11.1. Overview
- 11.2.11.2. Products
- 11.2.11.3. SWOT Analysis
- 11.2.11.4. Recent Developments
- 11.2.11.5. Financials (Based on Availability)
- 11.2.1 ConvaTec
List of Figures
- Figure 1: Global Skin Protectant Products Revenue Breakdown (million, %) by Region 2024 & 2032
- Figure 2: North America Skin Protectant Products Revenue (million), by Application 2024 & 2032
- Figure 3: North America Skin Protectant Products Revenue Share (%), by Application 2024 & 2032
- Figure 4: North America Skin Protectant Products Revenue (million), by Types 2024 & 2032
- Figure 5: North America Skin Protectant Products Revenue Share (%), by Types 2024 & 2032
- Figure 6: North America Skin Protectant Products Revenue (million), by Country 2024 & 2032
- Figure 7: North America Skin Protectant Products Revenue Share (%), by Country 2024 & 2032
- Figure 8: South America Skin Protectant Products Revenue (million), by Application 2024 & 2032
- Figure 9: South America Skin Protectant Products Revenue Share (%), by Application 2024 & 2032
- Figure 10: South America Skin Protectant Products Revenue (million), by Types 2024 & 2032
- Figure 11: South America Skin Protectant Products Revenue Share (%), by Types 2024 & 2032
- Figure 12: South America Skin Protectant Products Revenue (million), by Country 2024 & 2032
- Figure 13: South America Skin Protectant Products Revenue Share (%), by Country 2024 & 2032
- Figure 14: Europe Skin Protectant Products Revenue (million), by Application 2024 & 2032
- Figure 15: Europe Skin Protectant Products Revenue Share (%), by Application 2024 & 2032
- Figure 16: Europe Skin Protectant Products Revenue (million), by Types 2024 & 2032
- Figure 17: Europe Skin Protectant Products Revenue Share (%), by Types 2024 & 2032
- Figure 18: Europe Skin Protectant Products Revenue (million), by Country 2024 & 2032
- Figure 19: Europe Skin Protectant Products Revenue Share (%), by Country 2024 & 2032
- Figure 20: Middle East & Africa Skin Protectant Products Revenue (million), by Application 2024 & 2032
- Figure 21: Middle East & Africa Skin Protectant Products Revenue Share (%), by Application 2024 & 2032
- Figure 22: Middle East & Africa Skin Protectant Products Revenue (million), by Types 2024 & 2032
- Figure 23: Middle East & Africa Skin Protectant Products Revenue Share (%), by Types 2024 & 2032
- Figure 24: Middle East & Africa Skin Protectant Products Revenue (million), by Country 2024 & 2032
- Figure 25: Middle East & Africa Skin Protectant Products Revenue Share (%), by Country 2024 & 2032
- Figure 26: Asia Pacific Skin Protectant Products Revenue (million), by Application 2024 & 2032
- Figure 27: Asia Pacific Skin Protectant Products Revenue Share (%), by Application 2024 & 2032
- Figure 28: Asia Pacific Skin Protectant Products Revenue (million), by Types 2024 & 2032
- Figure 29: Asia Pacific Skin Protectant Products Revenue Share (%), by Types 2024 & 2032
- Figure 30: Asia Pacific Skin Protectant Products Revenue (million), by Country 2024 & 2032
- Figure 31: Asia Pacific Skin Protectant Products Revenue Share (%), by Country 2024 & 2032
List of Tables
- Table 1: Global Skin Protectant Products Revenue million Forecast, by Region 2019 & 2032
- Table 2: Global Skin Protectant Products Revenue million Forecast, by Application 2019 & 2032
- Table 3: Global Skin Protectant Products Revenue million Forecast, by Types 2019 & 2032
- Table 4: Global Skin Protectant Products Revenue million Forecast, by Region 2019 & 2032
- Table 5: Global Skin Protectant Products Revenue million Forecast, by Application 2019 & 2032
- Table 6: Global Skin Protectant Products Revenue million Forecast, by Types 2019 & 2032
- Table 7: Global Skin Protectant Products Revenue million Forecast, by Country 2019 & 2032
- Table 8: United States Skin Protectant Products Revenue (million) Forecast, by Application 2019 & 2032
- Table 9: Canada Skin Protectant Products Revenue (million) Forecast, by Application 2019 & 2032
- Table 10: Mexico Skin Protectant Products Revenue (million) Forecast, by Application 2019 & 2032
- Table 11: Global Skin Protectant Products Revenue million Forecast, by Application 2019 & 2032
- Table 12: Global Skin Protectant Products Revenue million Forecast, by Types 2019 & 2032
- Table 13: Global Skin Protectant Products Revenue million Forecast, by Country 2019 & 2032
- Table 14: Brazil Skin Protectant Products Revenue (million) Forecast, by Application 2019 & 2032
- Table 15: Argentina Skin Protectant Products Revenue (million) Forecast, by Application 2019 & 2032
- Table 16: Rest of South America Skin Protectant Products Revenue (million) Forecast, by Application 2019 & 2032
- Table 17: Global Skin Protectant Products Revenue million Forecast, by Application 2019 & 2032
- Table 18: Global Skin Protectant Products Revenue million Forecast, by Types 2019 & 2032
- Table 19: Global Skin Protectant Products Revenue million Forecast, by Country 2019 & 2032
- Table 20: United Kingdom Skin Protectant Products Revenue (million) Forecast, by Application 2019 & 2032
- Table 21: Germany Skin Protectant Products Revenue (million) Forecast, by Application 2019 & 2032
- Table 22: France Skin Protectant Products Revenue (million) Forecast, by Application 2019 & 2032
- Table 23: Italy Skin Protectant Products Revenue (million) Forecast, by Application 2019 & 2032
- Table 24: Spain Skin Protectant Products Revenue (million) Forecast, by Application 2019 & 2032
- Table 25: Russia Skin Protectant Products Revenue (million) Forecast, by Application 2019 & 2032
- Table 26: Benelux Skin Protectant Products Revenue (million) Forecast, by Application 2019 & 2032
- Table 27: Nordics Skin Protectant Products Revenue (million) Forecast, by Application 2019 & 2032
- Table 28: Rest of Europe Skin Protectant Products Revenue (million) Forecast, by Application 2019 & 2032
- Table 29: Global Skin Protectant Products Revenue million Forecast, by Application 2019 & 2032
- Table 30: Global Skin Protectant Products Revenue million Forecast, by Types 2019 & 2032
- Table 31: Global Skin Protectant Products Revenue million Forecast, by Country 2019 & 2032
- Table 32: Turkey Skin Protectant Products Revenue (million) Forecast, by Application 2019 & 2032
- Table 33: Israel Skin Protectant Products Revenue (million) Forecast, by Application 2019 & 2032
- Table 34: GCC Skin Protectant Products Revenue (million) Forecast, by Application 2019 & 2032
- Table 35: North Africa Skin Protectant Products Revenue (million) Forecast, by Application 2019 & 2032
- Table 36: South Africa Skin Protectant Products Revenue (million) Forecast, by Application 2019 & 2032
- Table 37: Rest of Middle East & Africa Skin Protectant Products Revenue (million) Forecast, by Application 2019 & 2032
- Table 38: Global Skin Protectant Products Revenue million Forecast, by Application 2019 & 2032
- Table 39: Global Skin Protectant Products Revenue million Forecast, by Types 2019 & 2032
- Table 40: Global Skin Protectant Products Revenue million Forecast, by Country 2019 & 2032
- Table 41: China Skin Protectant Products Revenue (million) Forecast, by Application 2019 & 2032
- Table 42: India Skin Protectant Products Revenue (million) Forecast, by Application 2019 & 2032
- Table 43: Japan Skin Protectant Products Revenue (million) Forecast, by Application 2019 & 2032
- Table 44: South Korea Skin Protectant Products Revenue (million) Forecast, by Application 2019 & 2032
- Table 45: ASEAN Skin Protectant Products Revenue (million) Forecast, by Application 2019 & 2032
- Table 46: Oceania Skin Protectant Products Revenue (million) Forecast, by Application 2019 & 2032
- Table 47: Rest of Asia Pacific Skin Protectant Products Revenue (million) Forecast, by Application 2019 & 2032
Frequently Asked Questions
1. What is the projected Compound Annual Growth Rate (CAGR) of the Skin Protectant Products?
The projected CAGR is approximately 6.6%.
2. Which companies are prominent players in the Skin Protectant Products?
Key companies in the market include ConvaTec, Medline Industries, 3M, Pharmaceutical Specialties, Johnson and Johnson, Pfizer, Unilever, DermaRite Industries, Smith & Nephew, Essity, Coloplast.
3. What are the main segments of the Skin Protectant Products?
The market segments include Application, Types.
4. Can you provide details about the market size?
The market size is estimated to be USD 610 million as of 2022.
5. What are some drivers contributing to market growth?
N/A
6. What are the notable trends driving market growth?
N/A
7. Are there any restraints impacting market growth?
N/A
8. Can you provide examples of recent developments in the market?
N/A
9. What pricing options are available for accessing the report?
Pricing options include single-user, multi-user, and enterprise licenses priced at USD 4900.00, USD 7350.00, and USD 9800.00 respectively.
10. Is the market size provided in terms of value or volume?
The market size is provided in terms of value, measured in million.
11. Are there any specific market keywords associated with the report?
Yes, the market keyword associated with the report is "Skin Protectant Products," which aids in identifying and referencing the specific market segment covered.
12. How do I determine which pricing option suits my needs best?
The pricing options vary based on user requirements and access needs. Individual users may opt for single-user licenses, while businesses requiring broader access may choose multi-user or enterprise licenses for cost-effective access to the report.
13. Are there any additional resources or data provided in the Skin Protectant Products report?
While the report offers comprehensive insights, it's advisable to review the specific contents or supplementary materials provided to ascertain if additional resources or data are available.
14. How can I stay updated on further developments or reports in the Skin Protectant Products?
To stay informed about further developments, trends, and reports in the Skin Protectant Products, consider subscribing to industry newsletters, following relevant companies and organizations, or regularly checking reputable industry news sources and publications.
Methodology
Step 1 - Identification of Relevant Samples Size from Population Database


Step 2 - Approaches for Defining Global Market Size (Value, Volume* & Price*)

Note*: In applicable scenarios
Step 3 - Data Sources
Primary Research
- Web Analytics
- Survey Reports
- Research Institute
- Latest Research Reports
- Opinion Leaders
Secondary Research
- Annual Reports
- White Paper
- Latest Press Release
- Industry Association
- Paid Database
- Investor Presentations

Step 4 - Data Triangulation
Involves using different sources of information in order to increase the validity of a study
These sources are likely to be stakeholders in a program - participants, other researchers, program staff, other community members, and so on.
Then we put all data in single framework & apply various statistical tools to find out the dynamic on the market.
During the analysis stage, feedback from the stakeholder groups would be compared to determine areas of agreement as well as areas of divergence


