

Key Insights
The Asia-Pacific (APAC) athletic footwear market, valued at approximately $194 billion in 2025, is projected to experience robust growth with a Compound Annual Growth Rate (CAGR) of 6.83% from 2025 to 2033. This expansion is driven by rising disposable incomes and increasing health consciousness, fostering greater investment in fitness and sports activities. The proliferation of online retail channels further enhances accessibility and sales. Running and sports shoes dominate market share, with the men's segment leading in volume. Key players like Nike, Adidas, and Asics leverage brand recognition and technological advancements, while emerging brands focus on niche markets. Potential restraints include fluctuating raw material prices and economic downturns, though the overall outlook remains positive.
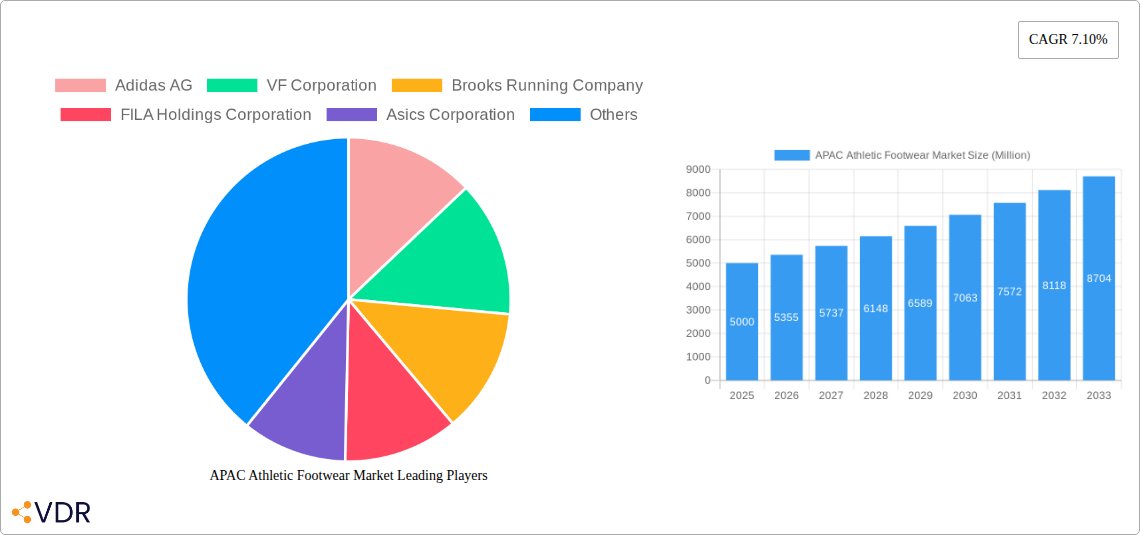
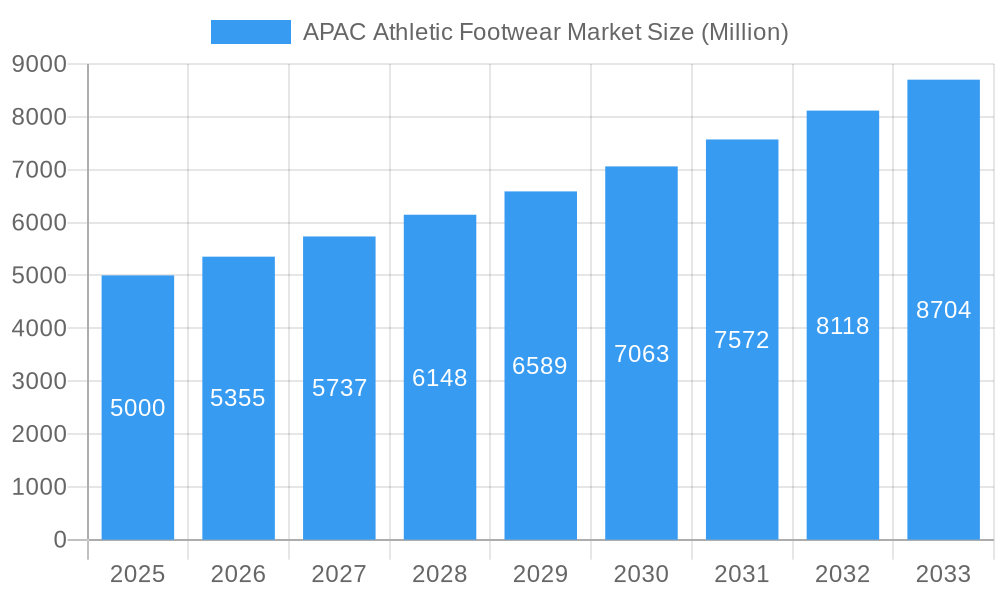
APAC Athletic Footwear Market Market Size (In Billion)
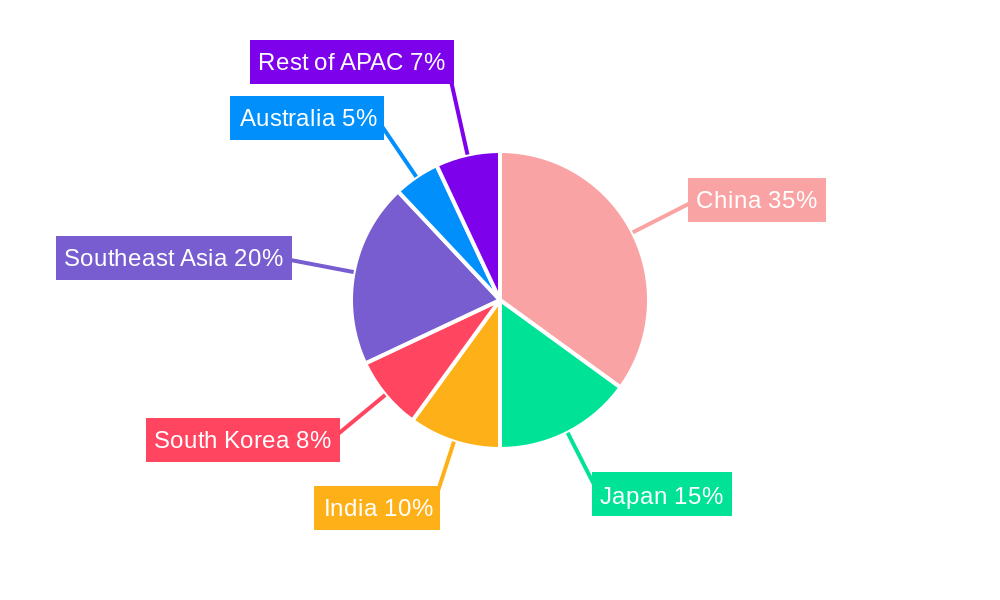
Geographically, China, Japan, and South Korea are significant contributors, with emerging markets showing high growth potential, particularly China with its large population and growing middle class. Tailored marketing strategies are essential due to diverse consumer preferences across APAC. The rise of e-commerce is reshaping distribution, presenting both opportunities and challenges. Continuous innovation in footwear technology, focusing on performance enhancement and sustainability, will be crucial for market expansion and differentiation in this dynamic landscape.
APAC Athletic Footwear Market Company Market Share
APAC Athletic Footwear Market: A Comprehensive Market Report (2019-2033)
This in-depth report provides a comprehensive analysis of the Asia-Pacific (APAC) athletic footwear market, encompassing market dynamics, growth trends, leading segments, and key players. With a study period spanning 2019-2033, a base year of 2025, and a forecast period of 2025-2033, this report offers invaluable insights for industry professionals, investors, and strategic decision-makers. The market is segmented by distribution channel (Sports and Athletic Goods Stores, Supermarkets/Hypermarkets, Online Retail Stores, Other Distribution Channels), product type (Running Shoes, Sports Shoes, Trekking/Hiking Shoes, Other Product Types), and end-user (Men, Women, Children). The total market size is predicted to reach xx Million units by 2033.
APAC Athletic Footwear Market Dynamics & Structure
The APAC athletic footwear market is characterized by a dynamic interplay of factors influencing its structure and growth trajectory. Market concentration is moderately high, with a few dominant players commanding significant market share. However, the presence of numerous regional and niche brands fosters competition. Technological innovation, particularly in materials science (e.g., lightweight foams, recycled materials) and performance tracking, is a key driver. Regulatory frameworks concerning product safety and environmental standards play a significant role. The market also faces competitive pressure from substitutes such as casual footwear.
- Market Concentration: Nike and Adidas hold approximately xx% combined market share in 2025.
- Technological Innovation: Continuous advancements in cushioning technology, breathability, and design are driving premiumization.
- Regulatory Framework: Stringent quality and safety standards influence manufacturing and distribution.
- Competitive Substitutes: Casual footwear and other recreational footwear exert competitive pressure.
- End-User Demographics: Growing middle class and rising health consciousness fuel demand, particularly among young adults.
- M&A Activity: The number of M&A deals in the APAC athletic footwear market averaged xx per year between 2019 and 2024.
APAC Athletic Footwear Market Growth Trends & Insights
The APAC athletic footwear market has exhibited robust growth over the historical period (2019-2024), driven by factors such as increasing disposable incomes, rising health awareness, and the popularity of fitness activities. The market is expected to continue its expansion during the forecast period (2025-2033), albeit at a moderated pace compared to previous years. Technological disruptions, such as the introduction of smart shoes and personalized footwear solutions, are reshaping consumer preferences and driving innovation. The shift towards online retail channels is significantly impacting distribution patterns. Consumer behavior is evolving, with a focus on sustainability and ethical sourcing becoming increasingly important. The Compound Annual Growth Rate (CAGR) is projected to be xx% from 2025 to 2033, with market penetration expected to reach xx% by 2033. Specific growth drivers are analyzed by region.
Dominant Regions, Countries, or Segments in APAC Athletic Footwear Market
China and India are the dominant markets within the APAC region, contributing significantly to overall market growth. The online retail channel is experiencing rapid expansion, surpassing traditional retail channels in several countries. Running shoes constitute the largest product type segment, followed by sports shoes. Men dominate the end-user segment, although the women's segment is witnessing substantial growth.
- China & India: Large population base, rising disposable incomes, and increasing participation in sports and fitness activities.
- Online Retail: Convenience, wider selection, and competitive pricing are driving online sales.
- Running Shoes: High demand driven by the popularity of marathons and running events.
- Men's Segment: Historically dominant, but the women's segment is experiencing rapid growth.
APAC Athletic Footwear Market Product Landscape
The APAC athletic footwear market showcases a diverse product landscape, characterized by continuous innovation in materials, design, and technology. Manufacturers are focusing on enhancing performance features such as cushioning, stability, and breathability. Lightweight and sustainable materials are gaining traction. Unique selling propositions often include advanced cushioning systems, personalized fitting technologies, and integrated performance tracking capabilities. Technological advancements are primarily focused on enhancing comfort, performance, and sustainability.
Key Drivers, Barriers & Challenges in APAC Athletic Footwear Market
Key Drivers:
- Rising Disposable Incomes: Increased purchasing power fuels demand for higher-quality athletic footwear.
- Growing Health Awareness: Emphasis on fitness and well-being drives consumption.
- Technological Advancements: Innovations in materials and design attract consumers.
Challenges:
- Supply Chain Disruptions: Global events can impact manufacturing and distribution.
- Counterfeit Products: Illegitimate products undercut legitimate brands.
- Intense Competition: Established brands and new entrants compete fiercely.
Emerging Opportunities in APAP Athletic Footwear Market
- Untapped Rural Markets: Expanding reach to less-penetrated regions offers significant potential.
- Smart Footwear: Integration of technology into athletic footwear presents a lucrative opportunity.
- Sustainable Materials: Demand for eco-friendly materials is growing rapidly.
Growth Accelerators in the APAC Athletic Footwear Market Industry
Strategic partnerships, collaborations, and investments in research and development are crucial growth accelerators. Expanding distribution channels, particularly in e-commerce, plays a pivotal role. Technological breakthroughs in materials and manufacturing processes offer substantial opportunities for innovation and differentiation. Market expansion strategies targeting new demographics and regions are essential for sustained growth.
Key Players Shaping the APAC Athletic Footwear Market Market
Notable Milestones in APAC Athletic Footwear Market Sector
- June 2022: Under Armour Inc. launched its 'HOVR Machina 3' athletic shoes in India.
- January 2022: Adidas AG launched Ultraboost ULTRA4D shoes in India.
- February 2021: Puma launched five new running shoes featuring its Nitro foam technology.
In-Depth APAC Athletic Footwear Market Outlook
The APAC athletic footwear market is poised for sustained growth, driven by increasing health consciousness, technological advancements, and expanding e-commerce penetration. Strategic investments in research and development, coupled with targeted marketing campaigns, will be crucial for success. Companies focusing on sustainability and ethical sourcing will gain a competitive edge. The market presents significant opportunities for both established players and new entrants, particularly those focusing on niche segments and innovative product offerings.
APAC Athletic Footwear Market Segmentation
-
1. Type
- 1.1. Running Shoes
- 1.2. Sports Shoes
- 1.3. Trekking/Hiking Shoes
- 1.4. Other Product Types
-
2. End User
- 2.1. Men
- 2.2. Women
- 2.3. Children
-
3. Distrubution Channel
- 3.1. Sports and Athletic Goods Stores
- 3.2. Supermarkets/Hypermarkets
- 3.3. Online Retail Stores
- 3.4. Other Distribution Channels
-
4. Geography
- 4.1. China
- 4.2. Japan
- 4.3. India
- 4.4. Australia
- 4.5. Rest of Asia-Pacific
APAC Athletic Footwear Market Segmentation By Geography
- 1. China
- 2. Japan
- 3. India
- 4. Australia
- 5. Rest of Asia Pacific
APAC Athletic Footwear Market Regional Market Share
Geographic Coverage of APAC Athletic Footwear Market
APAC Athletic Footwear Market REPORT HIGHLIGHTS
| Aspects | Details |
|---|---|
| Study Period | 2020-2034 |
| Base Year | 2025 |
| Estimated Year | 2026 |
| Forecast Period | 2026-2034 |
| Historical Period | 2020-2025 |
| Growth Rate | CAGR of 6.83% from 2020-2034 |
| Segmentation |
|
Table of Contents
- 1. Introduction
- 1.1. Research Scope
- 1.2. Market Segmentation
- 1.3. Research Objective
- 1.4. Definitions and Assumptions
- 2. Executive Summary
- 2.1. Market Snapshot
- 3. Market Dynamics
- 3.1. Market Drivers
- 3.2. Market Restrains
- 3.3. Market Trends
- 3.4. Market Opportunities
- 4. Market Factor Analysis
- 4.1. Porters Five Forces
- 4.1.1. Bargaining Power of Suppliers
- 4.1.2. Bargaining Power of Buyers
- 4.1.3. Threat of New Entrants
- 4.1.4. Threat of Substitutes
- 4.1.5. Competitive Rivalry
- 4.2. PESTEL analysis
- 4.3. BCG Analysis
- 4.3.1. Stars (High Growth, High Market Share)
- 4.3.2. Cash Cows (Low Growth, High Market Share)
- 4.3.3. Question Mark (High Growth, Low Market Share)
- 4.3.4. Dogs (Low Growth, Low Market Share)
- 4.4. Ansoff Matrix Analysis
- 4.5. Supply Chain Analysis
- 4.6. Regulatory Landscape
- 4.7. Current Market Potential and Opportunity Assessment (TAM–SAM–SOM Framework)
- 4.8. VDR Analyst Note
- 4.1. Porters Five Forces
- 5. Market Analysis, Insights and Forecast 2021-2033
- 5.1. Market Analysis, Insights and Forecast - by Type
- 5.1.1. Running Shoes
- 5.1.2. Sports Shoes
- 5.1.3. Trekking/Hiking Shoes
- 5.1.4. Other Product Types
- 5.2. Market Analysis, Insights and Forecast - by End User
- 5.2.1. Men
- 5.2.2. Women
- 5.2.3. Children
- 5.3. Market Analysis, Insights and Forecast - by Distrubution Channel
- 5.3.1. Sports and Athletic Goods Stores
- 5.3.2. Supermarkets/Hypermarkets
- 5.3.3. Online Retail Stores
- 5.3.4. Other Distribution Channels
- 5.4. Market Analysis, Insights and Forecast - by Geography
- 5.4.1. China
- 5.4.2. Japan
- 5.4.3. India
- 5.4.4. Australia
- 5.4.5. Rest of Asia-Pacific
- 5.5. Market Analysis, Insights and Forecast - by Region
- 5.5.1. China
- 5.5.2. Japan
- 5.5.3. India
- 5.5.4. Australia
- 5.5.5. Rest of Asia Pacific
- 5.1. Market Analysis, Insights and Forecast - by Type
- 6. Global APAC Athletic Footwear Market Analysis, Insights and Forecast, 2021-2033
- 6.1. Market Analysis, Insights and Forecast - by Type
- 6.1.1. Running Shoes
- 6.1.2. Sports Shoes
- 6.1.3. Trekking/Hiking Shoes
- 6.1.4. Other Product Types
- 6.2. Market Analysis, Insights and Forecast - by End User
- 6.2.1. Men
- 6.2.2. Women
- 6.2.3. Children
- 6.3. Market Analysis, Insights and Forecast - by Distrubution Channel
- 6.3.1. Sports and Athletic Goods Stores
- 6.3.2. Supermarkets/Hypermarkets
- 6.3.3. Online Retail Stores
- 6.3.4. Other Distribution Channels
- 6.4. Market Analysis, Insights and Forecast - by Geography
- 6.4.1. China
- 6.4.2. Japan
- 6.4.3. India
- 6.4.4. Australia
- 6.4.5. Rest of Asia-Pacific
- 6.1. Market Analysis, Insights and Forecast - by Type
- 7. China APAC Athletic Footwear Market Analysis, Insights and Forecast, 2021-2033
- 7.1. Market Analysis, Insights and Forecast - by Type
- 7.1.1. Running Shoes
- 7.1.2. Sports Shoes
- 7.1.3. Trekking/Hiking Shoes
- 7.1.4. Other Product Types
- 7.2. Market Analysis, Insights and Forecast - by End User
- 7.2.1. Men
- 7.2.2. Women
- 7.2.3. Children
- 7.3. Market Analysis, Insights and Forecast - by Distrubution Channel
- 7.3.1. Sports and Athletic Goods Stores
- 7.3.2. Supermarkets/Hypermarkets
- 7.3.3. Online Retail Stores
- 7.3.4. Other Distribution Channels
- 7.4. Market Analysis, Insights and Forecast - by Geography
- 7.4.1. China
- 7.4.2. Japan
- 7.4.3. India
- 7.4.4. Australia
- 7.4.5. Rest of Asia-Pacific
- 7.1. Market Analysis, Insights and Forecast - by Type
- 8. Japan APAC Athletic Footwear Market Analysis, Insights and Forecast, 2021-2033
- 8.1. Market Analysis, Insights and Forecast - by Type
- 8.1.1. Running Shoes
- 8.1.2. Sports Shoes
- 8.1.3. Trekking/Hiking Shoes
- 8.1.4. Other Product Types
- 8.2. Market Analysis, Insights and Forecast - by End User
- 8.2.1. Men
- 8.2.2. Women
- 8.2.3. Children
- 8.3. Market Analysis, Insights and Forecast - by Distrubution Channel
- 8.3.1. Sports and Athletic Goods Stores
- 8.3.2. Supermarkets/Hypermarkets
- 8.3.3. Online Retail Stores
- 8.3.4. Other Distribution Channels
- 8.4. Market Analysis, Insights and Forecast - by Geography
- 8.4.1. China
- 8.4.2. Japan
- 8.4.3. India
- 8.4.4. Australia
- 8.4.5. Rest of Asia-Pacific
- 8.1. Market Analysis, Insights and Forecast - by Type
- 9. India APAC Athletic Footwear Market Analysis, Insights and Forecast, 2021-2033
- 9.1. Market Analysis, Insights and Forecast - by Type
- 9.1.1. Running Shoes
- 9.1.2. Sports Shoes
- 9.1.3. Trekking/Hiking Shoes
- 9.1.4. Other Product Types
- 9.2. Market Analysis, Insights and Forecast - by End User
- 9.2.1. Men
- 9.2.2. Women
- 9.2.3. Children
- 9.3. Market Analysis, Insights and Forecast - by Distrubution Channel
- 9.3.1. Sports and Athletic Goods Stores
- 9.3.2. Supermarkets/Hypermarkets
- 9.3.3. Online Retail Stores
- 9.3.4. Other Distribution Channels
- 9.4. Market Analysis, Insights and Forecast - by Geography
- 9.4.1. China
- 9.4.2. Japan
- 9.4.3. India
- 9.4.4. Australia
- 9.4.5. Rest of Asia-Pacific
- 9.1. Market Analysis, Insights and Forecast - by Type
- 10. Australia APAC Athletic Footwear Market Analysis, Insights and Forecast, 2021-2033
- 10.1. Market Analysis, Insights and Forecast - by Type
- 10.1.1. Running Shoes
- 10.1.2. Sports Shoes
- 10.1.3. Trekking/Hiking Shoes
- 10.1.4. Other Product Types
- 10.2. Market Analysis, Insights and Forecast - by End User
- 10.2.1. Men
- 10.2.2. Women
- 10.2.3. Children
- 10.3. Market Analysis, Insights and Forecast - by Distrubution Channel
- 10.3.1. Sports and Athletic Goods Stores
- 10.3.2. Supermarkets/Hypermarkets
- 10.3.3. Online Retail Stores
- 10.3.4. Other Distribution Channels
- 10.4. Market Analysis, Insights and Forecast - by Geography
- 10.4.1. China
- 10.4.2. Japan
- 10.4.3. India
- 10.4.4. Australia
- 10.4.5. Rest of Asia-Pacific
- 10.1. Market Analysis, Insights and Forecast - by Type
- 11. Rest of Asia Pacific APAC Athletic Footwear Market Analysis, Insights and Forecast, 2021-2033
- 11.1. Market Analysis, Insights and Forecast - by Type
- 11.1.1. Running Shoes
- 11.1.2. Sports Shoes
- 11.1.3. Trekking/Hiking Shoes
- 11.1.4. Other Product Types
- 11.2. Market Analysis, Insights and Forecast - by End User
- 11.2.1. Men
- 11.2.2. Women
- 11.2.3. Children
- 11.3. Market Analysis, Insights and Forecast - by Distrubution Channel
- 11.3.1. Sports and Athletic Goods Stores
- 11.3.2. Supermarkets/Hypermarkets
- 11.3.3. Online Retail Stores
- 11.3.4. Other Distribution Channels
- 11.4. Market Analysis, Insights and Forecast - by Geography
- 11.4.1. China
- 11.4.2. Japan
- 11.4.3. India
- 11.4.4. Australia
- 11.4.5. Rest of Asia-Pacific
- 11.1. Market Analysis, Insights and Forecast - by Type
- 12. Competitive Analysis
- 12.1. Company Profiles
- 12.1.1 Adidas AG
- 12.1.1.1. Company Overview
- 12.1.1.2. Products
- 12.1.1.3. Company Financials
- 12.1.1.4. SWOT Analysis
- 12.1.2 VF Corporation
- 12.1.2.1. Company Overview
- 12.1.2.2. Products
- 12.1.2.3. Company Financials
- 12.1.2.4. SWOT Analysis
- 12.1.3 Brooks Running Company
- 12.1.3.1. Company Overview
- 12.1.3.2. Products
- 12.1.3.3. Company Financials
- 12.1.3.4. SWOT Analysis
- 12.1.4 FILA Holdings Corporation
- 12.1.4.1. Company Overview
- 12.1.4.2. Products
- 12.1.4.3. Company Financials
- 12.1.4.4. SWOT Analysis
- 12.1.5 Asics Corporation
- 12.1.5.1. Company Overview
- 12.1.5.2. Products
- 12.1.5.3. Company Financials
- 12.1.5.4. SWOT Analysis
- 12.1.6 Puma SE
- 12.1.6.1. Company Overview
- 12.1.6.2. Products
- 12.1.6.3. Company Financials
- 12.1.6.4. SWOT Analysis
- 12.1.7 Under Armour Inc
- 12.1.7.1. Company Overview
- 12.1.7.2. Products
- 12.1.7.3. Company Financials
- 12.1.7.4. SWOT Analysis
- 12.1.8 Nike Inc
- 12.1.8.1. Company Overview
- 12.1.8.2. Products
- 12.1.8.3. Company Financials
- 12.1.8.4. SWOT Analysis
- 12.1.9 Li-Ning Company Limited
- 12.1.9.1. Company Overview
- 12.1.9.2. Products
- 12.1.9.3. Company Financials
- 12.1.9.4. SWOT Analysis
- 12.1.10 New Balance Athletics Inc
- 12.1.10.1. Company Overview
- 12.1.10.2. Products
- 12.1.10.3. Company Financials
- 12.1.10.4. SWOT Analysis
- 12.1.1 Adidas AG
- 12.2. Market Entropy
- 12.2.1 Company's Key Areas Served
- 12.2.2 Recent Developments
- 12.3. Company Market Share Analysis 2025
- 12.3.1 Top 5 Companies Market Share Analysis
- 12.3.2 Top 3 Companies Market Share Analysis
- 12.4. List of Potential Customers
- 13. Research Methodology
List of Figures
- Figure 1: Global APAC Athletic Footwear Market Revenue Breakdown (billion, %) by Region 2025 & 2033
- Figure 2: Global APAC Athletic Footwear Market Volume Breakdown (K Units, %) by Region 2025 & 2033
- Figure 3: China APAC Athletic Footwear Market Revenue (billion), by Type 2025 & 2033
- Figure 4: China APAC Athletic Footwear Market Volume (K Units), by Type 2025 & 2033
- Figure 5: China APAC Athletic Footwear Market Revenue Share (%), by Type 2025 & 2033
- Figure 6: China APAC Athletic Footwear Market Volume Share (%), by Type 2025 & 2033
- Figure 7: China APAC Athletic Footwear Market Revenue (billion), by End User 2025 & 2033
- Figure 8: China APAC Athletic Footwear Market Volume (K Units), by End User 2025 & 2033
- Figure 9: China APAC Athletic Footwear Market Revenue Share (%), by End User 2025 & 2033
- Figure 10: China APAC Athletic Footwear Market Volume Share (%), by End User 2025 & 2033
- Figure 11: China APAC Athletic Footwear Market Revenue (billion), by Distrubution Channel 2025 & 2033
- Figure 12: China APAC Athletic Footwear Market Volume (K Units), by Distrubution Channel 2025 & 2033
- Figure 13: China APAC Athletic Footwear Market Revenue Share (%), by Distrubution Channel 2025 & 2033
- Figure 14: China APAC Athletic Footwear Market Volume Share (%), by Distrubution Channel 2025 & 2033
- Figure 15: China APAC Athletic Footwear Market Revenue (billion), by Geography 2025 & 2033
- Figure 16: China APAC Athletic Footwear Market Volume (K Units), by Geography 2025 & 2033
- Figure 17: China APAC Athletic Footwear Market Revenue Share (%), by Geography 2025 & 2033
- Figure 18: China APAC Athletic Footwear Market Volume Share (%), by Geography 2025 & 2033
- Figure 19: China APAC Athletic Footwear Market Revenue (billion), by Country 2025 & 2033
- Figure 20: China APAC Athletic Footwear Market Volume (K Units), by Country 2025 & 2033
- Figure 21: China APAC Athletic Footwear Market Revenue Share (%), by Country 2025 & 2033
- Figure 22: China APAC Athletic Footwear Market Volume Share (%), by Country 2025 & 2033
- Figure 23: Japan APAC Athletic Footwear Market Revenue (billion), by Type 2025 & 2033
- Figure 24: Japan APAC Athletic Footwear Market Volume (K Units), by Type 2025 & 2033
- Figure 25: Japan APAC Athletic Footwear Market Revenue Share (%), by Type 2025 & 2033
- Figure 26: Japan APAC Athletic Footwear Market Volume Share (%), by Type 2025 & 2033
- Figure 27: Japan APAC Athletic Footwear Market Revenue (billion), by End User 2025 & 2033
- Figure 28: Japan APAC Athletic Footwear Market Volume (K Units), by End User 2025 & 2033
- Figure 29: Japan APAC Athletic Footwear Market Revenue Share (%), by End User 2025 & 2033
- Figure 30: Japan APAC Athletic Footwear Market Volume Share (%), by End User 2025 & 2033
- Figure 31: Japan APAC Athletic Footwear Market Revenue (billion), by Distrubution Channel 2025 & 2033
- Figure 32: Japan APAC Athletic Footwear Market Volume (K Units), by Distrubution Channel 2025 & 2033
- Figure 33: Japan APAC Athletic Footwear Market Revenue Share (%), by Distrubution Channel 2025 & 2033
- Figure 34: Japan APAC Athletic Footwear Market Volume Share (%), by Distrubution Channel 2025 & 2033
- Figure 35: Japan APAC Athletic Footwear Market Revenue (billion), by Geography 2025 & 2033
- Figure 36: Japan APAC Athletic Footwear Market Volume (K Units), by Geography 2025 & 2033
- Figure 37: Japan APAC Athletic Footwear Market Revenue Share (%), by Geography 2025 & 2033
- Figure 38: Japan APAC Athletic Footwear Market Volume Share (%), by Geography 2025 & 2033
- Figure 39: Japan APAC Athletic Footwear Market Revenue (billion), by Country 2025 & 2033
- Figure 40: Japan APAC Athletic Footwear Market Volume (K Units), by Country 2025 & 2033
- Figure 41: Japan APAC Athletic Footwear Market Revenue Share (%), by Country 2025 & 2033
- Figure 42: Japan APAC Athletic Footwear Market Volume Share (%), by Country 2025 & 2033
- Figure 43: India APAC Athletic Footwear Market Revenue (billion), by Type 2025 & 2033
- Figure 44: India APAC Athletic Footwear Market Volume (K Units), by Type 2025 & 2033
- Figure 45: India APAC Athletic Footwear Market Revenue Share (%), by Type 2025 & 2033
- Figure 46: India APAC Athletic Footwear Market Volume Share (%), by Type 2025 & 2033
- Figure 47: India APAC Athletic Footwear Market Revenue (billion), by End User 2025 & 2033
- Figure 48: India APAC Athletic Footwear Market Volume (K Units), by End User 2025 & 2033
- Figure 49: India APAC Athletic Footwear Market Revenue Share (%), by End User 2025 & 2033
- Figure 50: India APAC Athletic Footwear Market Volume Share (%), by End User 2025 & 2033
- Figure 51: India APAC Athletic Footwear Market Revenue (billion), by Distrubution Channel 2025 & 2033
- Figure 52: India APAC Athletic Footwear Market Volume (K Units), by Distrubution Channel 2025 & 2033
- Figure 53: India APAC Athletic Footwear Market Revenue Share (%), by Distrubution Channel 2025 & 2033
- Figure 54: India APAC Athletic Footwear Market Volume Share (%), by Distrubution Channel 2025 & 2033
- Figure 55: India APAC Athletic Footwear Market Revenue (billion), by Geography 2025 & 2033
- Figure 56: India APAC Athletic Footwear Market Volume (K Units), by Geography 2025 & 2033
- Figure 57: India APAC Athletic Footwear Market Revenue Share (%), by Geography 2025 & 2033
- Figure 58: India APAC Athletic Footwear Market Volume Share (%), by Geography 2025 & 2033
- Figure 59: India APAC Athletic Footwear Market Revenue (billion), by Country 2025 & 2033
- Figure 60: India APAC Athletic Footwear Market Volume (K Units), by Country 2025 & 2033
- Figure 61: India APAC Athletic Footwear Market Revenue Share (%), by Country 2025 & 2033
- Figure 62: India APAC Athletic Footwear Market Volume Share (%), by Country 2025 & 2033
- Figure 63: Australia APAC Athletic Footwear Market Revenue (billion), by Type 2025 & 2033
- Figure 64: Australia APAC Athletic Footwear Market Volume (K Units), by Type 2025 & 2033
- Figure 65: Australia APAC Athletic Footwear Market Revenue Share (%), by Type 2025 & 2033
- Figure 66: Australia APAC Athletic Footwear Market Volume Share (%), by Type 2025 & 2033
- Figure 67: Australia APAC Athletic Footwear Market Revenue (billion), by End User 2025 & 2033
- Figure 68: Australia APAC Athletic Footwear Market Volume (K Units), by End User 2025 & 2033
- Figure 69: Australia APAC Athletic Footwear Market Revenue Share (%), by End User 2025 & 2033
- Figure 70: Australia APAC Athletic Footwear Market Volume Share (%), by End User 2025 & 2033
- Figure 71: Australia APAC Athletic Footwear Market Revenue (billion), by Distrubution Channel 2025 & 2033
- Figure 72: Australia APAC Athletic Footwear Market Volume (K Units), by Distrubution Channel 2025 & 2033
- Figure 73: Australia APAC Athletic Footwear Market Revenue Share (%), by Distrubution Channel 2025 & 2033
- Figure 74: Australia APAC Athletic Footwear Market Volume Share (%), by Distrubution Channel 2025 & 2033
- Figure 75: Australia APAC Athletic Footwear Market Revenue (billion), by Geography 2025 & 2033
- Figure 76: Australia APAC Athletic Footwear Market Volume (K Units), by Geography 2025 & 2033
- Figure 77: Australia APAC Athletic Footwear Market Revenue Share (%), by Geography 2025 & 2033
- Figure 78: Australia APAC Athletic Footwear Market Volume Share (%), by Geography 2025 & 2033
- Figure 79: Australia APAC Athletic Footwear Market Revenue (billion), by Country 2025 & 2033
- Figure 80: Australia APAC Athletic Footwear Market Volume (K Units), by Country 2025 & 2033
- Figure 81: Australia APAC Athletic Footwear Market Revenue Share (%), by Country 2025 & 2033
- Figure 82: Australia APAC Athletic Footwear Market Volume Share (%), by Country 2025 & 2033
- Figure 83: Rest of Asia Pacific APAC Athletic Footwear Market Revenue (billion), by Type 2025 & 2033
- Figure 84: Rest of Asia Pacific APAC Athletic Footwear Market Volume (K Units), by Type 2025 & 2033
- Figure 85: Rest of Asia Pacific APAC Athletic Footwear Market Revenue Share (%), by Type 2025 & 2033
- Figure 86: Rest of Asia Pacific APAC Athletic Footwear Market Volume Share (%), by Type 2025 & 2033
- Figure 87: Rest of Asia Pacific APAC Athletic Footwear Market Revenue (billion), by End User 2025 & 2033
- Figure 88: Rest of Asia Pacific APAC Athletic Footwear Market Volume (K Units), by End User 2025 & 2033
- Figure 89: Rest of Asia Pacific APAC Athletic Footwear Market Revenue Share (%), by End User 2025 & 2033
- Figure 90: Rest of Asia Pacific APAC Athletic Footwear Market Volume Share (%), by End User 2025 & 2033
- Figure 91: Rest of Asia Pacific APAC Athletic Footwear Market Revenue (billion), by Distrubution Channel 2025 & 2033
- Figure 92: Rest of Asia Pacific APAC Athletic Footwear Market Volume (K Units), by Distrubution Channel 2025 & 2033
- Figure 93: Rest of Asia Pacific APAC Athletic Footwear Market Revenue Share (%), by Distrubution Channel 2025 & 2033
- Figure 94: Rest of Asia Pacific APAC Athletic Footwear Market Volume Share (%), by Distrubution Channel 2025 & 2033
- Figure 95: Rest of Asia Pacific APAC Athletic Footwear Market Revenue (billion), by Geography 2025 & 2033
- Figure 96: Rest of Asia Pacific APAC Athletic Footwear Market Volume (K Units), by Geography 2025 & 2033
- Figure 97: Rest of Asia Pacific APAC Athletic Footwear Market Revenue Share (%), by Geography 2025 & 2033
- Figure 98: Rest of Asia Pacific APAC Athletic Footwear Market Volume Share (%), by Geography 2025 & 2033
- Figure 99: Rest of Asia Pacific APAC Athletic Footwear Market Revenue (billion), by Country 2025 & 2033
- Figure 100: Rest of Asia Pacific APAC Athletic Footwear Market Volume (K Units), by Country 2025 & 2033
- Figure 101: Rest of Asia Pacific APAC Athletic Footwear Market Revenue Share (%), by Country 2025 & 2033
- Figure 102: Rest of Asia Pacific APAC Athletic Footwear Market Volume Share (%), by Country 2025 & 2033
List of Tables
- Table 1: Global APAC Athletic Footwear Market Revenue billion Forecast, by Type 2020 & 2033
- Table 2: Global APAC Athletic Footwear Market Volume K Units Forecast, by Type 2020 & 2033
- Table 3: Global APAC Athletic Footwear Market Revenue billion Forecast, by End User 2020 & 2033
- Table 4: Global APAC Athletic Footwear Market Volume K Units Forecast, by End User 2020 & 2033
- Table 5: Global APAC Athletic Footwear Market Revenue billion Forecast, by Distrubution Channel 2020 & 2033
- Table 6: Global APAC Athletic Footwear Market Volume K Units Forecast, by Distrubution Channel 2020 & 2033
- Table 7: Global APAC Athletic Footwear Market Revenue billion Forecast, by Geography 2020 & 2033
- Table 8: Global APAC Athletic Footwear Market Volume K Units Forecast, by Geography 2020 & 2033
- Table 9: Global APAC Athletic Footwear Market Revenue billion Forecast, by Region 2020 & 2033
- Table 10: Global APAC Athletic Footwear Market Volume K Units Forecast, by Region 2020 & 2033
- Table 11: Global APAC Athletic Footwear Market Revenue billion Forecast, by Type 2020 & 2033
- Table 12: Global APAC Athletic Footwear Market Volume K Units Forecast, by Type 2020 & 2033
- Table 13: Global APAC Athletic Footwear Market Revenue billion Forecast, by End User 2020 & 2033
- Table 14: Global APAC Athletic Footwear Market Volume K Units Forecast, by End User 2020 & 2033
- Table 15: Global APAC Athletic Footwear Market Revenue billion Forecast, by Distrubution Channel 2020 & 2033
- Table 16: Global APAC Athletic Footwear Market Volume K Units Forecast, by Distrubution Channel 2020 & 2033
- Table 17: Global APAC Athletic Footwear Market Revenue billion Forecast, by Geography 2020 & 2033
- Table 18: Global APAC Athletic Footwear Market Volume K Units Forecast, by Geography 2020 & 2033
- Table 19: Global APAC Athletic Footwear Market Revenue billion Forecast, by Country 2020 & 2033
- Table 20: Global APAC Athletic Footwear Market Volume K Units Forecast, by Country 2020 & 2033
- Table 21: Global APAC Athletic Footwear Market Revenue billion Forecast, by Type 2020 & 2033
- Table 22: Global APAC Athletic Footwear Market Volume K Units Forecast, by Type 2020 & 2033
- Table 23: Global APAC Athletic Footwear Market Revenue billion Forecast, by End User 2020 & 2033
- Table 24: Global APAC Athletic Footwear Market Volume K Units Forecast, by End User 2020 & 2033
- Table 25: Global APAC Athletic Footwear Market Revenue billion Forecast, by Distrubution Channel 2020 & 2033
- Table 26: Global APAC Athletic Footwear Market Volume K Units Forecast, by Distrubution Channel 2020 & 2033
- Table 27: Global APAC Athletic Footwear Market Revenue billion Forecast, by Geography 2020 & 2033
- Table 28: Global APAC Athletic Footwear Market Volume K Units Forecast, by Geography 2020 & 2033
- Table 29: Global APAC Athletic Footwear Market Revenue billion Forecast, by Country 2020 & 2033
- Table 30: Global APAC Athletic Footwear Market Volume K Units Forecast, by Country 2020 & 2033
- Table 31: Global APAC Athletic Footwear Market Revenue billion Forecast, by Type 2020 & 2033
- Table 32: Global APAC Athletic Footwear Market Volume K Units Forecast, by Type 2020 & 2033
- Table 33: Global APAC Athletic Footwear Market Revenue billion Forecast, by End User 2020 & 2033
- Table 34: Global APAC Athletic Footwear Market Volume K Units Forecast, by End User 2020 & 2033
- Table 35: Global APAC Athletic Footwear Market Revenue billion Forecast, by Distrubution Channel 2020 & 2033
- Table 36: Global APAC Athletic Footwear Market Volume K Units Forecast, by Distrubution Channel 2020 & 2033
- Table 37: Global APAC Athletic Footwear Market Revenue billion Forecast, by Geography 2020 & 2033
- Table 38: Global APAC Athletic Footwear Market Volume K Units Forecast, by Geography 2020 & 2033
- Table 39: Global APAC Athletic Footwear Market Revenue billion Forecast, by Country 2020 & 2033
- Table 40: Global APAC Athletic Footwear Market Volume K Units Forecast, by Country 2020 & 2033
- Table 41: Global APAC Athletic Footwear Market Revenue billion Forecast, by Type 2020 & 2033
- Table 42: Global APAC Athletic Footwear Market Volume K Units Forecast, by Type 2020 & 2033
- Table 43: Global APAC Athletic Footwear Market Revenue billion Forecast, by End User 2020 & 2033
- Table 44: Global APAC Athletic Footwear Market Volume K Units Forecast, by End User 2020 & 2033
- Table 45: Global APAC Athletic Footwear Market Revenue billion Forecast, by Distrubution Channel 2020 & 2033
- Table 46: Global APAC Athletic Footwear Market Volume K Units Forecast, by Distrubution Channel 2020 & 2033
- Table 47: Global APAC Athletic Footwear Market Revenue billion Forecast, by Geography 2020 & 2033
- Table 48: Global APAC Athletic Footwear Market Volume K Units Forecast, by Geography 2020 & 2033
- Table 49: Global APAC Athletic Footwear Market Revenue billion Forecast, by Country 2020 & 2033
- Table 50: Global APAC Athletic Footwear Market Volume K Units Forecast, by Country 2020 & 2033
- Table 51: Global APAC Athletic Footwear Market Revenue billion Forecast, by Type 2020 & 2033
- Table 52: Global APAC Athletic Footwear Market Volume K Units Forecast, by Type 2020 & 2033
- Table 53: Global APAC Athletic Footwear Market Revenue billion Forecast, by End User 2020 & 2033
- Table 54: Global APAC Athletic Footwear Market Volume K Units Forecast, by End User 2020 & 2033
- Table 55: Global APAC Athletic Footwear Market Revenue billion Forecast, by Distrubution Channel 2020 & 2033
- Table 56: Global APAC Athletic Footwear Market Volume K Units Forecast, by Distrubution Channel 2020 & 2033
- Table 57: Global APAC Athletic Footwear Market Revenue billion Forecast, by Geography 2020 & 2033
- Table 58: Global APAC Athletic Footwear Market Volume K Units Forecast, by Geography 2020 & 2033
- Table 59: Global APAC Athletic Footwear Market Revenue billion Forecast, by Country 2020 & 2033
- Table 60: Global APAC Athletic Footwear Market Volume K Units Forecast, by Country 2020 & 2033
Frequently Asked Questions
1. What is the projected Compound Annual Growth Rate (CAGR) of the APAC Athletic Footwear Market?
The projected CAGR is approximately 6.83%.
2. Which companies are prominent players in the APAC Athletic Footwear Market?
Key companies in the market include Adidas AG, VF Corporation, Brooks Running Company, FILA Holdings Corporation, Asics Corporation, Puma SE, Under Armour Inc, Nike Inc, Li-Ning Company Limited, New Balance Athletics Inc.
3. What are the main segments of the APAC Athletic Footwear Market?
The market segments include Type, End User, Distrubution Channel, Geography.
4. Can you provide details about the market size?
The market size is estimated to be USD 194 billion as of 2022.
5. What are some drivers contributing to market growth?
Increased Sports Participation and Flourishing Demand for Sports Apparel; Rising Innovation in Athleisure Products.
6. What are the notable trends driving market growth?
Rising Sports Participation Rate with Inclination Toward Healthy Lifestyle.
7. Are there any restraints impacting market growth?
Penetration of Counterfeit Products.
8. Can you provide examples of recent developments in the market?
In June 2022, Under Armour Inc launched its athletic shoes 'HOVR Machina 3' in India. The third edition of the UA HOVRTM Machina running shoes, the HOVR Machina 3, has now been released by the company in India after being thoroughly tested and certified by UA Athletes. With a price of INR 14,999, this shoe continues to satisfy consumer needs by offering the most recent in technology and innovation.
9. What pricing options are available for accessing the report?
Pricing options include single-user, multi-user, and enterprise licenses priced at USD 4750, USD 5250, and USD 8750 respectively.
10. Is the market size provided in terms of value or volume?
The market size is provided in terms of value, measured in billion and volume, measured in K Units.
11. Are there any specific market keywords associated with the report?
Yes, the market keyword associated with the report is "APAC Athletic Footwear Market," which aids in identifying and referencing the specific market segment covered.
12. How do I determine which pricing option suits my needs best?
The pricing options vary based on user requirements and access needs. Individual users may opt for single-user licenses, while businesses requiring broader access may choose multi-user or enterprise licenses for cost-effective access to the report.
13. Are there any additional resources or data provided in the APAC Athletic Footwear Market report?
While the report offers comprehensive insights, it's advisable to review the specific contents or supplementary materials provided to ascertain if additional resources or data are available.
14. How can I stay updated on further developments or reports in the APAC Athletic Footwear Market?
To stay informed about further developments, trends, and reports in the APAC Athletic Footwear Market, consider subscribing to industry newsletters, following relevant companies and organizations, or regularly checking reputable industry news sources and publications.
Methodology
Step 1 - Identification of Relevant Samples Size from Population Database


Step 2 - Approaches for Defining Global Market Size (Value, Volume* & Price*)

Note*: In applicable scenarios
Step 3 - Data Sources
Primary Research
- Web Analytics
- Survey Reports
- Research Institute
- Latest Research Reports
- Opinion Leaders
Secondary Research
- Annual Reports
- White Paper
- Latest Press Release
- Industry Association
- Paid Database
- Investor Presentations

Step 4 - Data Triangulation
Involves using different sources of information in order to increase the validity of a study
These sources are likely to be stakeholders in a program - participants, other researchers, program staff, other community members, and so on.
Then we put all data in single framework & apply various statistical tools to find out the dynamic on the market.
During the analysis stage, feedback from the stakeholder groups would be compared to determine areas of agreement as well as areas of divergence