
Key Insights
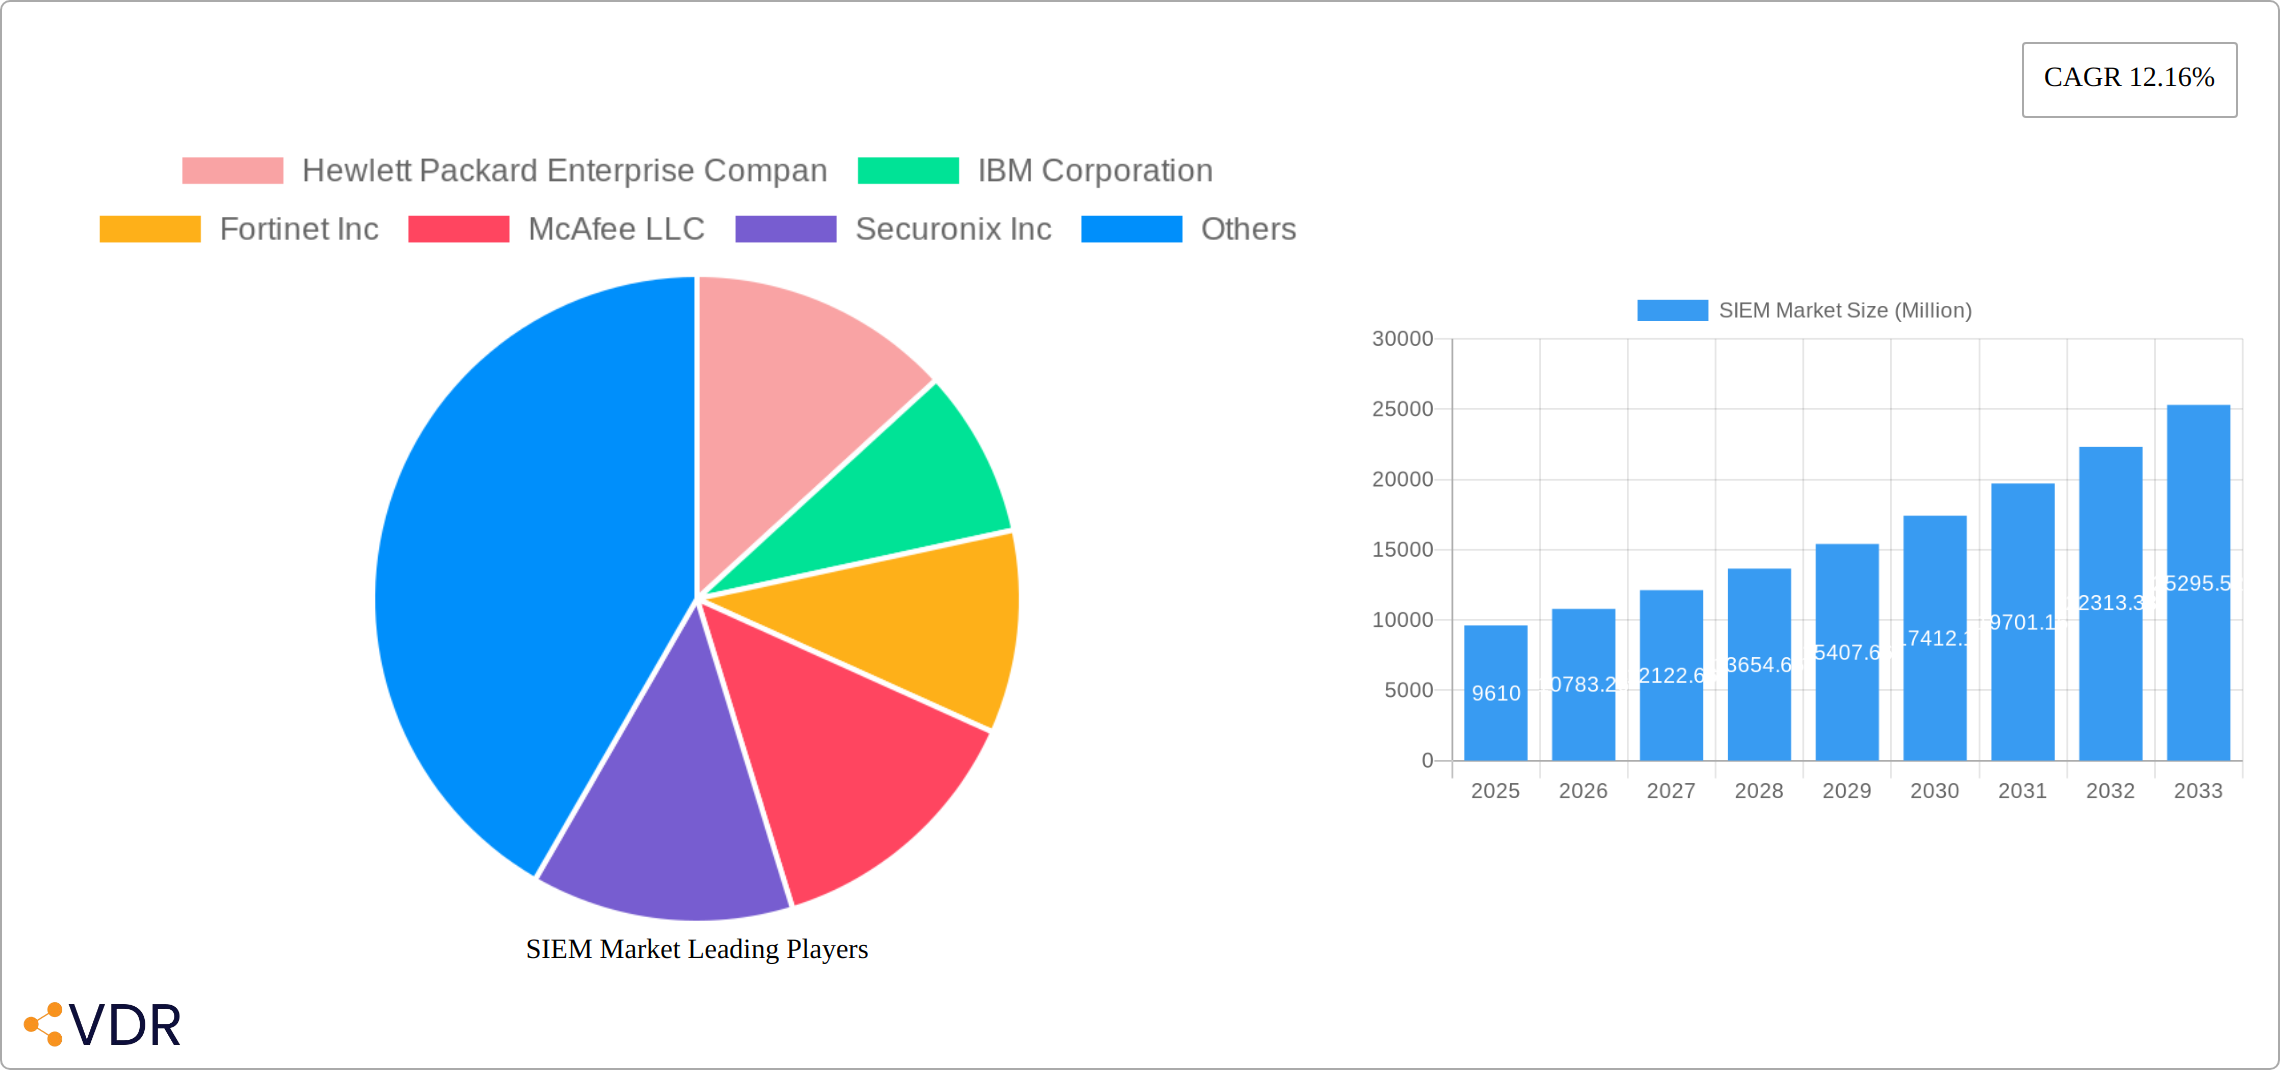
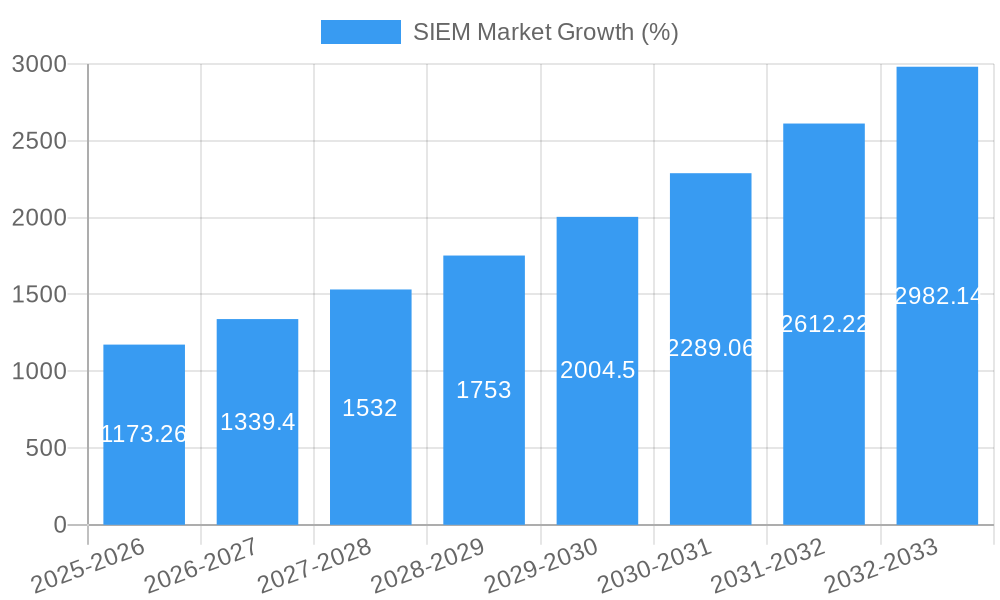
The global Security Information and Event Management (SIEM) market is experiencing robust growth, projected to reach \$9.61 billion in 2025 and maintain a Compound Annual Growth Rate (CAGR) of 12.16% from 2025 to 2033. This expansion is driven by several key factors. The increasing frequency and sophistication of cyberattacks across all sectors—from retail and BFSI to manufacturing and healthcare—are compelling organizations of all sizes to adopt robust security solutions. Furthermore, the rising adoption of cloud computing and the growing volume of data generated necessitate advanced security analytics capabilities offered by SIEM platforms. Stringent government regulations concerning data privacy and security compliance also contribute to market growth, particularly in regions like North America and Europe. The market is segmented by deployment (on-premise and cloud), organization type (SMEs and large enterprises), and end-user industry, with large enterprises and the cloud deployment model currently dominating market share. Competition is fierce, with established players like Hewlett Packard Enterprise, IBM, and Fortinet vying for market dominance alongside emerging innovators like Securonix and Exabeam. The competitive landscape is characterized by ongoing innovation in areas such as artificial intelligence (AI) and machine learning (ML) integration for enhanced threat detection and response capabilities.
The future of the SIEM market hinges on several crucial trends. The integration of SIEM with other security tools, such as Security Orchestration, Automation, and Response (SOAR) solutions, is becoming increasingly prevalent. This convergence creates a more holistic and effective security posture. Furthermore, the growing adoption of cloud-native SIEM solutions is streamlining deployment and management for organizations. However, challenges remain. The complexity of SIEM implementation and management, the need for skilled cybersecurity professionals, and the high initial investment costs can act as restraints for some organizations, particularly SMEs. Despite these challenges, the long-term outlook for the SIEM market remains positive, driven by the ever-increasing need for advanced security solutions in a rapidly evolving threat landscape. Geographic expansion, particularly in the Asia-Pacific region, is expected to further fuel market growth in the coming years. The market will likely see continued consolidation, with larger players potentially acquiring smaller companies to expand their product portfolios and market reach.
This in-depth report provides a comprehensive analysis of the SIEM (Security Information and Event Management) market, encompassing market dynamics, growth trends, regional segmentation, competitive landscape, and future outlook. The study covers the period from 2019 to 2033, with a focus on the forecast period of 2025-2033 and a base year of 2025. The report is essential for industry professionals, investors, and strategists seeking a clear understanding of this rapidly evolving market. The total market size is projected to reach xx Million by 2033.
SIEM Market Dynamics & Structure
The SIEM market is characterized by moderate concentration, with several major players holding significant market share. Technological innovation, particularly in AI and cloud-based solutions, is a key driver. Stringent regulatory frameworks, such as GDPR and CCPA, are also fueling demand for robust SIEM solutions. Cloud-based SIEM solutions are emerging as strong substitutes for traditional on-premise deployments. The market is predominantly driven by large enterprises, but SMEs are increasingly adopting SIEM solutions due to rising cyber threats. M&A activity has been relatively steady, with several significant acquisitions shaping the competitive landscape.
- Market Concentration: Moderately concentrated, with top 5 players holding approximately xx% market share in 2025.
- Innovation Drivers: AI-powered threat detection, cloud-native architectures, and enhanced threat intelligence integration.
- Regulatory Framework: GDPR, CCPA, and other cybersecurity regulations are driving adoption.
- Competitive Substitutes: Cloud-based SIEM solutions and managed security service providers (MSSPs).
- End-User Demographics: Large enterprises dominate, with growing adoption among SMEs.
- M&A Trends: xx major M&A deals recorded between 2019-2024, with an average deal size of xx Million.
SIEM Market Growth Trends & Insights
The SIEM market exhibits robust growth, driven by escalating cyber threats, increasing data volumes, and the growing adoption of cloud computing. The market experienced a CAGR of xx% during the historical period (2019-2024) and is projected to maintain a CAGR of xx% during the forecast period (2025-2033). Market penetration is highest in developed regions, with significant growth potential in emerging markets. Technological disruptions, such as the rise of AI-driven SIEM solutions, are reshaping the market landscape. Consumer behavior shifts towards proactive security measures are further fueling market growth. The global market size is estimated at xx Million in 2025 and is forecast to reach xx Million by 2033.
Dominant Regions, Countries, or Segments in SIEM Market
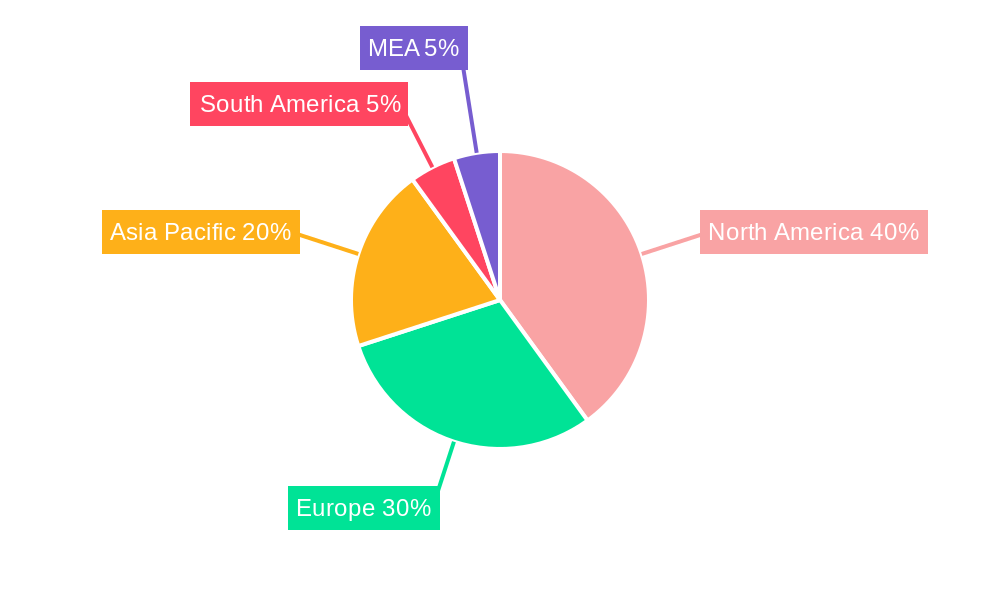
North America currently holds the largest market share in the SIEM market, driven by strong technological advancements, high cybersecurity awareness, and a large number of established enterprises. However, the Asia-Pacific region is expected to witness the fastest growth during the forecast period due to increasing digitalization and rising cyber threats. Within segments, the cloud-based deployment model demonstrates significant growth, surpassing on-premise deployments in 2025. Large enterprises account for the majority of market revenue, driven by their substantial IT infrastructure and high security budgets. The BFSI and Government sectors are key end-user industries, contributing significantly to market growth.
- Key Drivers (North America): Strong cybersecurity awareness, robust IT infrastructure, and high enterprise adoption.
- Key Drivers (Asia-Pacific): Increasing digitalization, rising cyber threats, and government initiatives promoting cybersecurity.
- Cloud Deployment: High growth due to scalability, cost-effectiveness, and accessibility.
- Large Enterprises: Dominate the market due to high security budgets and complex IT infrastructure.
- BFSI & Government: Key end-user industries with high demand for robust security solutions.
SIEM Market Product Landscape
The SIEM market offers a wide range of products, from basic log management to advanced threat detection and response capabilities. Product innovations focus on improving threat detection accuracy, automating security operations, and integrating with other security tools. Key performance indicators include threat detection rates, mean time to detection (MTTD), and mean time to response (MTTR). Unique selling propositions include AI-powered threat intelligence, advanced analytics, and seamless integration with cloud environments.
Key Drivers, Barriers & Challenges in SIEM Market
Key Drivers:
- Increasing cyber threats and data breaches.
- Growing adoption of cloud computing and IoT devices.
- Stringent regulatory compliance requirements.
- Rising demand for proactive security measures.
Challenges & Restraints:
- High implementation and maintenance costs.
- Complexity of SIEM solutions and skill gaps.
- Data overload and difficulty in analyzing large datasets.
- Integration challenges with existing security infrastructure. This results in an estimated xx Million loss in potential revenue annually.
Emerging Opportunities in SIEM Market
- Growing demand for cloud-based SIEM solutions.
- Increased adoption of AI and machine learning in threat detection.
- Expanding market in developing economies.
- Integration with other security tools (e.g., SOAR, UEBA).
- Emergence of managed SIEM services.
Growth Accelerators in the SIEM Market Industry
Technological breakthroughs in AI and machine learning are driving significant growth in the SIEM market. Strategic partnerships between SIEM vendors and other security solution providers are expanding market reach and improving product capabilities. Market expansion strategies targeting emerging markets and underserved sectors are also contributing to sustained growth.
Key Players Shaping the SIEM Market Market
- Hewlett Packard Enterprise Company
- IBM Corporation
- Fortinet Inc
- McAfee LLC
- Securonix Inc
- Rapid7 Inc
- LogRhythm Inc
- RSA Security LLC (Dell Technologies)
- Open Text Corporation
- Exabeam Inc
- AlienVault Inc
- Splunk Inc
Notable Milestones in SIEM Market Sector
- November 2023: IBM launched a major update to its QRadar SIEM product, featuring a cloud-native architecture and enhanced AI capabilities. This significantly improves the product's scalability and threat detection capabilities.
- April 2023: ManageEngine launched the MSSP Edition of its Log360 Cloud SIEM solution, expanding its reach to managed security service providers. This caters to a growing market segment and increases market competition.
In-Depth SIEM Market Market Outlook
The SIEM market is poised for continued strong growth, driven by persistent cyber threats, increasing digitalization, and the ongoing adoption of cloud-based solutions. Strategic opportunities lie in developing AI-powered solutions, expanding into emerging markets, and fostering strategic partnerships to enhance product offerings and market reach. The future of the SIEM market points towards more sophisticated, integrated, and automated security solutions that leverage the power of AI and machine learning to proactively combat evolving threats.
SIEM Market Segmentation
-
1. Deployment
- 1.1. On-premise
- 1.2. Cloud
-
2. Organisation Type
- 2.1. Small and Medium Enterprises (SMEs)
- 2.2. Large Enterprises
-
3. End-user Industry
- 3.1. Retail
- 3.2. BFSI
- 3.3. Manufacturing
- 3.4. Government
- 3.5. Healthcare
- 3.6. Other End-user Industries
SIEM Market Segmentation By Geography
-
1. North America
- 1.1. United States
- 1.2. Canada
-
2. Europe
- 2.1. Germany
- 2.2. United Kingdom
- 2.3. France
-
3. Asia
- 3.1. China
- 3.2. Japan
- 3.3. India
- 3.4. Australia and New Zealand
-
4. Latin America
- 4.1. Brazil
- 4.2. Argentina
-
5. Middle East and Africa
- 5.1. United Arab Emirates
SIEM Market REPORT HIGHLIGHTS
| Aspects | Details |
|---|---|
| Study Period | 2019-2033 |
| Base Year | 2024 |
| Estimated Year | 2025 |
| Forecast Period | 2025-2033 |
| Historical Period | 2019-2024 |
| Growth Rate | CAGR of 12.16% from 2019-2033 |
| Segmentation |
|
Table of Contents
- 1. Introduction
- 1.1. Research Scope
- 1.2. Market Segmentation
- 1.3. Research Methodology
- 1.4. Definitions and Assumptions
- 2. Executive Summary
- 2.1. Introduction
- 3. Market Dynamics
- 3.1. Introduction
- 3.2. Market Drivers
- 3.2.1. Growth in Security Concerns; Increasing Adoption of BYOD
- 3.3. Market Restrains
- 3.3.1. Lack of Skilled Labor
- 3.4. Market Trends
- 3.4.1. Cloud to Witness Significant Growth
- 4. Market Factor Analysis
- 4.1. Porters Five Forces
- 4.2. Supply/Value Chain
- 4.3. PESTEL analysis
- 4.4. Market Entropy
- 4.5. Patent/Trademark Analysis
- 5. Global SIEM Market Analysis, Insights and Forecast, 2019-2031
- 5.1. Market Analysis, Insights and Forecast - by Deployment
- 5.1.1. On-premise
- 5.1.2. Cloud
- 5.2. Market Analysis, Insights and Forecast - by Organisation Type
- 5.2.1. Small and Medium Enterprises (SMEs)
- 5.2.2. Large Enterprises
- 5.3. Market Analysis, Insights and Forecast - by End-user Industry
- 5.3.1. Retail
- 5.3.2. BFSI
- 5.3.3. Manufacturing
- 5.3.4. Government
- 5.3.5. Healthcare
- 5.3.6. Other End-user Industries
- 5.4. Market Analysis, Insights and Forecast - by Region
- 5.4.1. North America
- 5.4.2. Europe
- 5.4.3. Asia
- 5.4.4. Latin America
- 5.4.5. Middle East and Africa
- 5.1. Market Analysis, Insights and Forecast - by Deployment
- 6. North America SIEM Market Analysis, Insights and Forecast, 2019-2031
- 6.1. Market Analysis, Insights and Forecast - by Deployment
- 6.1.1. On-premise
- 6.1.2. Cloud
- 6.2. Market Analysis, Insights and Forecast - by Organisation Type
- 6.2.1. Small and Medium Enterprises (SMEs)
- 6.2.2. Large Enterprises
- 6.3. Market Analysis, Insights and Forecast - by End-user Industry
- 6.3.1. Retail
- 6.3.2. BFSI
- 6.3.3. Manufacturing
- 6.3.4. Government
- 6.3.5. Healthcare
- 6.3.6. Other End-user Industries
- 6.1. Market Analysis, Insights and Forecast - by Deployment
- 7. Europe SIEM Market Analysis, Insights and Forecast, 2019-2031
- 7.1. Market Analysis, Insights and Forecast - by Deployment
- 7.1.1. On-premise
- 7.1.2. Cloud
- 7.2. Market Analysis, Insights and Forecast - by Organisation Type
- 7.2.1. Small and Medium Enterprises (SMEs)
- 7.2.2. Large Enterprises
- 7.3. Market Analysis, Insights and Forecast - by End-user Industry
- 7.3.1. Retail
- 7.3.2. BFSI
- 7.3.3. Manufacturing
- 7.3.4. Government
- 7.3.5. Healthcare
- 7.3.6. Other End-user Industries
- 7.1. Market Analysis, Insights and Forecast - by Deployment
- 8. Asia SIEM Market Analysis, Insights and Forecast, 2019-2031
- 8.1. Market Analysis, Insights and Forecast - by Deployment
- 8.1.1. On-premise
- 8.1.2. Cloud
- 8.2. Market Analysis, Insights and Forecast - by Organisation Type
- 8.2.1. Small and Medium Enterprises (SMEs)
- 8.2.2. Large Enterprises
- 8.3. Market Analysis, Insights and Forecast - by End-user Industry
- 8.3.1. Retail
- 8.3.2. BFSI
- 8.3.3. Manufacturing
- 8.3.4. Government
- 8.3.5. Healthcare
- 8.3.6. Other End-user Industries
- 8.1. Market Analysis, Insights and Forecast - by Deployment
- 9. Latin America SIEM Market Analysis, Insights and Forecast, 2019-2031
- 9.1. Market Analysis, Insights and Forecast - by Deployment
- 9.1.1. On-premise
- 9.1.2. Cloud
- 9.2. Market Analysis, Insights and Forecast - by Organisation Type
- 9.2.1. Small and Medium Enterprises (SMEs)
- 9.2.2. Large Enterprises
- 9.3. Market Analysis, Insights and Forecast - by End-user Industry
- 9.3.1. Retail
- 9.3.2. BFSI
- 9.3.3. Manufacturing
- 9.3.4. Government
- 9.3.5. Healthcare
- 9.3.6. Other End-user Industries
- 9.1. Market Analysis, Insights and Forecast - by Deployment
- 10. Middle East and Africa SIEM Market Analysis, Insights and Forecast, 2019-2031
- 10.1. Market Analysis, Insights and Forecast - by Deployment
- 10.1.1. On-premise
- 10.1.2. Cloud
- 10.2. Market Analysis, Insights and Forecast - by Organisation Type
- 10.2.1. Small and Medium Enterprises (SMEs)
- 10.2.2. Large Enterprises
- 10.3. Market Analysis, Insights and Forecast - by End-user Industry
- 10.3.1. Retail
- 10.3.2. BFSI
- 10.3.3. Manufacturing
- 10.3.4. Government
- 10.3.5. Healthcare
- 10.3.6. Other End-user Industries
- 10.1. Market Analysis, Insights and Forecast - by Deployment
- 11. North America SIEM Market Analysis, Insights and Forecast, 2019-2031
- 11.1. Market Analysis, Insights and Forecast - By Country/Sub-region
- 11.1.1 United States
- 11.1.2 Canada
- 11.1.3 Mexico
- 12. Europe SIEM Market Analysis, Insights and Forecast, 2019-2031
- 12.1. Market Analysis, Insights and Forecast - By Country/Sub-region
- 12.1.1 Germany
- 12.1.2 United Kingdom
- 12.1.3 France
- 12.1.4 Spain
- 12.1.5 Italy
- 12.1.6 Spain
- 12.1.7 Belgium
- 12.1.8 Netherland
- 12.1.9 Nordics
- 12.1.10 Rest of Europe
- 13. Asia Pacific SIEM Market Analysis, Insights and Forecast, 2019-2031
- 13.1. Market Analysis, Insights and Forecast - By Country/Sub-region
- 13.1.1 China
- 13.1.2 Japan
- 13.1.3 India
- 13.1.4 South Korea
- 13.1.5 Southeast Asia
- 13.1.6 Australia
- 13.1.7 Indonesia
- 13.1.8 Phillipes
- 13.1.9 Singapore
- 13.1.10 Thailandc
- 13.1.11 Rest of Asia Pacific
- 14. South America SIEM Market Analysis, Insights and Forecast, 2019-2031
- 14.1. Market Analysis, Insights and Forecast - By Country/Sub-region
- 14.1.1 Brazil
- 14.1.2 Argentina
- 14.1.3 Peru
- 14.1.4 Chile
- 14.1.5 Colombia
- 14.1.6 Ecuador
- 14.1.7 Venezuela
- 14.1.8 Rest of South America
- 15. North America SIEM Market Analysis, Insights and Forecast, 2019-2031
- 15.1. Market Analysis, Insights and Forecast - By Country/Sub-region
- 15.1.1 United States
- 15.1.2 Canada
- 15.1.3 Mexico
- 16. MEA SIEM Market Analysis, Insights and Forecast, 2019-2031
- 16.1. Market Analysis, Insights and Forecast - By Country/Sub-region
- 16.1.1 United Arab Emirates
- 16.1.2 Saudi Arabia
- 16.1.3 South Africa
- 16.1.4 Rest of Middle East and Africa
- 17. Competitive Analysis
- 17.1. Global Market Share Analysis 2024
- 17.2. Company Profiles
- 17.2.1 Hewlett Packard Enterprise Compan
- 17.2.1.1. Overview
- 17.2.1.2. Products
- 17.2.1.3. SWOT Analysis
- 17.2.1.4. Recent Developments
- 17.2.1.5. Financials (Based on Availability)
- 17.2.2 IBM Corporation
- 17.2.2.1. Overview
- 17.2.2.2. Products
- 17.2.2.3. SWOT Analysis
- 17.2.2.4. Recent Developments
- 17.2.2.5. Financials (Based on Availability)
- 17.2.3 Fortinet Inc
- 17.2.3.1. Overview
- 17.2.3.2. Products
- 17.2.3.3. SWOT Analysis
- 17.2.3.4. Recent Developments
- 17.2.3.5. Financials (Based on Availability)
- 17.2.4 McAfee LLC
- 17.2.4.1. Overview
- 17.2.4.2. Products
- 17.2.4.3. SWOT Analysis
- 17.2.4.4. Recent Developments
- 17.2.4.5. Financials (Based on Availability)
- 17.2.5 Securonix Inc
- 17.2.5.1. Overview
- 17.2.5.2. Products
- 17.2.5.3. SWOT Analysis
- 17.2.5.4. Recent Developments
- 17.2.5.5. Financials (Based on Availability)
- 17.2.6 Rapid7 Inc
- 17.2.6.1. Overview
- 17.2.6.2. Products
- 17.2.6.3. SWOT Analysis
- 17.2.6.4. Recent Developments
- 17.2.6.5. Financials (Based on Availability)
- 17.2.7 LogRhythm Inc
- 17.2.7.1. Overview
- 17.2.7.2. Products
- 17.2.7.3. SWOT Analysis
- 17.2.7.4. Recent Developments
- 17.2.7.5. Financials (Based on Availability)
- 17.2.8 RSA Security LLC (Dell Technologies)
- 17.2.8.1. Overview
- 17.2.8.2. Products
- 17.2.8.3. SWOT Analysis
- 17.2.8.4. Recent Developments
- 17.2.8.5. Financials (Based on Availability)
- 17.2.9 Open Text Corporation
- 17.2.9.1. Overview
- 17.2.9.2. Products
- 17.2.9.3. SWOT Analysis
- 17.2.9.4. Recent Developments
- 17.2.9.5. Financials (Based on Availability)
- 17.2.10 Exabeam Inc
- 17.2.10.1. Overview
- 17.2.10.2. Products
- 17.2.10.3. SWOT Analysis
- 17.2.10.4. Recent Developments
- 17.2.10.5. Financials (Based on Availability)
- 17.2.11 AlienVault Inc
- 17.2.11.1. Overview
- 17.2.11.2. Products
- 17.2.11.3. SWOT Analysis
- 17.2.11.4. Recent Developments
- 17.2.11.5. Financials (Based on Availability)
- 17.2.12 Splunk Inc
- 17.2.12.1. Overview
- 17.2.12.2. Products
- 17.2.12.3. SWOT Analysis
- 17.2.12.4. Recent Developments
- 17.2.12.5. Financials (Based on Availability)
- 17.2.1 Hewlett Packard Enterprise Compan
List of Figures
- Figure 1: Global SIEM Market Revenue Breakdown (Million, %) by Region 2024 & 2032
- Figure 2: North America SIEM Market Revenue (Million), by Country 2024 & 2032
- Figure 3: North America SIEM Market Revenue Share (%), by Country 2024 & 2032
- Figure 4: Europe SIEM Market Revenue (Million), by Country 2024 & 2032
- Figure 5: Europe SIEM Market Revenue Share (%), by Country 2024 & 2032
- Figure 6: Asia Pacific SIEM Market Revenue (Million), by Country 2024 & 2032
- Figure 7: Asia Pacific SIEM Market Revenue Share (%), by Country 2024 & 2032
- Figure 8: South America SIEM Market Revenue (Million), by Country 2024 & 2032
- Figure 9: South America SIEM Market Revenue Share (%), by Country 2024 & 2032
- Figure 10: North America SIEM Market Revenue (Million), by Country 2024 & 2032
- Figure 11: North America SIEM Market Revenue Share (%), by Country 2024 & 2032
- Figure 12: MEA SIEM Market Revenue (Million), by Country 2024 & 2032
- Figure 13: MEA SIEM Market Revenue Share (%), by Country 2024 & 2032
- Figure 14: North America SIEM Market Revenue (Million), by Deployment 2024 & 2032
- Figure 15: North America SIEM Market Revenue Share (%), by Deployment 2024 & 2032
- Figure 16: North America SIEM Market Revenue (Million), by Organisation Type 2024 & 2032
- Figure 17: North America SIEM Market Revenue Share (%), by Organisation Type 2024 & 2032
- Figure 18: North America SIEM Market Revenue (Million), by End-user Industry 2024 & 2032
- Figure 19: North America SIEM Market Revenue Share (%), by End-user Industry 2024 & 2032
- Figure 20: North America SIEM Market Revenue (Million), by Country 2024 & 2032
- Figure 21: North America SIEM Market Revenue Share (%), by Country 2024 & 2032
- Figure 22: Europe SIEM Market Revenue (Million), by Deployment 2024 & 2032
- Figure 23: Europe SIEM Market Revenue Share (%), by Deployment 2024 & 2032
- Figure 24: Europe SIEM Market Revenue (Million), by Organisation Type 2024 & 2032
- Figure 25: Europe SIEM Market Revenue Share (%), by Organisation Type 2024 & 2032
- Figure 26: Europe SIEM Market Revenue (Million), by End-user Industry 2024 & 2032
- Figure 27: Europe SIEM Market Revenue Share (%), by End-user Industry 2024 & 2032
- Figure 28: Europe SIEM Market Revenue (Million), by Country 2024 & 2032
- Figure 29: Europe SIEM Market Revenue Share (%), by Country 2024 & 2032
- Figure 30: Asia SIEM Market Revenue (Million), by Deployment 2024 & 2032
- Figure 31: Asia SIEM Market Revenue Share (%), by Deployment 2024 & 2032
- Figure 32: Asia SIEM Market Revenue (Million), by Organisation Type 2024 & 2032
- Figure 33: Asia SIEM Market Revenue Share (%), by Organisation Type 2024 & 2032
- Figure 34: Asia SIEM Market Revenue (Million), by End-user Industry 2024 & 2032
- Figure 35: Asia SIEM Market Revenue Share (%), by End-user Industry 2024 & 2032
- Figure 36: Asia SIEM Market Revenue (Million), by Country 2024 & 2032
- Figure 37: Asia SIEM Market Revenue Share (%), by Country 2024 & 2032
- Figure 38: Latin America SIEM Market Revenue (Million), by Deployment 2024 & 2032
- Figure 39: Latin America SIEM Market Revenue Share (%), by Deployment 2024 & 2032
- Figure 40: Latin America SIEM Market Revenue (Million), by Organisation Type 2024 & 2032
- Figure 41: Latin America SIEM Market Revenue Share (%), by Organisation Type 2024 & 2032
- Figure 42: Latin America SIEM Market Revenue (Million), by End-user Industry 2024 & 2032
- Figure 43: Latin America SIEM Market Revenue Share (%), by End-user Industry 2024 & 2032
- Figure 44: Latin America SIEM Market Revenue (Million), by Country 2024 & 2032
- Figure 45: Latin America SIEM Market Revenue Share (%), by Country 2024 & 2032
- Figure 46: Middle East and Africa SIEM Market Revenue (Million), by Deployment 2024 & 2032
- Figure 47: Middle East and Africa SIEM Market Revenue Share (%), by Deployment 2024 & 2032
- Figure 48: Middle East and Africa SIEM Market Revenue (Million), by Organisation Type 2024 & 2032
- Figure 49: Middle East and Africa SIEM Market Revenue Share (%), by Organisation Type 2024 & 2032
- Figure 50: Middle East and Africa SIEM Market Revenue (Million), by End-user Industry 2024 & 2032
- Figure 51: Middle East and Africa SIEM Market Revenue Share (%), by End-user Industry 2024 & 2032
- Figure 52: Middle East and Africa SIEM Market Revenue (Million), by Country 2024 & 2032
- Figure 53: Middle East and Africa SIEM Market Revenue Share (%), by Country 2024 & 2032
List of Tables
- Table 1: Global SIEM Market Revenue Million Forecast, by Region 2019 & 2032
- Table 2: Global SIEM Market Revenue Million Forecast, by Deployment 2019 & 2032
- Table 3: Global SIEM Market Revenue Million Forecast, by Organisation Type 2019 & 2032
- Table 4: Global SIEM Market Revenue Million Forecast, by End-user Industry 2019 & 2032
- Table 5: Global SIEM Market Revenue Million Forecast, by Region 2019 & 2032
- Table 6: Global SIEM Market Revenue Million Forecast, by Country 2019 & 2032
- Table 7: United States SIEM Market Revenue (Million) Forecast, by Application 2019 & 2032
- Table 8: Canada SIEM Market Revenue (Million) Forecast, by Application 2019 & 2032
- Table 9: Mexico SIEM Market Revenue (Million) Forecast, by Application 2019 & 2032
- Table 10: Global SIEM Market Revenue Million Forecast, by Country 2019 & 2032
- Table 11: Germany SIEM Market Revenue (Million) Forecast, by Application 2019 & 2032
- Table 12: United Kingdom SIEM Market Revenue (Million) Forecast, by Application 2019 & 2032
- Table 13: France SIEM Market Revenue (Million) Forecast, by Application 2019 & 2032
- Table 14: Spain SIEM Market Revenue (Million) Forecast, by Application 2019 & 2032
- Table 15: Italy SIEM Market Revenue (Million) Forecast, by Application 2019 & 2032
- Table 16: Spain SIEM Market Revenue (Million) Forecast, by Application 2019 & 2032
- Table 17: Belgium SIEM Market Revenue (Million) Forecast, by Application 2019 & 2032
- Table 18: Netherland SIEM Market Revenue (Million) Forecast, by Application 2019 & 2032
- Table 19: Nordics SIEM Market Revenue (Million) Forecast, by Application 2019 & 2032
- Table 20: Rest of Europe SIEM Market Revenue (Million) Forecast, by Application 2019 & 2032
- Table 21: Global SIEM Market Revenue Million Forecast, by Country 2019 & 2032
- Table 22: China SIEM Market Revenue (Million) Forecast, by Application 2019 & 2032
- Table 23: Japan SIEM Market Revenue (Million) Forecast, by Application 2019 & 2032
- Table 24: India SIEM Market Revenue (Million) Forecast, by Application 2019 & 2032
- Table 25: South Korea SIEM Market Revenue (Million) Forecast, by Application 2019 & 2032
- Table 26: Southeast Asia SIEM Market Revenue (Million) Forecast, by Application 2019 & 2032
- Table 27: Australia SIEM Market Revenue (Million) Forecast, by Application 2019 & 2032
- Table 28: Indonesia SIEM Market Revenue (Million) Forecast, by Application 2019 & 2032
- Table 29: Phillipes SIEM Market Revenue (Million) Forecast, by Application 2019 & 2032
- Table 30: Singapore SIEM Market Revenue (Million) Forecast, by Application 2019 & 2032
- Table 31: Thailandc SIEM Market Revenue (Million) Forecast, by Application 2019 & 2032
- Table 32: Rest of Asia Pacific SIEM Market Revenue (Million) Forecast, by Application 2019 & 2032
- Table 33: Global SIEM Market Revenue Million Forecast, by Country 2019 & 2032
- Table 34: Brazil SIEM Market Revenue (Million) Forecast, by Application 2019 & 2032
- Table 35: Argentina SIEM Market Revenue (Million) Forecast, by Application 2019 & 2032
- Table 36: Peru SIEM Market Revenue (Million) Forecast, by Application 2019 & 2032
- Table 37: Chile SIEM Market Revenue (Million) Forecast, by Application 2019 & 2032
- Table 38: Colombia SIEM Market Revenue (Million) Forecast, by Application 2019 & 2032
- Table 39: Ecuador SIEM Market Revenue (Million) Forecast, by Application 2019 & 2032
- Table 40: Venezuela SIEM Market Revenue (Million) Forecast, by Application 2019 & 2032
- Table 41: Rest of South America SIEM Market Revenue (Million) Forecast, by Application 2019 & 2032
- Table 42: Global SIEM Market Revenue Million Forecast, by Country 2019 & 2032
- Table 43: United States SIEM Market Revenue (Million) Forecast, by Application 2019 & 2032
- Table 44: Canada SIEM Market Revenue (Million) Forecast, by Application 2019 & 2032
- Table 45: Mexico SIEM Market Revenue (Million) Forecast, by Application 2019 & 2032
- Table 46: Global SIEM Market Revenue Million Forecast, by Country 2019 & 2032
- Table 47: United Arab Emirates SIEM Market Revenue (Million) Forecast, by Application 2019 & 2032
- Table 48: Saudi Arabia SIEM Market Revenue (Million) Forecast, by Application 2019 & 2032
- Table 49: South Africa SIEM Market Revenue (Million) Forecast, by Application 2019 & 2032
- Table 50: Rest of Middle East and Africa SIEM Market Revenue (Million) Forecast, by Application 2019 & 2032
- Table 51: Global SIEM Market Revenue Million Forecast, by Deployment 2019 & 2032
- Table 52: Global SIEM Market Revenue Million Forecast, by Organisation Type 2019 & 2032
- Table 53: Global SIEM Market Revenue Million Forecast, by End-user Industry 2019 & 2032
- Table 54: Global SIEM Market Revenue Million Forecast, by Country 2019 & 2032
- Table 55: United States SIEM Market Revenue (Million) Forecast, by Application 2019 & 2032
- Table 56: Canada SIEM Market Revenue (Million) Forecast, by Application 2019 & 2032
- Table 57: Global SIEM Market Revenue Million Forecast, by Deployment 2019 & 2032
- Table 58: Global SIEM Market Revenue Million Forecast, by Organisation Type 2019 & 2032
- Table 59: Global SIEM Market Revenue Million Forecast, by End-user Industry 2019 & 2032
- Table 60: Global SIEM Market Revenue Million Forecast, by Country 2019 & 2032
- Table 61: Germany SIEM Market Revenue (Million) Forecast, by Application 2019 & 2032
- Table 62: United Kingdom SIEM Market Revenue (Million) Forecast, by Application 2019 & 2032
- Table 63: France SIEM Market Revenue (Million) Forecast, by Application 2019 & 2032
- Table 64: Global SIEM Market Revenue Million Forecast, by Deployment 2019 & 2032
- Table 65: Global SIEM Market Revenue Million Forecast, by Organisation Type 2019 & 2032
- Table 66: Global SIEM Market Revenue Million Forecast, by End-user Industry 2019 & 2032
- Table 67: Global SIEM Market Revenue Million Forecast, by Country 2019 & 2032
- Table 68: China SIEM Market Revenue (Million) Forecast, by Application 2019 & 2032
- Table 69: Japan SIEM Market Revenue (Million) Forecast, by Application 2019 & 2032
- Table 70: India SIEM Market Revenue (Million) Forecast, by Application 2019 & 2032
- Table 71: Australia and New Zealand SIEM Market Revenue (Million) Forecast, by Application 2019 & 2032
- Table 72: Global SIEM Market Revenue Million Forecast, by Deployment 2019 & 2032
- Table 73: Global SIEM Market Revenue Million Forecast, by Organisation Type 2019 & 2032
- Table 74: Global SIEM Market Revenue Million Forecast, by End-user Industry 2019 & 2032
- Table 75: Global SIEM Market Revenue Million Forecast, by Country 2019 & 2032
- Table 76: Brazil SIEM Market Revenue (Million) Forecast, by Application 2019 & 2032
- Table 77: Argentina SIEM Market Revenue (Million) Forecast, by Application 2019 & 2032
- Table 78: Global SIEM Market Revenue Million Forecast, by Deployment 2019 & 2032
- Table 79: Global SIEM Market Revenue Million Forecast, by Organisation Type 2019 & 2032
- Table 80: Global SIEM Market Revenue Million Forecast, by End-user Industry 2019 & 2032
- Table 81: Global SIEM Market Revenue Million Forecast, by Country 2019 & 2032
- Table 82: United Arab Emirates SIEM Market Revenue (Million) Forecast, by Application 2019 & 2032
Frequently Asked Questions
1. What is the projected Compound Annual Growth Rate (CAGR) of the SIEM Market?
The projected CAGR is approximately 12.16%.
2. Which companies are prominent players in the SIEM Market?
Key companies in the market include Hewlett Packard Enterprise Compan, IBM Corporation, Fortinet Inc, McAfee LLC, Securonix Inc, Rapid7 Inc, LogRhythm Inc, RSA Security LLC (Dell Technologies), Open Text Corporation, Exabeam Inc, AlienVault Inc, Splunk Inc.
3. What are the main segments of the SIEM Market?
The market segments include Deployment, Organisation Type, End-user Industry.
4. Can you provide details about the market size?
The market size is estimated to be USD 9.61 Million as of 2022.
5. What are some drivers contributing to market growth?
Growth in Security Concerns; Increasing Adoption of BYOD.
6. What are the notable trends driving market growth?
Cloud to Witness Significant Growth.
7. Are there any restraints impacting market growth?
Lack of Skilled Labor.
8. Can you provide examples of recent developments in the market?
November 2023: IBM unveiled a major update to its enterprise-ready threat detection and response (QRadar) SIEM product. The product has been re-engineered on a cloud-native foundation, designed for hybrid cloud scalability, speed, and flexibility. IBM also announced plans to deliver generic AI capabilities across its threat detection and response product portfolio – leveraging Watsonx, its enterprise data & AI platform.
9. What pricing options are available for accessing the report?
Pricing options include single-user, multi-user, and enterprise licenses priced at USD 4750, USD 5250, and USD 8750 respectively.
10. Is the market size provided in terms of value or volume?
The market size is provided in terms of value, measured in Million.
11. Are there any specific market keywords associated with the report?
Yes, the market keyword associated with the report is "SIEM Market," which aids in identifying and referencing the specific market segment covered.
12. How do I determine which pricing option suits my needs best?
The pricing options vary based on user requirements and access needs. Individual users may opt for single-user licenses, while businesses requiring broader access may choose multi-user or enterprise licenses for cost-effective access to the report.
13. Are there any additional resources or data provided in the SIEM Market report?
While the report offers comprehensive insights, it's advisable to review the specific contents or supplementary materials provided to ascertain if additional resources or data are available.
14. How can I stay updated on further developments or reports in the SIEM Market?
To stay informed about further developments, trends, and reports in the SIEM Market, consider subscribing to industry newsletters, following relevant companies and organizations, or regularly checking reputable industry news sources and publications.
Methodology
Step 1 - Identification of Relevant Samples Size from Population Database


Step 2 - Approaches for Defining Global Market Size (Value, Volume* & Price*)

Note*: In applicable scenarios
Step 3 - Data Sources
Primary Research
- Web Analytics
- Survey Reports
- Research Institute
- Latest Research Reports
- Opinion Leaders
Secondary Research
- Annual Reports
- White Paper
- Latest Press Release
- Industry Association
- Paid Database
- Investor Presentations

Step 4 - Data Triangulation
Involves using different sources of information in order to increase the validity of a study
These sources are likely to be stakeholders in a program - participants, other researchers, program staff, other community members, and so on.
Then we put all data in single framework & apply various statistical tools to find out the dynamic on the market.
During the analysis stage, feedback from the stakeholder groups would be compared to determine areas of agreement as well as areas of divergence


