
Key Insights
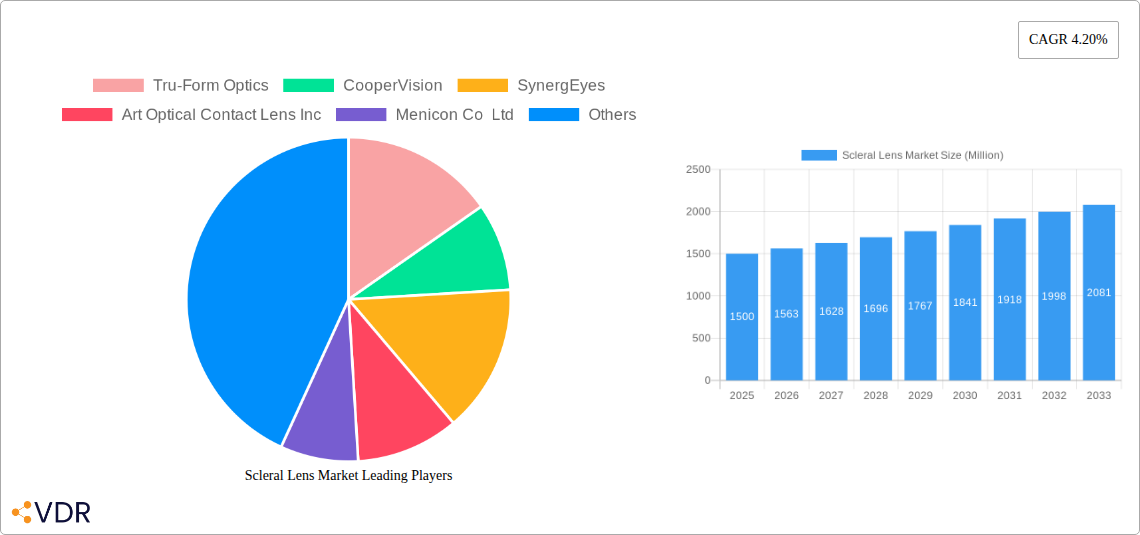
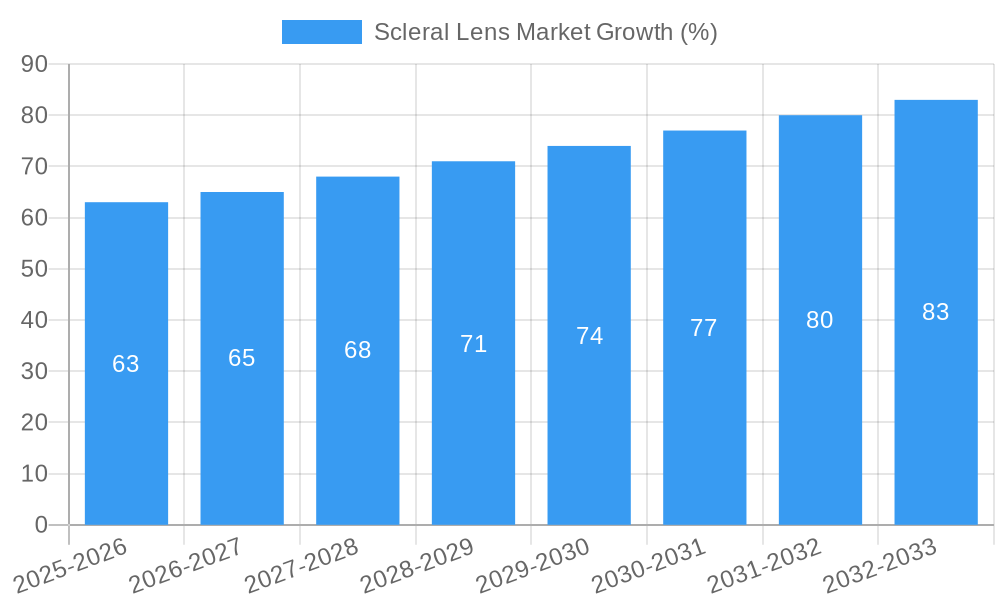
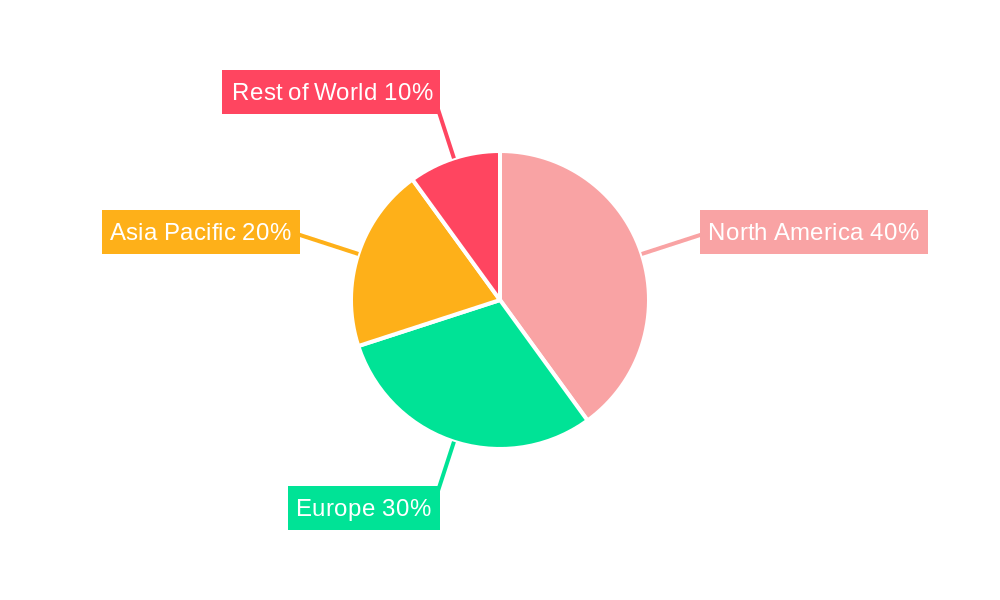
The global scleral lens market is experiencing robust growth, driven by a rising prevalence of corneal irregularities, ocular surface diseases, and refractive errors. The market's Compound Annual Growth Rate (CAGR) of 4.20% from 2019 to 2024 suggests a steady expansion, projected to continue through 2033. Several factors contribute to this growth, including advancements in scleral lens design and materials leading to improved comfort and vision correction, increased awareness among ophthalmologists and patients about the benefits of scleral lenses for complex eye conditions, and the growing geriatric population susceptible to age-related eye diseases. The market is segmented by application (irregular cornea, ocular surface disease, refractive error, and other applications), end-user (hospitals, eye clinics, and other end-users), and lens type (corneo-scleral and semi-scleral, mini-scleral, and full scleral). The full scleral lens segment currently dominates, owing to its superior performance in managing complex conditions. North America and Europe are currently leading regional markets due to higher healthcare spending and advanced medical infrastructure. However, the Asia-Pacific region is expected to witness significant growth in the coming years, fueled by increasing disposable incomes and rising awareness of eye care in developing economies. The competitive landscape includes established players like CooperVision, SynergEyes, and Menicon Co Ltd, alongside smaller, specialized companies innovating in lens design and materials.
The market's growth is, however, subject to certain restraints. High cost of scleral lenses compared to other vision correction methods, the need for specialized fitting and handling expertise, and potential complications associated with lens wear can limit market penetration. Further, regulatory hurdles and reimbursement challenges in certain regions pose additional barriers. Despite these challenges, continuous technological advancements, increasing investment in research and development, and growing patient demand are projected to offset these limitations and drive substantial market expansion throughout the forecast period. The focus is shifting towards personalized lens designs and improved materials that minimize complications and maximize patient comfort, ultimately fueling future market growth.
Scleral Lens Market: A Comprehensive Report (2019-2033)
This comprehensive report provides a detailed analysis of the Scleral Lens Market, encompassing market dynamics, growth trends, regional dominance, product landscape, key players, and future outlook. The report covers the period from 2019 to 2033, with a base year of 2025 and a forecast period of 2025-2033. The analysis delves into the parent market of ophthalmic devices and the child market of contact lenses, offering invaluable insights for industry professionals, investors, and stakeholders. The market size is presented in Million USD.
Scleral Lens Market Dynamics & Structure
The scleral lens market is characterized by a moderately concentrated landscape with several key players vying for market share. Technological innovation, particularly in lens materials and manufacturing processes, is a significant driver. Stringent regulatory frameworks governing medical devices influence market entry and product approval. Competition from alternative vision correction methods, such as refractive surgery, poses a challenge. The end-user demographic skews towards older patients with complex vision needs. M&A activity in the sector has been moderate, with a focus on strengthening product portfolios and expanding geographic reach.
- Market Concentration: Moderately concentrated, with top 5 players holding xx% market share in 2024.
- Technological Innovation: Focus on material advancements (e.g., silicone hydrogels) and manufacturing techniques for improved comfort and oxygen permeability.
- Regulatory Framework: Stringent FDA and CE mark requirements impacting market entry and product lifecycles.
- Competitive Substitutes: Refractive surgeries (LASIK, SMILE) pose a competitive threat.
- M&A Activity: xx M&A deals recorded between 2019 and 2024, primarily focused on expanding product lines. (Note: Specific data would be included in the full report.)
- Innovation Barriers: High R&D costs and lengthy regulatory approval processes hinder innovation.
Scleral Lens Market Growth Trends & Insights
The scleral lens market is experiencing robust growth, driven by increasing prevalence of corneal irregularities, ocular surface diseases, and refractive errors. Technological advancements leading to improved lens comfort, breathability, and vision correction capabilities further fuel adoption. The market is witnessing a shift towards mini-scleral and corneo-scleral lenses due to their improved comfort and handling. The CAGR during the forecast period (2025-2033) is projected to be xx%, with market penetration expected to increase from xx% in 2024 to xx% by 2033. Consumer behavior is increasingly influenced by improved patient experience and technologically advanced solutions. (Note: The full report will contain detailed data to support these claims.)
Dominant Regions, Countries, or Segments in Scleral Lens Market
North America currently dominates the scleral lens market, driven by high healthcare expenditure, advanced medical infrastructure, and high prevalence of ocular diseases. Europe follows as a significant market, showcasing consistent growth. Within the segments, the application of irregular cornea correction currently holds the largest market share, followed by ocular surface disease. Hospitals and eye clinics remain the primary end-users. Full scleral lenses constitute the largest type segment.
- Key Drivers (North America): High healthcare expenditure, well-developed healthcare infrastructure, increased awareness of vision correction options, and technological advancements.
- Key Drivers (Europe): Rising prevalence of ocular diseases, increasing adoption of advanced vision correction technologies, and expanding healthcare access.
- Market Share & Growth Potential: North America (xx%), Europe (xx%), Asia Pacific (xx%), Rest of World (xx%). (Note: Specific percentages would be detailed in the full report).
- Segment Dominance: Irregular Cornea (xx%), Ocular Surface Disease (xx%), Refractive Error (xx%), Other Applications (xx%).
Scleral Lens Market Product Landscape
The scleral lens market offers a range of products, including full scleral, mini-scleral, and corneo-scleral lenses, each designed to address specific patient needs and corneal irregularities. Innovations focus on enhanced oxygen permeability, improved material biocompatibility, and customized lens designs for superior comfort and vision correction. Unique selling propositions include advanced lens geometries, improved material breathability, and specialized designs for specific conditions.
Key Drivers, Barriers & Challenges in Scleral Lens Market
Key Drivers: Rising prevalence of corneal diseases and refractive errors, technological advancements improving comfort and efficacy, increasing awareness among patients and ophthalmologists, and favorable regulatory environments in some regions.
Challenges: High cost of scleral lenses limiting accessibility, complex fitting procedures requiring specialized expertise, potential complications associated with lens wear, and competition from other vision correction methods. The supply chain faced challenges in 2022 (xx% disruption), impacting the availability of raw materials.
Emerging Opportunities in Scleral Lens Market
Untapped markets in developing economies, expanding applications in pediatric ophthalmology, increasing demand for customized lens designs, and the integration of advanced technologies (e.g., smart lenses) offer significant growth opportunities. Furthermore, personalized lens design based on advanced imaging techniques presents a new frontier for market expansion.
Growth Accelerators in the Scleral Lens Market Industry
Strategic partnerships between lens manufacturers and eye care professionals, investment in R&D to develop next-generation materials, expansion into new geographical markets, and the increasing integration of telehealth platforms for remote patient management are all expected to accelerate long-term market growth. The integration of AI in lens design and fitting also represents a significant growth catalyst.
Key Players Shaping the Scleral Lens Market Market
- Tru-Form Optics
- CooperVision
- SynergEyes
- Art Optical Contact Lens Inc
- Menicon Co Ltd
- AccuLens Inc
- ABB Optical Group
- BostonSight
- Essilor
- Capricornia
- Visionary Optics
- Valley Contax
- Bausch Health Companies Inc
Notable Milestones in Scleral Lens Market Sector
- November 2021: CooperVision Specialty EyeCare launched Optimized Pupil Optics (OPO) for its Onefit MED and Onefit MED+ scleral contact lenses.
- October 2021: Bausch Health Companies Inc. launched the New 28 Lens Zenlens Dx Set.
In-Depth Scleral Lens Market Market Outlook
The scleral lens market is poised for sustained growth, driven by technological advancements, increasing prevalence of vision disorders, and expanding adoption among healthcare professionals. Strategic partnerships, market expansion into untapped regions, and innovations in lens materials and design will shape the future of this dynamic market, presenting significant opportunities for key players and new entrants alike. The market is expected to reach xx Million USD by 2033.
Scleral Lens Market Segmentation
-
1. Type
- 1.1. Corneo-scleral and Semi-scleral Lenses
- 1.2. Mini-Scleral Lenses
- 1.3. Full Scleral Lenses
-
2. Application
- 2.1. Irregular Cornea
- 2.2. Ocular Surface Disease
- 2.3. Refractive Error
- 2.4. Other Applications
-
3. End User
- 3.1. Hospitals
- 3.2. Eye Clinics
- 3.3. Other End Users
Scleral Lens Market Segmentation By Geography
-
1. North America
- 1.1. United States
- 1.2. Canada
- 1.3. Mexico
-
2. Europe
- 2.1. Germany
- 2.2. United Kingdom
- 2.3. France
- 2.4. Italy
- 2.5. Spain
- 2.6. Rest of Europe
-
3. Asia Pacific
- 3.1. China
- 3.2. Japan
- 3.3. India
- 3.4. Australia
- 3.5. South Korea
- 3.6. Rest of Asia Pacific
- 4. Rest of World
Scleral Lens Market REPORT HIGHLIGHTS
| Aspects | Details |
|---|---|
| Study Period | 2019-2033 |
| Base Year | 2024 |
| Estimated Year | 2025 |
| Forecast Period | 2025-2033 |
| Historical Period | 2019-2024 |
| Growth Rate | CAGR of 4.20% from 2019-2033 |
| Segmentation |
|
Table of Contents
- 1. Introduction
- 1.1. Research Scope
- 1.2. Market Segmentation
- 1.3. Research Methodology
- 1.4. Definitions and Assumptions
- 2. Executive Summary
- 2.1. Introduction
- 3. Market Dynamics
- 3.1. Introduction
- 3.2. Market Drivers
- 3.2.1. Growing Number of Ophthalmic Patients; Increasing Adoption of Scleral Lenses across the Globe
- 3.3. Market Restrains
- 3.3.1. Availability of Alternative Techniques
- 3.4. Market Trends
- 3.4.1. Corneo-scleral and Semi–scleral Lenses Segment is Expected to Dominate the Market
- 4. Market Factor Analysis
- 4.1. Porters Five Forces
- 4.2. Supply/Value Chain
- 4.3. PESTEL analysis
- 4.4. Market Entropy
- 4.5. Patent/Trademark Analysis
- 5. Global Scleral Lens Market Analysis, Insights and Forecast, 2019-2031
- 5.1. Market Analysis, Insights and Forecast - by Type
- 5.1.1. Corneo-scleral and Semi-scleral Lenses
- 5.1.2. Mini-Scleral Lenses
- 5.1.3. Full Scleral Lenses
- 5.2. Market Analysis, Insights and Forecast - by Application
- 5.2.1. Irregular Cornea
- 5.2.2. Ocular Surface Disease
- 5.2.3. Refractive Error
- 5.2.4. Other Applications
- 5.3. Market Analysis, Insights and Forecast - by End User
- 5.3.1. Hospitals
- 5.3.2. Eye Clinics
- 5.3.3. Other End Users
- 5.4. Market Analysis, Insights and Forecast - by Region
- 5.4.1. North America
- 5.4.2. Europe
- 5.4.3. Asia Pacific
- 5.4.4. Rest of World
- 5.1. Market Analysis, Insights and Forecast - by Type
- 6. North America Scleral Lens Market Analysis, Insights and Forecast, 2019-2031
- 6.1. Market Analysis, Insights and Forecast - by Type
- 6.1.1. Corneo-scleral and Semi-scleral Lenses
- 6.1.2. Mini-Scleral Lenses
- 6.1.3. Full Scleral Lenses
- 6.2. Market Analysis, Insights and Forecast - by Application
- 6.2.1. Irregular Cornea
- 6.2.2. Ocular Surface Disease
- 6.2.3. Refractive Error
- 6.2.4. Other Applications
- 6.3. Market Analysis, Insights and Forecast - by End User
- 6.3.1. Hospitals
- 6.3.2. Eye Clinics
- 6.3.3. Other End Users
- 6.1. Market Analysis, Insights and Forecast - by Type
- 7. Europe Scleral Lens Market Analysis, Insights and Forecast, 2019-2031
- 7.1. Market Analysis, Insights and Forecast - by Type
- 7.1.1. Corneo-scleral and Semi-scleral Lenses
- 7.1.2. Mini-Scleral Lenses
- 7.1.3. Full Scleral Lenses
- 7.2. Market Analysis, Insights and Forecast - by Application
- 7.2.1. Irregular Cornea
- 7.2.2. Ocular Surface Disease
- 7.2.3. Refractive Error
- 7.2.4. Other Applications
- 7.3. Market Analysis, Insights and Forecast - by End User
- 7.3.1. Hospitals
- 7.3.2. Eye Clinics
- 7.3.3. Other End Users
- 7.1. Market Analysis, Insights and Forecast - by Type
- 8. Asia Pacific Scleral Lens Market Analysis, Insights and Forecast, 2019-2031
- 8.1. Market Analysis, Insights and Forecast - by Type
- 8.1.1. Corneo-scleral and Semi-scleral Lenses
- 8.1.2. Mini-Scleral Lenses
- 8.1.3. Full Scleral Lenses
- 8.2. Market Analysis, Insights and Forecast - by Application
- 8.2.1. Irregular Cornea
- 8.2.2. Ocular Surface Disease
- 8.2.3. Refractive Error
- 8.2.4. Other Applications
- 8.3. Market Analysis, Insights and Forecast - by End User
- 8.3.1. Hospitals
- 8.3.2. Eye Clinics
- 8.3.3. Other End Users
- 8.1. Market Analysis, Insights and Forecast - by Type
- 9. Rest of World Scleral Lens Market Analysis, Insights and Forecast, 2019-2031
- 9.1. Market Analysis, Insights and Forecast - by Type
- 9.1.1. Corneo-scleral and Semi-scleral Lenses
- 9.1.2. Mini-Scleral Lenses
- 9.1.3. Full Scleral Lenses
- 9.2. Market Analysis, Insights and Forecast - by Application
- 9.2.1. Irregular Cornea
- 9.2.2. Ocular Surface Disease
- 9.2.3. Refractive Error
- 9.2.4. Other Applications
- 9.3. Market Analysis, Insights and Forecast - by End User
- 9.3.1. Hospitals
- 9.3.2. Eye Clinics
- 9.3.3. Other End Users
- 9.1. Market Analysis, Insights and Forecast - by Type
- 10. North America Scleral Lens Market Analysis, Insights and Forecast, 2019-2031
- 10.1. Market Analysis, Insights and Forecast - By Country/Sub-region
- 10.1.1 United States
- 10.1.2 Canada
- 10.1.3 Mexico
- 11. South America Scleral Lens Market Analysis, Insights and Forecast, 2019-2031
- 11.1. Market Analysis, Insights and Forecast - By Country/Sub-region
- 11.1.1 Brazil
- 11.1.2 Mexico
- 11.1.3 Rest of South America
- 12. Asia Pacific Scleral Lens Market Analysis, Insights and Forecast, 2019-2031
- 12.1. Market Analysis, Insights and Forecast - By Country/Sub-region
- 12.1.1 China
- 12.1.2 Japan
- 12.1.3 India
- 12.1.4 South Korea
- 12.1.5 Taiwan
- 12.1.6 Australia
- 12.1.7 Rest of Asia-Pacific
- 13. Europe Scleral Lens Market Analysis, Insights and Forecast, 2019-2031
- 13.1. Market Analysis, Insights and Forecast - By Country/Sub-region
- 13.1.1 Germany
- 13.1.2 United Kingdom
- 13.1.3 France
- 13.1.4 Italy
- 13.1.5 Spain
- 13.1.6 Rest of Europe
- 14. MEA Scleral Lens Market Analysis, Insights and Forecast, 2019-2031
- 14.1. Market Analysis, Insights and Forecast - By Country/Sub-region
- 14.1.1 Middle East
- 14.1.2 Africa
- 15. Competitive Analysis
- 15.1. Global Market Share Analysis 2024
- 15.2. Company Profiles
- 15.2.1 Tru-Form Optics
- 15.2.1.1. Overview
- 15.2.1.2. Products
- 15.2.1.3. SWOT Analysis
- 15.2.1.4. Recent Developments
- 15.2.1.5. Financials (Based on Availability)
- 15.2.2 CooperVision
- 15.2.2.1. Overview
- 15.2.2.2. Products
- 15.2.2.3. SWOT Analysis
- 15.2.2.4. Recent Developments
- 15.2.2.5. Financials (Based on Availability)
- 15.2.3 SynergEyes
- 15.2.3.1. Overview
- 15.2.3.2. Products
- 15.2.3.3. SWOT Analysis
- 15.2.3.4. Recent Developments
- 15.2.3.5. Financials (Based on Availability)
- 15.2.4 Art Optical Contact Lens Inc
- 15.2.4.1. Overview
- 15.2.4.2. Products
- 15.2.4.3. SWOT Analysis
- 15.2.4.4. Recent Developments
- 15.2.4.5. Financials (Based on Availability)
- 15.2.5 Menicon Co Ltd
- 15.2.5.1. Overview
- 15.2.5.2. Products
- 15.2.5.3. SWOT Analysis
- 15.2.5.4. Recent Developments
- 15.2.5.5. Financials (Based on Availability)
- 15.2.6 AccuLens Inc
- 15.2.6.1. Overview
- 15.2.6.2. Products
- 15.2.6.3. SWOT Analysis
- 15.2.6.4. Recent Developments
- 15.2.6.5. Financials (Based on Availability)
- 15.2.7 ABB Optical Group
- 15.2.7.1. Overview
- 15.2.7.2. Products
- 15.2.7.3. SWOT Analysis
- 15.2.7.4. Recent Developments
- 15.2.7.5. Financials (Based on Availability)
- 15.2.8 BostonSight
- 15.2.8.1. Overview
- 15.2.8.2. Products
- 15.2.8.3. SWOT Analysis
- 15.2.8.4. Recent Developments
- 15.2.8.5. Financials (Based on Availability)
- 15.2.9 Essilor
- 15.2.9.1. Overview
- 15.2.9.2. Products
- 15.2.9.3. SWOT Analysis
- 15.2.9.4. Recent Developments
- 15.2.9.5. Financials (Based on Availability)
- 15.2.10 Capricornia
- 15.2.10.1. Overview
- 15.2.10.2. Products
- 15.2.10.3. SWOT Analysis
- 15.2.10.4. Recent Developments
- 15.2.10.5. Financials (Based on Availability)
- 15.2.11 Visionary Optics
- 15.2.11.1. Overview
- 15.2.11.2. Products
- 15.2.11.3. SWOT Analysis
- 15.2.11.4. Recent Developments
- 15.2.11.5. Financials (Based on Availability)
- 15.2.12 Valley Contax
- 15.2.12.1. Overview
- 15.2.12.2. Products
- 15.2.12.3. SWOT Analysis
- 15.2.12.4. Recent Developments
- 15.2.12.5. Financials (Based on Availability)
- 15.2.13 Bausch Health Companies Inc
- 15.2.13.1. Overview
- 15.2.13.2. Products
- 15.2.13.3. SWOT Analysis
- 15.2.13.4. Recent Developments
- 15.2.13.5. Financials (Based on Availability)
- 15.2.1 Tru-Form Optics
List of Figures
- Figure 1: Global Scleral Lens Market Revenue Breakdown (Million, %) by Region 2024 & 2032
- Figure 2: Global Scleral Lens Market Volume Breakdown (K Units, %) by Region 2024 & 2032
- Figure 3: North America Scleral Lens Market Revenue (Million), by Country 2024 & 2032
- Figure 4: North America Scleral Lens Market Volume (K Units), by Country 2024 & 2032
- Figure 5: North America Scleral Lens Market Revenue Share (%), by Country 2024 & 2032
- Figure 6: North America Scleral Lens Market Volume Share (%), by Country 2024 & 2032
- Figure 7: South America Scleral Lens Market Revenue (Million), by Country 2024 & 2032
- Figure 8: South America Scleral Lens Market Volume (K Units), by Country 2024 & 2032
- Figure 9: South America Scleral Lens Market Revenue Share (%), by Country 2024 & 2032
- Figure 10: South America Scleral Lens Market Volume Share (%), by Country 2024 & 2032
- Figure 11: Asia Pacific Scleral Lens Market Revenue (Million), by Country 2024 & 2032
- Figure 12: Asia Pacific Scleral Lens Market Volume (K Units), by Country 2024 & 2032
- Figure 13: Asia Pacific Scleral Lens Market Revenue Share (%), by Country 2024 & 2032
- Figure 14: Asia Pacific Scleral Lens Market Volume Share (%), by Country 2024 & 2032
- Figure 15: Europe Scleral Lens Market Revenue (Million), by Country 2024 & 2032
- Figure 16: Europe Scleral Lens Market Volume (K Units), by Country 2024 & 2032
- Figure 17: Europe Scleral Lens Market Revenue Share (%), by Country 2024 & 2032
- Figure 18: Europe Scleral Lens Market Volume Share (%), by Country 2024 & 2032
- Figure 19: MEA Scleral Lens Market Revenue (Million), by Country 2024 & 2032
- Figure 20: MEA Scleral Lens Market Volume (K Units), by Country 2024 & 2032
- Figure 21: MEA Scleral Lens Market Revenue Share (%), by Country 2024 & 2032
- Figure 22: MEA Scleral Lens Market Volume Share (%), by Country 2024 & 2032
- Figure 23: North America Scleral Lens Market Revenue (Million), by Type 2024 & 2032
- Figure 24: North America Scleral Lens Market Volume (K Units), by Type 2024 & 2032
- Figure 25: North America Scleral Lens Market Revenue Share (%), by Type 2024 & 2032
- Figure 26: North America Scleral Lens Market Volume Share (%), by Type 2024 & 2032
- Figure 27: North America Scleral Lens Market Revenue (Million), by Application 2024 & 2032
- Figure 28: North America Scleral Lens Market Volume (K Units), by Application 2024 & 2032
- Figure 29: North America Scleral Lens Market Revenue Share (%), by Application 2024 & 2032
- Figure 30: North America Scleral Lens Market Volume Share (%), by Application 2024 & 2032
- Figure 31: North America Scleral Lens Market Revenue (Million), by End User 2024 & 2032
- Figure 32: North America Scleral Lens Market Volume (K Units), by End User 2024 & 2032
- Figure 33: North America Scleral Lens Market Revenue Share (%), by End User 2024 & 2032
- Figure 34: North America Scleral Lens Market Volume Share (%), by End User 2024 & 2032
- Figure 35: North America Scleral Lens Market Revenue (Million), by Country 2024 & 2032
- Figure 36: North America Scleral Lens Market Volume (K Units), by Country 2024 & 2032
- Figure 37: North America Scleral Lens Market Revenue Share (%), by Country 2024 & 2032
- Figure 38: North America Scleral Lens Market Volume Share (%), by Country 2024 & 2032
- Figure 39: Europe Scleral Lens Market Revenue (Million), by Type 2024 & 2032
- Figure 40: Europe Scleral Lens Market Volume (K Units), by Type 2024 & 2032
- Figure 41: Europe Scleral Lens Market Revenue Share (%), by Type 2024 & 2032
- Figure 42: Europe Scleral Lens Market Volume Share (%), by Type 2024 & 2032
- Figure 43: Europe Scleral Lens Market Revenue (Million), by Application 2024 & 2032
- Figure 44: Europe Scleral Lens Market Volume (K Units), by Application 2024 & 2032
- Figure 45: Europe Scleral Lens Market Revenue Share (%), by Application 2024 & 2032
- Figure 46: Europe Scleral Lens Market Volume Share (%), by Application 2024 & 2032
- Figure 47: Europe Scleral Lens Market Revenue (Million), by End User 2024 & 2032
- Figure 48: Europe Scleral Lens Market Volume (K Units), by End User 2024 & 2032
- Figure 49: Europe Scleral Lens Market Revenue Share (%), by End User 2024 & 2032
- Figure 50: Europe Scleral Lens Market Volume Share (%), by End User 2024 & 2032
- Figure 51: Europe Scleral Lens Market Revenue (Million), by Country 2024 & 2032
- Figure 52: Europe Scleral Lens Market Volume (K Units), by Country 2024 & 2032
- Figure 53: Europe Scleral Lens Market Revenue Share (%), by Country 2024 & 2032
- Figure 54: Europe Scleral Lens Market Volume Share (%), by Country 2024 & 2032
- Figure 55: Asia Pacific Scleral Lens Market Revenue (Million), by Type 2024 & 2032
- Figure 56: Asia Pacific Scleral Lens Market Volume (K Units), by Type 2024 & 2032
- Figure 57: Asia Pacific Scleral Lens Market Revenue Share (%), by Type 2024 & 2032
- Figure 58: Asia Pacific Scleral Lens Market Volume Share (%), by Type 2024 & 2032
- Figure 59: Asia Pacific Scleral Lens Market Revenue (Million), by Application 2024 & 2032
- Figure 60: Asia Pacific Scleral Lens Market Volume (K Units), by Application 2024 & 2032
- Figure 61: Asia Pacific Scleral Lens Market Revenue Share (%), by Application 2024 & 2032
- Figure 62: Asia Pacific Scleral Lens Market Volume Share (%), by Application 2024 & 2032
- Figure 63: Asia Pacific Scleral Lens Market Revenue (Million), by End User 2024 & 2032
- Figure 64: Asia Pacific Scleral Lens Market Volume (K Units), by End User 2024 & 2032
- Figure 65: Asia Pacific Scleral Lens Market Revenue Share (%), by End User 2024 & 2032
- Figure 66: Asia Pacific Scleral Lens Market Volume Share (%), by End User 2024 & 2032
- Figure 67: Asia Pacific Scleral Lens Market Revenue (Million), by Country 2024 & 2032
- Figure 68: Asia Pacific Scleral Lens Market Volume (K Units), by Country 2024 & 2032
- Figure 69: Asia Pacific Scleral Lens Market Revenue Share (%), by Country 2024 & 2032
- Figure 70: Asia Pacific Scleral Lens Market Volume Share (%), by Country 2024 & 2032
- Figure 71: Rest of World Scleral Lens Market Revenue (Million), by Type 2024 & 2032
- Figure 72: Rest of World Scleral Lens Market Volume (K Units), by Type 2024 & 2032
- Figure 73: Rest of World Scleral Lens Market Revenue Share (%), by Type 2024 & 2032
- Figure 74: Rest of World Scleral Lens Market Volume Share (%), by Type 2024 & 2032
- Figure 75: Rest of World Scleral Lens Market Revenue (Million), by Application 2024 & 2032
- Figure 76: Rest of World Scleral Lens Market Volume (K Units), by Application 2024 & 2032
- Figure 77: Rest of World Scleral Lens Market Revenue Share (%), by Application 2024 & 2032
- Figure 78: Rest of World Scleral Lens Market Volume Share (%), by Application 2024 & 2032
- Figure 79: Rest of World Scleral Lens Market Revenue (Million), by End User 2024 & 2032
- Figure 80: Rest of World Scleral Lens Market Volume (K Units), by End User 2024 & 2032
- Figure 81: Rest of World Scleral Lens Market Revenue Share (%), by End User 2024 & 2032
- Figure 82: Rest of World Scleral Lens Market Volume Share (%), by End User 2024 & 2032
- Figure 83: Rest of World Scleral Lens Market Revenue (Million), by Country 2024 & 2032
- Figure 84: Rest of World Scleral Lens Market Volume (K Units), by Country 2024 & 2032
- Figure 85: Rest of World Scleral Lens Market Revenue Share (%), by Country 2024 & 2032
- Figure 86: Rest of World Scleral Lens Market Volume Share (%), by Country 2024 & 2032
List of Tables
- Table 1: Global Scleral Lens Market Revenue Million Forecast, by Region 2019 & 2032
- Table 2: Global Scleral Lens Market Volume K Units Forecast, by Region 2019 & 2032
- Table 3: Global Scleral Lens Market Revenue Million Forecast, by Type 2019 & 2032
- Table 4: Global Scleral Lens Market Volume K Units Forecast, by Type 2019 & 2032
- Table 5: Global Scleral Lens Market Revenue Million Forecast, by Application 2019 & 2032
- Table 6: Global Scleral Lens Market Volume K Units Forecast, by Application 2019 & 2032
- Table 7: Global Scleral Lens Market Revenue Million Forecast, by End User 2019 & 2032
- Table 8: Global Scleral Lens Market Volume K Units Forecast, by End User 2019 & 2032
- Table 9: Global Scleral Lens Market Revenue Million Forecast, by Region 2019 & 2032
- Table 10: Global Scleral Lens Market Volume K Units Forecast, by Region 2019 & 2032
- Table 11: Global Scleral Lens Market Revenue Million Forecast, by Country 2019 & 2032
- Table 12: Global Scleral Lens Market Volume K Units Forecast, by Country 2019 & 2032
- Table 13: United States Scleral Lens Market Revenue (Million) Forecast, by Application 2019 & 2032
- Table 14: United States Scleral Lens Market Volume (K Units) Forecast, by Application 2019 & 2032
- Table 15: Canada Scleral Lens Market Revenue (Million) Forecast, by Application 2019 & 2032
- Table 16: Canada Scleral Lens Market Volume (K Units) Forecast, by Application 2019 & 2032
- Table 17: Mexico Scleral Lens Market Revenue (Million) Forecast, by Application 2019 & 2032
- Table 18: Mexico Scleral Lens Market Volume (K Units) Forecast, by Application 2019 & 2032
- Table 19: Global Scleral Lens Market Revenue Million Forecast, by Country 2019 & 2032
- Table 20: Global Scleral Lens Market Volume K Units Forecast, by Country 2019 & 2032
- Table 21: Brazil Scleral Lens Market Revenue (Million) Forecast, by Application 2019 & 2032
- Table 22: Brazil Scleral Lens Market Volume (K Units) Forecast, by Application 2019 & 2032
- Table 23: Mexico Scleral Lens Market Revenue (Million) Forecast, by Application 2019 & 2032
- Table 24: Mexico Scleral Lens Market Volume (K Units) Forecast, by Application 2019 & 2032
- Table 25: Rest of South America Scleral Lens Market Revenue (Million) Forecast, by Application 2019 & 2032
- Table 26: Rest of South America Scleral Lens Market Volume (K Units) Forecast, by Application 2019 & 2032
- Table 27: Global Scleral Lens Market Revenue Million Forecast, by Country 2019 & 2032
- Table 28: Global Scleral Lens Market Volume K Units Forecast, by Country 2019 & 2032
- Table 29: China Scleral Lens Market Revenue (Million) Forecast, by Application 2019 & 2032
- Table 30: China Scleral Lens Market Volume (K Units) Forecast, by Application 2019 & 2032
- Table 31: Japan Scleral Lens Market Revenue (Million) Forecast, by Application 2019 & 2032
- Table 32: Japan Scleral Lens Market Volume (K Units) Forecast, by Application 2019 & 2032
- Table 33: India Scleral Lens Market Revenue (Million) Forecast, by Application 2019 & 2032
- Table 34: India Scleral Lens Market Volume (K Units) Forecast, by Application 2019 & 2032
- Table 35: South Korea Scleral Lens Market Revenue (Million) Forecast, by Application 2019 & 2032
- Table 36: South Korea Scleral Lens Market Volume (K Units) Forecast, by Application 2019 & 2032
- Table 37: Taiwan Scleral Lens Market Revenue (Million) Forecast, by Application 2019 & 2032
- Table 38: Taiwan Scleral Lens Market Volume (K Units) Forecast, by Application 2019 & 2032
- Table 39: Australia Scleral Lens Market Revenue (Million) Forecast, by Application 2019 & 2032
- Table 40: Australia Scleral Lens Market Volume (K Units) Forecast, by Application 2019 & 2032
- Table 41: Rest of Asia-Pacific Scleral Lens Market Revenue (Million) Forecast, by Application 2019 & 2032
- Table 42: Rest of Asia-Pacific Scleral Lens Market Volume (K Units) Forecast, by Application 2019 & 2032
- Table 43: Global Scleral Lens Market Revenue Million Forecast, by Country 2019 & 2032
- Table 44: Global Scleral Lens Market Volume K Units Forecast, by Country 2019 & 2032
- Table 45: Germany Scleral Lens Market Revenue (Million) Forecast, by Application 2019 & 2032
- Table 46: Germany Scleral Lens Market Volume (K Units) Forecast, by Application 2019 & 2032
- Table 47: United Kingdom Scleral Lens Market Revenue (Million) Forecast, by Application 2019 & 2032
- Table 48: United Kingdom Scleral Lens Market Volume (K Units) Forecast, by Application 2019 & 2032
- Table 49: France Scleral Lens Market Revenue (Million) Forecast, by Application 2019 & 2032
- Table 50: France Scleral Lens Market Volume (K Units) Forecast, by Application 2019 & 2032
- Table 51: Italy Scleral Lens Market Revenue (Million) Forecast, by Application 2019 & 2032
- Table 52: Italy Scleral Lens Market Volume (K Units) Forecast, by Application 2019 & 2032
- Table 53: Spain Scleral Lens Market Revenue (Million) Forecast, by Application 2019 & 2032
- Table 54: Spain Scleral Lens Market Volume (K Units) Forecast, by Application 2019 & 2032
- Table 55: Rest of Europe Scleral Lens Market Revenue (Million) Forecast, by Application 2019 & 2032
- Table 56: Rest of Europe Scleral Lens Market Volume (K Units) Forecast, by Application 2019 & 2032
- Table 57: Global Scleral Lens Market Revenue Million Forecast, by Country 2019 & 2032
- Table 58: Global Scleral Lens Market Volume K Units Forecast, by Country 2019 & 2032
- Table 59: Middle East Scleral Lens Market Revenue (Million) Forecast, by Application 2019 & 2032
- Table 60: Middle East Scleral Lens Market Volume (K Units) Forecast, by Application 2019 & 2032
- Table 61: Africa Scleral Lens Market Revenue (Million) Forecast, by Application 2019 & 2032
- Table 62: Africa Scleral Lens Market Volume (K Units) Forecast, by Application 2019 & 2032
- Table 63: Global Scleral Lens Market Revenue Million Forecast, by Type 2019 & 2032
- Table 64: Global Scleral Lens Market Volume K Units Forecast, by Type 2019 & 2032
- Table 65: Global Scleral Lens Market Revenue Million Forecast, by Application 2019 & 2032
- Table 66: Global Scleral Lens Market Volume K Units Forecast, by Application 2019 & 2032
- Table 67: Global Scleral Lens Market Revenue Million Forecast, by End User 2019 & 2032
- Table 68: Global Scleral Lens Market Volume K Units Forecast, by End User 2019 & 2032
- Table 69: Global Scleral Lens Market Revenue Million Forecast, by Country 2019 & 2032
- Table 70: Global Scleral Lens Market Volume K Units Forecast, by Country 2019 & 2032
- Table 71: United States Scleral Lens Market Revenue (Million) Forecast, by Application 2019 & 2032
- Table 72: United States Scleral Lens Market Volume (K Units) Forecast, by Application 2019 & 2032
- Table 73: Canada Scleral Lens Market Revenue (Million) Forecast, by Application 2019 & 2032
- Table 74: Canada Scleral Lens Market Volume (K Units) Forecast, by Application 2019 & 2032
- Table 75: Mexico Scleral Lens Market Revenue (Million) Forecast, by Application 2019 & 2032
- Table 76: Mexico Scleral Lens Market Volume (K Units) Forecast, by Application 2019 & 2032
- Table 77: Global Scleral Lens Market Revenue Million Forecast, by Type 2019 & 2032
- Table 78: Global Scleral Lens Market Volume K Units Forecast, by Type 2019 & 2032
- Table 79: Global Scleral Lens Market Revenue Million Forecast, by Application 2019 & 2032
- Table 80: Global Scleral Lens Market Volume K Units Forecast, by Application 2019 & 2032
- Table 81: Global Scleral Lens Market Revenue Million Forecast, by End User 2019 & 2032
- Table 82: Global Scleral Lens Market Volume K Units Forecast, by End User 2019 & 2032
- Table 83: Global Scleral Lens Market Revenue Million Forecast, by Country 2019 & 2032
- Table 84: Global Scleral Lens Market Volume K Units Forecast, by Country 2019 & 2032
- Table 85: Germany Scleral Lens Market Revenue (Million) Forecast, by Application 2019 & 2032
- Table 86: Germany Scleral Lens Market Volume (K Units) Forecast, by Application 2019 & 2032
- Table 87: United Kingdom Scleral Lens Market Revenue (Million) Forecast, by Application 2019 & 2032
- Table 88: United Kingdom Scleral Lens Market Volume (K Units) Forecast, by Application 2019 & 2032
- Table 89: France Scleral Lens Market Revenue (Million) Forecast, by Application 2019 & 2032
- Table 90: France Scleral Lens Market Volume (K Units) Forecast, by Application 2019 & 2032
- Table 91: Italy Scleral Lens Market Revenue (Million) Forecast, by Application 2019 & 2032
- Table 92: Italy Scleral Lens Market Volume (K Units) Forecast, by Application 2019 & 2032
- Table 93: Spain Scleral Lens Market Revenue (Million) Forecast, by Application 2019 & 2032
- Table 94: Spain Scleral Lens Market Volume (K Units) Forecast, by Application 2019 & 2032
- Table 95: Rest of Europe Scleral Lens Market Revenue (Million) Forecast, by Application 2019 & 2032
- Table 96: Rest of Europe Scleral Lens Market Volume (K Units) Forecast, by Application 2019 & 2032
- Table 97: Global Scleral Lens Market Revenue Million Forecast, by Type 2019 & 2032
- Table 98: Global Scleral Lens Market Volume K Units Forecast, by Type 2019 & 2032
- Table 99: Global Scleral Lens Market Revenue Million Forecast, by Application 2019 & 2032
- Table 100: Global Scleral Lens Market Volume K Units Forecast, by Application 2019 & 2032
- Table 101: Global Scleral Lens Market Revenue Million Forecast, by End User 2019 & 2032
- Table 102: Global Scleral Lens Market Volume K Units Forecast, by End User 2019 & 2032
- Table 103: Global Scleral Lens Market Revenue Million Forecast, by Country 2019 & 2032
- Table 104: Global Scleral Lens Market Volume K Units Forecast, by Country 2019 & 2032
- Table 105: China Scleral Lens Market Revenue (Million) Forecast, by Application 2019 & 2032
- Table 106: China Scleral Lens Market Volume (K Units) Forecast, by Application 2019 & 2032
- Table 107: Japan Scleral Lens Market Revenue (Million) Forecast, by Application 2019 & 2032
- Table 108: Japan Scleral Lens Market Volume (K Units) Forecast, by Application 2019 & 2032
- Table 109: India Scleral Lens Market Revenue (Million) Forecast, by Application 2019 & 2032
- Table 110: India Scleral Lens Market Volume (K Units) Forecast, by Application 2019 & 2032
- Table 111: Australia Scleral Lens Market Revenue (Million) Forecast, by Application 2019 & 2032
- Table 112: Australia Scleral Lens Market Volume (K Units) Forecast, by Application 2019 & 2032
- Table 113: South Korea Scleral Lens Market Revenue (Million) Forecast, by Application 2019 & 2032
- Table 114: South Korea Scleral Lens Market Volume (K Units) Forecast, by Application 2019 & 2032
- Table 115: Rest of Asia Pacific Scleral Lens Market Revenue (Million) Forecast, by Application 2019 & 2032
- Table 116: Rest of Asia Pacific Scleral Lens Market Volume (K Units) Forecast, by Application 2019 & 2032
- Table 117: Global Scleral Lens Market Revenue Million Forecast, by Type 2019 & 2032
- Table 118: Global Scleral Lens Market Volume K Units Forecast, by Type 2019 & 2032
- Table 119: Global Scleral Lens Market Revenue Million Forecast, by Application 2019 & 2032
- Table 120: Global Scleral Lens Market Volume K Units Forecast, by Application 2019 & 2032
- Table 121: Global Scleral Lens Market Revenue Million Forecast, by End User 2019 & 2032
- Table 122: Global Scleral Lens Market Volume K Units Forecast, by End User 2019 & 2032
- Table 123: Global Scleral Lens Market Revenue Million Forecast, by Country 2019 & 2032
- Table 124: Global Scleral Lens Market Volume K Units Forecast, by Country 2019 & 2032
Frequently Asked Questions
1. What is the projected Compound Annual Growth Rate (CAGR) of the Scleral Lens Market?
The projected CAGR is approximately 4.20%.
2. Which companies are prominent players in the Scleral Lens Market?
Key companies in the market include Tru-Form Optics, CooperVision, SynergEyes, Art Optical Contact Lens Inc, Menicon Co Ltd, AccuLens Inc, ABB Optical Group, BostonSight, Essilor, Capricornia, Visionary Optics, Valley Contax, Bausch Health Companies Inc.
3. What are the main segments of the Scleral Lens Market?
The market segments include Type, Application, End User.
4. Can you provide details about the market size?
The market size is estimated to be USD XX Million as of 2022.
5. What are some drivers contributing to market growth?
Growing Number of Ophthalmic Patients; Increasing Adoption of Scleral Lenses across the Globe.
6. What are the notable trends driving market growth?
Corneo-scleral and Semi–scleral Lenses Segment is Expected to Dominate the Market.
7. Are there any restraints impacting market growth?
Availability of Alternative Techniques.
8. Can you provide examples of recent developments in the market?
In November 2021, CooperVision Specialty EyeCare launched Optimized Pupil Optics (OPO) for its Onefit MED and Onefit MED+ scleral contact lenses to eye care providers (ECPs) in the United States and Canada.
9. What pricing options are available for accessing the report?
Pricing options include single-user, multi-user, and enterprise licenses priced at USD 4750, USD 5250, and USD 8750 respectively.
10. Is the market size provided in terms of value or volume?
The market size is provided in terms of value, measured in Million and volume, measured in K Units.
11. Are there any specific market keywords associated with the report?
Yes, the market keyword associated with the report is "Scleral Lens Market," which aids in identifying and referencing the specific market segment covered.
12. How do I determine which pricing option suits my needs best?
The pricing options vary based on user requirements and access needs. Individual users may opt for single-user licenses, while businesses requiring broader access may choose multi-user or enterprise licenses for cost-effective access to the report.
13. Are there any additional resources or data provided in the Scleral Lens Market report?
While the report offers comprehensive insights, it's advisable to review the specific contents or supplementary materials provided to ascertain if additional resources or data are available.
14. How can I stay updated on further developments or reports in the Scleral Lens Market?
To stay informed about further developments, trends, and reports in the Scleral Lens Market, consider subscribing to industry newsletters, following relevant companies and organizations, or regularly checking reputable industry news sources and publications.
Methodology
Step 1 - Identification of Relevant Samples Size from Population Database


Step 2 - Approaches for Defining Global Market Size (Value, Volume* & Price*)

Note*: In applicable scenarios
Step 3 - Data Sources
Primary Research
- Web Analytics
- Survey Reports
- Research Institute
- Latest Research Reports
- Opinion Leaders
Secondary Research
- Annual Reports
- White Paper
- Latest Press Release
- Industry Association
- Paid Database
- Investor Presentations

Step 4 - Data Triangulation
Involves using different sources of information in order to increase the validity of a study
These sources are likely to be stakeholders in a program - participants, other researchers, program staff, other community members, and so on.
Then we put all data in single framework & apply various statistical tools to find out the dynamic on the market.
During the analysis stage, feedback from the stakeholder groups would be compared to determine areas of agreement as well as areas of divergence


