
Key Insights
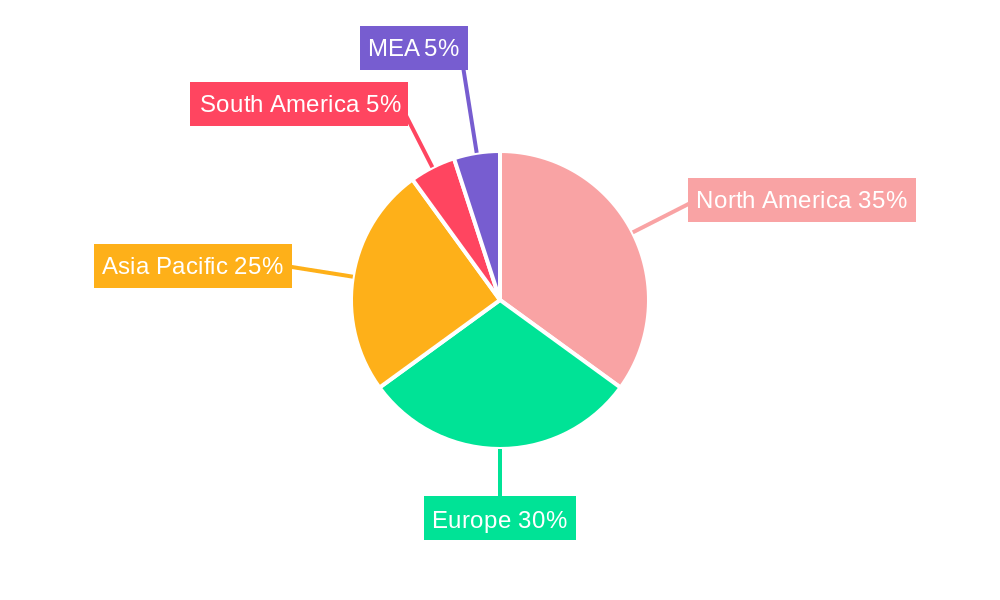
The global robotic sensors market, valued at $0.67 billion in 2025, is projected to experience robust growth, driven by the increasing adoption of automation across various industries. A compound annual growth rate (CAGR) of 8.66% from 2025 to 2033 signifies a significant expansion, fueled by several key factors. The rising demand for sophisticated industrial robots across manufacturing, automotive, and logistics sectors is a primary driver. Furthermore, advancements in sensor technology, such as the development of more compact, precise, and cost-effective sensors, are accelerating market growth. The increasing need for enhanced safety features in robotic systems, particularly in collaborative robots (cobots), further contributes to the market's expansion. The diverse range of sensor types available, including force/torque, temperature, pressure, position, proximity, and vision sensors, caters to the specific needs of various applications, fostering market growth across different segments. Segmentation by end-user reveals manufacturing and automotive as dominant sectors, reflecting the high levels of automation prevalent in these industries. The increasing integration of advanced sensors into robotics enhances functionalities like object recognition, precise manipulation, and environmental awareness, driving the demand for higher-performance and more sophisticated sensors. Geographical analysis indicates North America and Europe as major market contributors, reflecting the high concentration of robotics and automation industries in these regions. However, the Asia-Pacific region is poised for substantial growth due to increasing industrialization and government support for technological advancements in robotics.
The market's growth trajectory is not without challenges. Factors such as the high initial investment cost associated with implementing robotic sensor technology and the need for skilled labor for installation and maintenance can act as restraints. However, ongoing technological advancements, cost reductions, and increasing government support for automation initiatives are expected to mitigate these challenges. The integration of artificial intelligence (AI) and machine learning (ML) into robotic sensor systems will further propel the market's growth by enabling more advanced functionalities and autonomous decision-making capabilities. Emerging applications of robotic sensors in fields like healthcare and agriculture are also expected to contribute to market expansion in the coming years. Competitive analysis reveals a landscape dominated by established players like Tekscan, Infineon Technologies, Honeywell, and Sensata, alongside several other prominent companies. The market is expected to see increased competition as new players enter the market with innovative products and solutions.

Robotic Sensors Market: A Comprehensive Report (2019-2033)
This comprehensive report provides a detailed analysis of the Robotic Sensors Market, encompassing market dynamics, growth trends, regional insights, and competitive landscapes. The study period spans from 2019 to 2033, with 2025 serving as the base and estimated year. The report meticulously examines the parent market (Robotics Market) and its child market (Robotic Sensors), offering invaluable insights for industry professionals, investors, and stakeholders. The market size is predicted to reach xx Million units by 2033.
Target Audience: Robotics manufacturers, sensor manufacturers, automation solution providers, research institutions, investors, and government agencies.
Robotic Sensors Market Dynamics & Structure
The Robotic Sensors Market is characterized by moderate concentration, with key players holding significant market share. Technological innovation, particularly in areas like AI-powered vision sensors and miniaturization, is a primary growth driver. Stringent safety and performance standards, along with evolving data privacy regulations, constitute the regulatory framework. Competitive substitutes include alternative sensing technologies like image processing and ultrasonic sensors. The end-user demographic is expanding rapidly, encompassing diverse sectors like manufacturing, automotive, and logistics. M&A activity in the sensor industry remains consistent, with an estimated xx number of deals concluded in the last 5 years, predominantly driven by the need for technological enhancement and market expansion.
- Market Concentration: Moderately concentrated, with top 10 players holding approximately xx% market share (2024).
- Technological Innovation: Focus on AI, miniaturization, improved accuracy, and energy efficiency.
- Regulatory Framework: Stringent safety standards (e.g., ISO 13482) and increasing data privacy concerns.
- Competitive Substitutes: Image processing systems, ultrasonic sensors, lidar.
- End-User Demographics: Significant growth in manufacturing, automotive, and logistics sectors.
- M&A Trends: Consistent activity, driven by technological acquisition and market consolidation.
Robotic Sensors Market Growth Trends & Insights
The Robotic Sensors Market is experiencing robust growth, fueled by the increasing adoption of automation across various industries. The market size expanded from xx Million units in 2019 to xx Million units in 2024, exhibiting a CAGR of xx% during the historical period. This growth trajectory is expected to continue, with a projected CAGR of xx% during the forecast period (2025-2033), leading to a market size of xx Million units by 2033. Technological disruptions, such as the integration of AI and IoT, are driving higher adoption rates, especially in advanced robotics applications. Consumer behavior shifts toward increased demand for automated systems are further bolstering market expansion.

Dominant Regions, Countries, or Segments in Robotic Sensors Market
The Manufacturing sector currently dominates the end-user segment, accounting for xx% of the market in 2024, primarily due to the high demand for automation in production lines. The Automotive segment shows significant growth potential, driven by the rising adoption of advanced driver-assistance systems (ADAS) and autonomous vehicles. Geographically, North America and Asia-Pacific are the leading regions, with North America holding the largest market share in 2024, driven by robust industrial automation adoption. Asia-Pacific, particularly China and Japan, exhibits strong growth potential, owing to government initiatives promoting automation and a substantial manufacturing base. In terms of sensor types, vision sensors are leading the market, followed by force/torque sensors due to their crucial role in precision robotic manipulation.
- Leading Region: North America (xx% market share in 2024)
- High-Growth Region: Asia-Pacific (xx% projected CAGR during 2025-2033)
- Leading End-User Segment: Manufacturing (xx% market share in 2024)
- High-Growth End-User Segment: Automotive (xx% projected CAGR during 2025-2033)
- Leading Sensor Type: Vision Sensors
- High-Growth Sensor Type: Proximity Sensors
Robotic Sensors Market Product Landscape
The Robotic Sensors market showcases a diverse range of products catering to various robotic applications. Innovations focus on improved accuracy, miniaturization, enhanced durability, and integration with advanced control systems. Force/torque sensors with higher sensitivity and wider measurement ranges are gaining popularity, enabling more precise robotic manipulation. Vision sensors with advanced image processing capabilities and improved resolution are transforming robotic perception. Unique selling propositions include superior accuracy, real-time data processing, and robust designs to withstand harsh industrial environments.
Key Drivers, Barriers & Challenges in Robotic Sensors Market
Key Drivers: The robotic sensors market is experiencing robust growth fueled by several key factors. The increasing demand for automation across diverse industries, from manufacturing and logistics to healthcare and agriculture, is a primary driver. Technological advancements, particularly in artificial intelligence (AI) and the Internet of Things (IoT), are enhancing sensor capabilities and creating new applications. Government initiatives worldwide are actively promoting automation and robotics, further stimulating market expansion. Significant investments in robotics research and development (R&D) are also contributing to the development of more sophisticated and effective sensors. For example, the integration of AI in vision systems significantly enhances object recognition and manipulation, fueling demand for advanced sensors capable of handling complex tasks.
Key Challenges: Despite the positive outlook, the market faces significant challenges. High initial investment costs associated with robotic sensor integration can be a barrier to entry for smaller companies. The complexities involved in integrating diverse sensor systems into existing robotic infrastructures present another hurdle. A shortage of skilled labor capable of designing, implementing, and maintaining these systems is also a significant constraint. Supply chain disruptions, particularly concerning semiconductor shortages, continue to pose a major risk, potentially impacting production timelines and overall market growth. These disruptions can cause significant delays and cost overruns, potentially affecting market growth by an estimated percentage (quantifiable data needed here).
Emerging Opportunities in Robotic Sensors Market
Despite the challenges, several emerging opportunities promise substantial growth for the robotic sensors market. Advanced sensor fusion technologies, which integrate multiple sensor modalities (e.g., vision, proximity, force) to create a more comprehensive and accurate perception of the robot's environment, represent a significant area of opportunity. The expansion into new application areas, such as minimally invasive surgery in healthcare and precision agriculture, offers substantial growth potential. The increasing adoption of collaborative robots (cobots) which work alongside humans, necessitates safe and reliable sensors that facilitate seamless human-robot interaction and enhance safety protocols. This demand for cobot-specific sensors is driving innovation and market expansion in this niche.
Growth Accelerators in the Robotic Sensors Market Industry
Several factors are accelerating growth within the robotic sensors market. Technological breakthroughs, such as the miniaturization of sensors leading to smaller, more adaptable robotic systems, and the development of sensors with enhanced sensitivity and accuracy, are key drivers. Strategic partnerships between sensor manufacturers and robotics companies are fostering innovation and facilitating faster market penetration. Government initiatives promoting automation and the expansion of robotic applications into new sectors (e.g., infrastructure inspection, disaster relief) are further stimulating long-term growth. Furthermore, the development of standardized interfaces and communication protocols will streamline integration processes and make robotic systems more accessible.
Key Players Shaping the Robotic Sensors Market Market
- Tekscan Inc
- Infineon Technologies AG
- Honeywell International Inc
- Sensata Technologies Inc
- FANUC Corporation
- ATI Industrial Automation (Novanta Inc)
- TE Connectivity Ltd
- FUTEK Advanced Sensor Technology Inc
- OMRON Corporation
- Baumer Group
Notable Milestones in Robotic Sensors Market Sector
- October 2023: Nvidia and Segway-Ninebot launch a robotics development platform featuring advanced sensors, accelerating AMR development.
- August 2023: ATI Industrial Automation announces compatibility of its Multi-Axis Force/Torque Sensors with FANUC robots, enhancing precision control in robotic applications.
In-Depth Robotic Sensors Market Market Outlook
The robotic sensors market exhibits a strong trajectory for substantial growth. Ongoing technological advancements, expanding automation adoption across various sectors, and continuous investments in robotics research contribute significantly to this positive outlook. Strategic partnerships, fostering collaboration and innovation, and the expansion of robotic applications into untapped markets are further fueling market expansion. The long-term outlook remains exceptionally positive, with significant market potential across diverse industry applications. The market's growth will be shaped by the continued development of more sophisticated sensors, improved integration capabilities, and a growing demand for automation in an increasingly diverse range of applications. This includes addressing current challenges like reducing costs, simplifying integration processes, and enhancing workforce training programs focused on robotics and sensor technologies.
Robotic Sensors Market Segmentation
-
1. Type
- 1.1. Force and Torque Sensor
- 1.2. Temperature Sensor
- 1.3. Pressure Sensor
- 1.4. Position Sensor
- 1.5. Proximity Sensor
- 1.6. Vision Sensor
- 1.7. Other Type of Sensors
-
2. End User
- 2.1. Manufacturing
- 2.2. Automotive
- 2.3. Process and Packaging
- 2.4. Logistics
- 2.5. Other End Users
Robotic Sensors Market Segmentation By Geography
- 1. North America
- 2. Europe
- 3. Asia Pacific
- 4. Rest of the World
Robotic Sensors Market REPORT HIGHLIGHTS
| Aspects | Details |
|---|---|
| Study Period | 2019-2033 |
| Base Year | 2024 |
| Estimated Year | 2025 |
| Forecast Period | 2025-2033 |
| Historical Period | 2019-2024 |
| Growth Rate | CAGR of 8.66% from 2019-2033 |
| Segmentation |
|
Table of Contents
- 1. Introduction
- 1.1. Research Scope
- 1.2. Market Segmentation
- 1.3. Research Methodology
- 1.4. Definitions and Assumptions
- 2. Executive Summary
- 2.1. Introduction
- 3. Market Dynamics
- 3.1. Introduction
- 3.2. Market Drivers
- 3.2.1. Surge in Demand for Industrial Robotics; Increased Adoption of Robots in Logistics and Transportation Application; Technological Advancements in Collaborative Robots (Cobots)
- 3.3. Market Restrains
- 3.3.1. Slow Adoption Rate in Underdeveloped Regions
- 3.4. Market Trends
- 3.4.1. Manufacturing to be the Largest End-user Industry
- 4. Market Factor Analysis
- 4.1. Porters Five Forces
- 4.2. Supply/Value Chain
- 4.3. PESTEL analysis
- 4.4. Market Entropy
- 4.5. Patent/Trademark Analysis
- 5. Global Robotic Sensors Market Analysis, Insights and Forecast, 2019-2031
- 5.1. Market Analysis, Insights and Forecast - by Type
- 5.1.1. Force and Torque Sensor
- 5.1.2. Temperature Sensor
- 5.1.3. Pressure Sensor
- 5.1.4. Position Sensor
- 5.1.5. Proximity Sensor
- 5.1.6. Vision Sensor
- 5.1.7. Other Type of Sensors
- 5.2. Market Analysis, Insights and Forecast - by End User
- 5.2.1. Manufacturing
- 5.2.2. Automotive
- 5.2.3. Process and Packaging
- 5.2.4. Logistics
- 5.2.5. Other End Users
- 5.3. Market Analysis, Insights and Forecast - by Region
- 5.3.1. North America
- 5.3.2. Europe
- 5.3.3. Asia Pacific
- 5.3.4. Rest of the World
- 5.1. Market Analysis, Insights and Forecast - by Type
- 6. North America Robotic Sensors Market Analysis, Insights and Forecast, 2019-2031
- 6.1. Market Analysis, Insights and Forecast - by Type
- 6.1.1. Force and Torque Sensor
- 6.1.2. Temperature Sensor
- 6.1.3. Pressure Sensor
- 6.1.4. Position Sensor
- 6.1.5. Proximity Sensor
- 6.1.6. Vision Sensor
- 6.1.7. Other Type of Sensors
- 6.2. Market Analysis, Insights and Forecast - by End User
- 6.2.1. Manufacturing
- 6.2.2. Automotive
- 6.2.3. Process and Packaging
- 6.2.4. Logistics
- 6.2.5. Other End Users
- 6.1. Market Analysis, Insights and Forecast - by Type
- 7. Europe Robotic Sensors Market Analysis, Insights and Forecast, 2019-2031
- 7.1. Market Analysis, Insights and Forecast - by Type
- 7.1.1. Force and Torque Sensor
- 7.1.2. Temperature Sensor
- 7.1.3. Pressure Sensor
- 7.1.4. Position Sensor
- 7.1.5. Proximity Sensor
- 7.1.6. Vision Sensor
- 7.1.7. Other Type of Sensors
- 7.2. Market Analysis, Insights and Forecast - by End User
- 7.2.1. Manufacturing
- 7.2.2. Automotive
- 7.2.3. Process and Packaging
- 7.2.4. Logistics
- 7.2.5. Other End Users
- 7.1. Market Analysis, Insights and Forecast - by Type
- 8. Asia Pacific Robotic Sensors Market Analysis, Insights and Forecast, 2019-2031
- 8.1. Market Analysis, Insights and Forecast - by Type
- 8.1.1. Force and Torque Sensor
- 8.1.2. Temperature Sensor
- 8.1.3. Pressure Sensor
- 8.1.4. Position Sensor
- 8.1.5. Proximity Sensor
- 8.1.6. Vision Sensor
- 8.1.7. Other Type of Sensors
- 8.2. Market Analysis, Insights and Forecast - by End User
- 8.2.1. Manufacturing
- 8.2.2. Automotive
- 8.2.3. Process and Packaging
- 8.2.4. Logistics
- 8.2.5. Other End Users
- 8.1. Market Analysis, Insights and Forecast - by Type
- 9. Rest of the World Robotic Sensors Market Analysis, Insights and Forecast, 2019-2031
- 9.1. Market Analysis, Insights and Forecast - by Type
- 9.1.1. Force and Torque Sensor
- 9.1.2. Temperature Sensor
- 9.1.3. Pressure Sensor
- 9.1.4. Position Sensor
- 9.1.5. Proximity Sensor
- 9.1.6. Vision Sensor
- 9.1.7. Other Type of Sensors
- 9.2. Market Analysis, Insights and Forecast - by End User
- 9.2.1. Manufacturing
- 9.2.2. Automotive
- 9.2.3. Process and Packaging
- 9.2.4. Logistics
- 9.2.5. Other End Users
- 9.1. Market Analysis, Insights and Forecast - by Type
- 10. North America Robotic Sensors Market Analysis, Insights and Forecast, 2019-2031
- 10.1. Market Analysis, Insights and Forecast - By Country/Sub-region
- 10.1.1 United States
- 10.1.2 Canada
- 10.1.3 Mexico
- 11. Europe Robotic Sensors Market Analysis, Insights and Forecast, 2019-2031
- 11.1. Market Analysis, Insights and Forecast - By Country/Sub-region
- 11.1.1 Germany
- 11.1.2 United Kingdom
- 11.1.3 France
- 11.1.4 Spain
- 11.1.5 Italy
- 11.1.6 Spain
- 11.1.7 Belgium
- 11.1.8 Netherland
- 11.1.9 Nordics
- 11.1.10 Rest of Europe
- 12. Asia Pacific Robotic Sensors Market Analysis, Insights and Forecast, 2019-2031
- 12.1. Market Analysis, Insights and Forecast - By Country/Sub-region
- 12.1.1 China
- 12.1.2 Japan
- 12.1.3 India
- 12.1.4 South Korea
- 12.1.5 Southeast Asia
- 12.1.6 Australia
- 12.1.7 Indonesia
- 12.1.8 Phillipes
- 12.1.9 Singapore
- 12.1.10 Thailandc
- 12.1.11 Rest of Asia Pacific
- 13. South America Robotic Sensors Market Analysis, Insights and Forecast, 2019-2031
- 13.1. Market Analysis, Insights and Forecast - By Country/Sub-region
- 13.1.1 Brazil
- 13.1.2 Argentina
- 13.1.3 Peru
- 13.1.4 Chile
- 13.1.5 Colombia
- 13.1.6 Ecuador
- 13.1.7 Venezuela
- 13.1.8 Rest of South America
- 14. North America Robotic Sensors Market Analysis, Insights and Forecast, 2019-2031
- 14.1. Market Analysis, Insights and Forecast - By Country/Sub-region
- 14.1.1 United States
- 14.1.2 Canada
- 14.1.3 Mexico
- 15. MEA Robotic Sensors Market Analysis, Insights and Forecast, 2019-2031
- 15.1. Market Analysis, Insights and Forecast - By Country/Sub-region
- 15.1.1 United Arab Emirates
- 15.1.2 Saudi Arabia
- 15.1.3 South Africa
- 15.1.4 Rest of Middle East and Africa
- 16. Competitive Analysis
- 16.1. Global Market Share Analysis 2024
- 16.2. Company Profiles
- 16.2.1 Tekscan Inc *List Not Exhaustive
- 16.2.1.1. Overview
- 16.2.1.2. Products
- 16.2.1.3. SWOT Analysis
- 16.2.1.4. Recent Developments
- 16.2.1.5. Financials (Based on Availability)
- 16.2.2 Infineon Technologies AG
- 16.2.2.1. Overview
- 16.2.2.2. Products
- 16.2.2.3. SWOT Analysis
- 16.2.2.4. Recent Developments
- 16.2.2.5. Financials (Based on Availability)
- 16.2.3 Honeywell International Inc
- 16.2.3.1. Overview
- 16.2.3.2. Products
- 16.2.3.3. SWOT Analysis
- 16.2.3.4. Recent Developments
- 16.2.3.5. Financials (Based on Availability)
- 16.2.4 Sensata Technologies Inc
- 16.2.4.1. Overview
- 16.2.4.2. Products
- 16.2.4.3. SWOT Analysis
- 16.2.4.4. Recent Developments
- 16.2.4.5. Financials (Based on Availability)
- 16.2.5 FANUC Corporation
- 16.2.5.1. Overview
- 16.2.5.2. Products
- 16.2.5.3. SWOT Analysis
- 16.2.5.4. Recent Developments
- 16.2.5.5. Financials (Based on Availability)
- 16.2.6 ATI Industrial Automation (Novanta Inc )
- 16.2.6.1. Overview
- 16.2.6.2. Products
- 16.2.6.3. SWOT Analysis
- 16.2.6.4. Recent Developments
- 16.2.6.5. Financials (Based on Availability)
- 16.2.7 TE Connectivity Ltd
- 16.2.7.1. Overview
- 16.2.7.2. Products
- 16.2.7.3. SWOT Analysis
- 16.2.7.4. Recent Developments
- 16.2.7.5. Financials (Based on Availability)
- 16.2.8 FUTEK Advanced Sensor Technology Inc
- 16.2.8.1. Overview
- 16.2.8.2. Products
- 16.2.8.3. SWOT Analysis
- 16.2.8.4. Recent Developments
- 16.2.8.5. Financials (Based on Availability)
- 16.2.9 OMRON Corporation
- 16.2.9.1. Overview
- 16.2.9.2. Products
- 16.2.9.3. SWOT Analysis
- 16.2.9.4. Recent Developments
- 16.2.9.5. Financials (Based on Availability)
- 16.2.10 Baumer Group
- 16.2.10.1. Overview
- 16.2.10.2. Products
- 16.2.10.3. SWOT Analysis
- 16.2.10.4. Recent Developments
- 16.2.10.5. Financials (Based on Availability)
- 16.2.1 Tekscan Inc *List Not Exhaustive
List of Figures
- Figure 1: Global Robotic Sensors Market Revenue Breakdown (Million, %) by Region 2024 & 2032
- Figure 2: North America Robotic Sensors Market Revenue (Million), by Country 2024 & 2032
- Figure 3: North America Robotic Sensors Market Revenue Share (%), by Country 2024 & 2032
- Figure 4: Europe Robotic Sensors Market Revenue (Million), by Country 2024 & 2032
- Figure 5: Europe Robotic Sensors Market Revenue Share (%), by Country 2024 & 2032
- Figure 6: Asia Pacific Robotic Sensors Market Revenue (Million), by Country 2024 & 2032
- Figure 7: Asia Pacific Robotic Sensors Market Revenue Share (%), by Country 2024 & 2032
- Figure 8: South America Robotic Sensors Market Revenue (Million), by Country 2024 & 2032
- Figure 9: South America Robotic Sensors Market Revenue Share (%), by Country 2024 & 2032
- Figure 10: North America Robotic Sensors Market Revenue (Million), by Country 2024 & 2032
- Figure 11: North America Robotic Sensors Market Revenue Share (%), by Country 2024 & 2032
- Figure 12: MEA Robotic Sensors Market Revenue (Million), by Country 2024 & 2032
- Figure 13: MEA Robotic Sensors Market Revenue Share (%), by Country 2024 & 2032
- Figure 14: North America Robotic Sensors Market Revenue (Million), by Type 2024 & 2032
- Figure 15: North America Robotic Sensors Market Revenue Share (%), by Type 2024 & 2032
- Figure 16: North America Robotic Sensors Market Revenue (Million), by End User 2024 & 2032
- Figure 17: North America Robotic Sensors Market Revenue Share (%), by End User 2024 & 2032
- Figure 18: North America Robotic Sensors Market Revenue (Million), by Country 2024 & 2032
- Figure 19: North America Robotic Sensors Market Revenue Share (%), by Country 2024 & 2032
- Figure 20: Europe Robotic Sensors Market Revenue (Million), by Type 2024 & 2032
- Figure 21: Europe Robotic Sensors Market Revenue Share (%), by Type 2024 & 2032
- Figure 22: Europe Robotic Sensors Market Revenue (Million), by End User 2024 & 2032
- Figure 23: Europe Robotic Sensors Market Revenue Share (%), by End User 2024 & 2032
- Figure 24: Europe Robotic Sensors Market Revenue (Million), by Country 2024 & 2032
- Figure 25: Europe Robotic Sensors Market Revenue Share (%), by Country 2024 & 2032
- Figure 26: Asia Pacific Robotic Sensors Market Revenue (Million), by Type 2024 & 2032
- Figure 27: Asia Pacific Robotic Sensors Market Revenue Share (%), by Type 2024 & 2032
- Figure 28: Asia Pacific Robotic Sensors Market Revenue (Million), by End User 2024 & 2032
- Figure 29: Asia Pacific Robotic Sensors Market Revenue Share (%), by End User 2024 & 2032
- Figure 30: Asia Pacific Robotic Sensors Market Revenue (Million), by Country 2024 & 2032
- Figure 31: Asia Pacific Robotic Sensors Market Revenue Share (%), by Country 2024 & 2032
- Figure 32: Rest of the World Robotic Sensors Market Revenue (Million), by Type 2024 & 2032
- Figure 33: Rest of the World Robotic Sensors Market Revenue Share (%), by Type 2024 & 2032
- Figure 34: Rest of the World Robotic Sensors Market Revenue (Million), by End User 2024 & 2032
- Figure 35: Rest of the World Robotic Sensors Market Revenue Share (%), by End User 2024 & 2032
- Figure 36: Rest of the World Robotic Sensors Market Revenue (Million), by Country 2024 & 2032
- Figure 37: Rest of the World Robotic Sensors Market Revenue Share (%), by Country 2024 & 2032
List of Tables
- Table 1: Global Robotic Sensors Market Revenue Million Forecast, by Region 2019 & 2032
- Table 2: Global Robotic Sensors Market Revenue Million Forecast, by Type 2019 & 2032
- Table 3: Global Robotic Sensors Market Revenue Million Forecast, by End User 2019 & 2032
- Table 4: Global Robotic Sensors Market Revenue Million Forecast, by Region 2019 & 2032
- Table 5: Global Robotic Sensors Market Revenue Million Forecast, by Country 2019 & 2032
- Table 6: United States Robotic Sensors Market Revenue (Million) Forecast, by Application 2019 & 2032
- Table 7: Canada Robotic Sensors Market Revenue (Million) Forecast, by Application 2019 & 2032
- Table 8: Mexico Robotic Sensors Market Revenue (Million) Forecast, by Application 2019 & 2032
- Table 9: Global Robotic Sensors Market Revenue Million Forecast, by Country 2019 & 2032
- Table 10: Germany Robotic Sensors Market Revenue (Million) Forecast, by Application 2019 & 2032
- Table 11: United Kingdom Robotic Sensors Market Revenue (Million) Forecast, by Application 2019 & 2032
- Table 12: France Robotic Sensors Market Revenue (Million) Forecast, by Application 2019 & 2032
- Table 13: Spain Robotic Sensors Market Revenue (Million) Forecast, by Application 2019 & 2032
- Table 14: Italy Robotic Sensors Market Revenue (Million) Forecast, by Application 2019 & 2032
- Table 15: Spain Robotic Sensors Market Revenue (Million) Forecast, by Application 2019 & 2032
- Table 16: Belgium Robotic Sensors Market Revenue (Million) Forecast, by Application 2019 & 2032
- Table 17: Netherland Robotic Sensors Market Revenue (Million) Forecast, by Application 2019 & 2032
- Table 18: Nordics Robotic Sensors Market Revenue (Million) Forecast, by Application 2019 & 2032
- Table 19: Rest of Europe Robotic Sensors Market Revenue (Million) Forecast, by Application 2019 & 2032
- Table 20: Global Robotic Sensors Market Revenue Million Forecast, by Country 2019 & 2032
- Table 21: China Robotic Sensors Market Revenue (Million) Forecast, by Application 2019 & 2032
- Table 22: Japan Robotic Sensors Market Revenue (Million) Forecast, by Application 2019 & 2032
- Table 23: India Robotic Sensors Market Revenue (Million) Forecast, by Application 2019 & 2032
- Table 24: South Korea Robotic Sensors Market Revenue (Million) Forecast, by Application 2019 & 2032
- Table 25: Southeast Asia Robotic Sensors Market Revenue (Million) Forecast, by Application 2019 & 2032
- Table 26: Australia Robotic Sensors Market Revenue (Million) Forecast, by Application 2019 & 2032
- Table 27: Indonesia Robotic Sensors Market Revenue (Million) Forecast, by Application 2019 & 2032
- Table 28: Phillipes Robotic Sensors Market Revenue (Million) Forecast, by Application 2019 & 2032
- Table 29: Singapore Robotic Sensors Market Revenue (Million) Forecast, by Application 2019 & 2032
- Table 30: Thailandc Robotic Sensors Market Revenue (Million) Forecast, by Application 2019 & 2032
- Table 31: Rest of Asia Pacific Robotic Sensors Market Revenue (Million) Forecast, by Application 2019 & 2032
- Table 32: Global Robotic Sensors Market Revenue Million Forecast, by Country 2019 & 2032
- Table 33: Brazil Robotic Sensors Market Revenue (Million) Forecast, by Application 2019 & 2032
- Table 34: Argentina Robotic Sensors Market Revenue (Million) Forecast, by Application 2019 & 2032
- Table 35: Peru Robotic Sensors Market Revenue (Million) Forecast, by Application 2019 & 2032
- Table 36: Chile Robotic Sensors Market Revenue (Million) Forecast, by Application 2019 & 2032
- Table 37: Colombia Robotic Sensors Market Revenue (Million) Forecast, by Application 2019 & 2032
- Table 38: Ecuador Robotic Sensors Market Revenue (Million) Forecast, by Application 2019 & 2032
- Table 39: Venezuela Robotic Sensors Market Revenue (Million) Forecast, by Application 2019 & 2032
- Table 40: Rest of South America Robotic Sensors Market Revenue (Million) Forecast, by Application 2019 & 2032
- Table 41: Global Robotic Sensors Market Revenue Million Forecast, by Country 2019 & 2032
- Table 42: United States Robotic Sensors Market Revenue (Million) Forecast, by Application 2019 & 2032
- Table 43: Canada Robotic Sensors Market Revenue (Million) Forecast, by Application 2019 & 2032
- Table 44: Mexico Robotic Sensors Market Revenue (Million) Forecast, by Application 2019 & 2032
- Table 45: Global Robotic Sensors Market Revenue Million Forecast, by Country 2019 & 2032
- Table 46: United Arab Emirates Robotic Sensors Market Revenue (Million) Forecast, by Application 2019 & 2032
- Table 47: Saudi Arabia Robotic Sensors Market Revenue (Million) Forecast, by Application 2019 & 2032
- Table 48: South Africa Robotic Sensors Market Revenue (Million) Forecast, by Application 2019 & 2032
- Table 49: Rest of Middle East and Africa Robotic Sensors Market Revenue (Million) Forecast, by Application 2019 & 2032
- Table 50: Global Robotic Sensors Market Revenue Million Forecast, by Type 2019 & 2032
- Table 51: Global Robotic Sensors Market Revenue Million Forecast, by End User 2019 & 2032
- Table 52: Global Robotic Sensors Market Revenue Million Forecast, by Country 2019 & 2032
- Table 53: Global Robotic Sensors Market Revenue Million Forecast, by Type 2019 & 2032
- Table 54: Global Robotic Sensors Market Revenue Million Forecast, by End User 2019 & 2032
- Table 55: Global Robotic Sensors Market Revenue Million Forecast, by Country 2019 & 2032
- Table 56: Global Robotic Sensors Market Revenue Million Forecast, by Type 2019 & 2032
- Table 57: Global Robotic Sensors Market Revenue Million Forecast, by End User 2019 & 2032
- Table 58: Global Robotic Sensors Market Revenue Million Forecast, by Country 2019 & 2032
- Table 59: Global Robotic Sensors Market Revenue Million Forecast, by Type 2019 & 2032
- Table 60: Global Robotic Sensors Market Revenue Million Forecast, by End User 2019 & 2032
- Table 61: Global Robotic Sensors Market Revenue Million Forecast, by Country 2019 & 2032
Frequently Asked Questions
1. What is the projected Compound Annual Growth Rate (CAGR) of the Robotic Sensors Market?
The projected CAGR is approximately 8.66%.
2. Which companies are prominent players in the Robotic Sensors Market?
Key companies in the market include Tekscan Inc *List Not Exhaustive, Infineon Technologies AG, Honeywell International Inc, Sensata Technologies Inc, FANUC Corporation, ATI Industrial Automation (Novanta Inc ), TE Connectivity Ltd, FUTEK Advanced Sensor Technology Inc, OMRON Corporation, Baumer Group.
3. What are the main segments of the Robotic Sensors Market?
The market segments include Type, End User.
4. Can you provide details about the market size?
The market size is estimated to be USD 0.67 Million as of 2022.
5. What are some drivers contributing to market growth?
Surge in Demand for Industrial Robotics; Increased Adoption of Robots in Logistics and Transportation Application; Technological Advancements in Collaborative Robots (Cobots).
6. What are the notable trends driving market growth?
Manufacturing to be the Largest End-user Industry.
7. Are there any restraints impacting market growth?
Slow Adoption Rate in Underdeveloped Regions.
8. Can you provide examples of recent developments in the market?
October 2023 - Nvidia teamed with Segway-Ninebot to launch a robotics development platform to accelerate the development and deployment of Autonomous Mobile Robots. The Nova Carter AMR gets its mobility from Segway's RMP Lite 220 chassis and is powered by Nvidia's chips, algorithms, and sensors, with Segway handling its integration. It also has 360° perception due to cameras and lidar, high-performance computing modules, sensors, autonomous driving development software, and tools.
9. What pricing options are available for accessing the report?
Pricing options include single-user, multi-user, and enterprise licenses priced at USD 4750, USD 5250, and USD 8750 respectively.
10. Is the market size provided in terms of value or volume?
The market size is provided in terms of value, measured in Million.
11. Are there any specific market keywords associated with the report?
Yes, the market keyword associated with the report is "Robotic Sensors Market," which aids in identifying and referencing the specific market segment covered.
12. How do I determine which pricing option suits my needs best?
The pricing options vary based on user requirements and access needs. Individual users may opt for single-user licenses, while businesses requiring broader access may choose multi-user or enterprise licenses for cost-effective access to the report.
13. Are there any additional resources or data provided in the Robotic Sensors Market report?
While the report offers comprehensive insights, it's advisable to review the specific contents or supplementary materials provided to ascertain if additional resources or data are available.
14. How can I stay updated on further developments or reports in the Robotic Sensors Market?
To stay informed about further developments, trends, and reports in the Robotic Sensors Market, consider subscribing to industry newsletters, following relevant companies and organizations, or regularly checking reputable industry news sources and publications.
Methodology
Step 1 - Identification of Relevant Samples Size from Population Database


Step 2 - Approaches for Defining Global Market Size (Value, Volume* & Price*)

Note*: In applicable scenarios
Step 3 - Data Sources
Primary Research
- Web Analytics
- Survey Reports
- Research Institute
- Latest Research Reports
- Opinion Leaders
Secondary Research
- Annual Reports
- White Paper
- Latest Press Release
- Industry Association
- Paid Database
- Investor Presentations

Step 4 - Data Triangulation
Involves using different sources of information in order to increase the validity of a study
These sources are likely to be stakeholders in a program - participants, other researchers, program staff, other community members, and so on.
Then we put all data in single framework & apply various statistical tools to find out the dynamic on the market.
During the analysis stage, feedback from the stakeholder groups would be compared to determine areas of agreement as well as areas of divergence


