
Key Insights
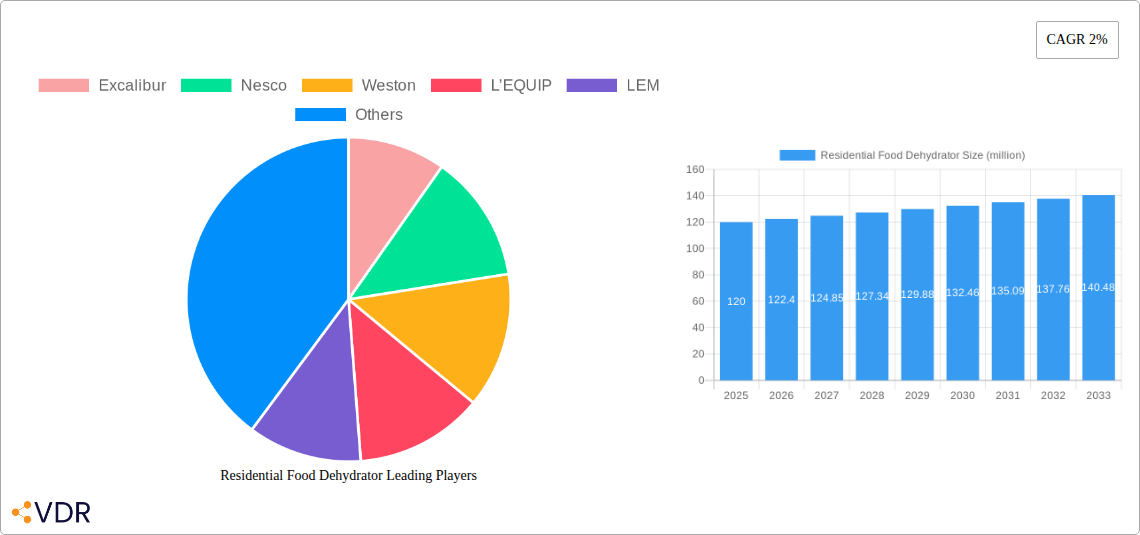
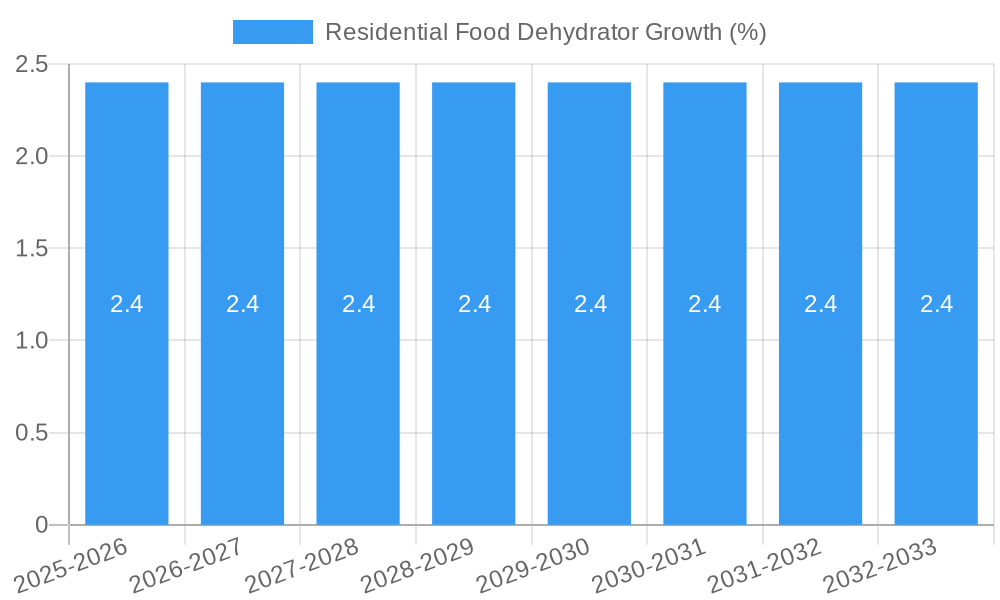
The residential food dehydrator market, currently valued at $120 million in 2025, is projected to experience steady growth with a compound annual growth rate (CAGR) of 2% from 2025 to 2033. This relatively modest growth reflects a mature market, but several factors contribute to continued demand. The increasing popularity of healthy eating and home-preservation techniques fuels the market. Consumers are seeking alternatives to processed foods and are actively preserving fruits, vegetables, and herbs to maintain freshness and reduce food waste. The rise in popularity of raw food diets and interest in creating nutritious snacks also drives demand for residential dehydrators. Furthermore, advancements in technology are leading to the development of more efficient and user-friendly models, enhancing consumer appeal and contributing to market growth.
However, the market faces certain constraints. The relatively high initial cost of a dehydrator compared to other food preservation methods may deter some budget-conscious consumers. Competition from alternative preservation techniques, such as freezing, canning, and pickling, also poses a challenge. Nonetheless, the market is expected to benefit from increased consumer awareness of the benefits of dehydrated foods, including improved nutritional retention and extended shelf life. Key players like Excalibur, Nesco, Weston, and others are likely driving innovation and expanding product offerings to cater to evolving consumer preferences and further market segmentation, such as offering specialized models for specific food types or incorporating smart features. The consistent, albeit modest, growth trajectory suggests a sustained market presence for residential food dehydrators in the coming years.
Residential Food Dehydrator Market Report: 2019-2033
This comprehensive report provides an in-depth analysis of the residential food dehydrator market, encompassing market dynamics, growth trends, regional performance, product landscape, and key player strategies. The study period covers 2019-2033, with a base year of 2025 and a forecast period of 2025-2033. The report helps understand the parent market of kitchen appliances and the child market of food preservation appliances, allowing for a detailed understanding of market segmentation and target audiences. Estimated market size for 2025 is projected at xx million units.
Residential Food Dehydrator Market Dynamics & Structure
This section analyzes the competitive landscape, technological advancements, regulatory influences, and market trends within the residential food dehydrator industry. The market is characterized by a moderately fragmented structure with several key players competing on features, pricing, and brand reputation. Technological innovation focuses on energy efficiency, ease of use, and enhanced food preservation.
- Market Concentration: Moderately fragmented, with the top 5 players holding an estimated xx% market share in 2025.
- Technological Innovation: Emphasis on digital controls, improved airflow, and stackable designs. Innovation barriers include high R&D costs and consumer preference for simpler models.
- Regulatory Frameworks: Compliance with food safety standards (e.g., FDA regulations) is crucial. Emerging regulations on energy consumption might influence product development.
- Competitive Product Substitutes: Freezing and canning remain primary alternatives; however, the convenience and nutrient retention offered by dehydrators contribute to their growing appeal.
- End-User Demographics: Growing interest among health-conscious consumers, individuals seeking food preservation solutions, and those interested in home-based food preparation drives market growth. Millennials and Gen Z demonstrate significant interest.
- M&A Trends: A moderate level of mergers and acquisitions is observed, with xx deals recorded between 2019 and 2024. These deals primarily focus on expanding product portfolios and geographic reach.
Residential Food Dehydrator Growth Trends & Insights
The residential food dehydrator market exhibits a steady growth trajectory, driven by increasing consumer awareness of healthy eating and the desire for convenient food preservation methods. The market size is expected to increase at a CAGR of xx% from 2025 to 2033, reaching an estimated xx million units by 2033. Market penetration is currently at xx% and is projected to rise to xx% by 2033, reflecting increasing adoption across diverse demographics. Technological advancements, such as improved energy efficiency and user-friendly features, are driving adoption rates. Consumer behavior shifts towards healthier lifestyles and home-based food preparation are significant growth catalysts. The report extensively covers various aspects of market size evolution, adoption rates, technological disruptions, and consumer behavior shifts.
Dominant Regions, Countries, or Segments in Residential Food Dehydrator
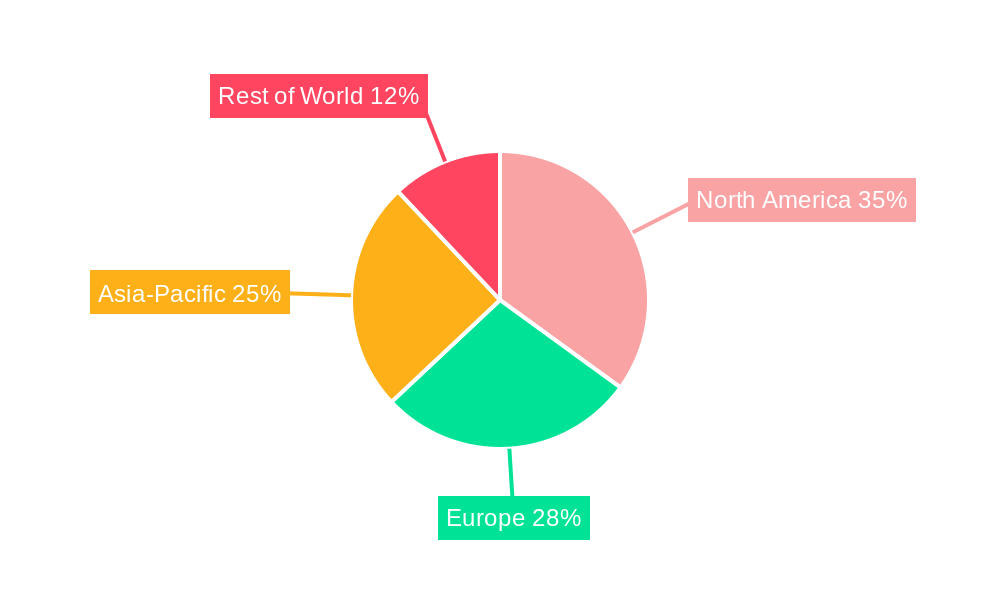
North America currently holds the largest market share in the residential food dehydrator market, driven by high consumer disposable income, strong awareness of healthy eating, and robust e-commerce infrastructure. Europe follows as a significant market. Growth in Asia-Pacific is expected to be substantial due to rising disposable incomes, increasing health consciousness, and the growing popularity of home-based food preparation.
- Key Drivers in North America: High consumer spending on kitchen appliances, readily available online retail channels, and strong brand presence contribute to market dominance.
- Growth Potential in Asia-Pacific: Rising middle class, increasing health awareness, and expanding e-commerce penetration represent key growth opportunities.
- Market Share & Growth Potential: North America holds an estimated xx% market share in 2025, with Asia-Pacific projected to experience the highest growth rate during the forecast period.
Residential Food Dehydrator Product Landscape
Residential food dehydrators are offered in a range of sizes, features, and price points. Recent innovations focus on enhancing energy efficiency, improving airflow for faster dehydration, and incorporating user-friendly digital controls. Unique selling propositions include features such as programmable timers, temperature control, and stackable trays. Technological advancements such as the integration of smart home technology are also beginning to emerge.
Key Drivers, Barriers & Challenges in Residential Food Dehydrator
Key Drivers: Rising consumer interest in healthy eating, the convenience of food preservation, and the increasing preference for home-cooked meals contribute to market growth. Technological advancements, such as improved energy efficiency and user-friendly features, also drive market expansion.
Key Challenges: Competition from established brands and emerging players presents a challenge. Fluctuations in raw material costs can impact production costs and profitability. Regulatory compliance and evolving consumer preferences necessitate continuous product innovation.
Emerging Opportunities in Residential Food Dehydrator
Untapped markets in developing countries present significant growth opportunities. The development of innovative applications, such as dehydrating pet food or medicinal herbs, expands market potential. Evolving consumer preferences, such as demand for sustainable and eco-friendly dehydrators, offer further opportunities for innovation.
Growth Accelerators in the Residential Food Dehydrator Industry
Technological breakthroughs, such as the integration of smart home technology and improved energy-efficient designs, will drive long-term growth. Strategic partnerships between manufacturers and retailers will enhance market reach and distribution. Expanding into new geographical markets and developing innovative product offerings will further accelerate market expansion.
Key Players Shaping the Residential Food Dehydrator Market
- Excalibur
- Nesco
- Weston
- L’EQUIP
- LEM
- Open Country
- Ronco
- TSM Products
- Waring
- Salton Corp.
- Presto
- Tribest
- Liven
- Hamilton Beach
- Royalstar
- Morphy Richards
- Bear
- WMF
- Lecon
Notable Milestones in Residential Food Dehydrator Sector
- 2020: Launch of several energy-efficient models by key players.
- 2022: Introduction of smart dehydrators with app connectivity.
- 2023: Merger of two mid-sized players, expanding product portfolio. (Specific details unavailable - xx)
In-Depth Residential Food Dehydrator Market Outlook
The residential food dehydrator market is poised for continued growth, driven by factors such as increasing health consciousness, technological advancements, and expanding market penetration. Strategic partnerships, innovative product development, and expansion into new geographical markets will play a crucial role in shaping future market dynamics. The long-term outlook is positive, with significant potential for market expansion and growth in the coming years.
Residential Food Dehydrator Segmentation
-
1. Application
- 1.1. Online
- 1.2. Offline
-
2. Types
- 2.1. Stacked Trays
- 2.2. Slide-in Trays
Residential Food Dehydrator Segmentation By Geography
-
1. North America
- 1.1. United States
- 1.2. Canada
- 1.3. Mexico
-
2. South America
- 2.1. Brazil
- 2.2. Argentina
- 2.3. Rest of South America
-
3. Europe
- 3.1. United Kingdom
- 3.2. Germany
- 3.3. France
- 3.4. Italy
- 3.5. Spain
- 3.6. Russia
- 3.7. Benelux
- 3.8. Nordics
- 3.9. Rest of Europe
-
4. Middle East & Africa
- 4.1. Turkey
- 4.2. Israel
- 4.3. GCC
- 4.4. North Africa
- 4.5. South Africa
- 4.6. Rest of Middle East & Africa
-
5. Asia Pacific
- 5.1. China
- 5.2. India
- 5.3. Japan
- 5.4. South Korea
- 5.5. ASEAN
- 5.6. Oceania
- 5.7. Rest of Asia Pacific
Residential Food Dehydrator REPORT HIGHLIGHTS
| Aspects | Details |
|---|---|
| Study Period | 2019-2033 |
| Base Year | 2024 |
| Estimated Year | 2025 |
| Forecast Period | 2025-2033 |
| Historical Period | 2019-2024 |
| Growth Rate | CAGR of 2% from 2019-2033 |
| Segmentation |
|
Table of Contents
- 1. Introduction
- 1.1. Research Scope
- 1.2. Market Segmentation
- 1.3. Research Methodology
- 1.4. Definitions and Assumptions
- 2. Executive Summary
- 2.1. Introduction
- 3. Market Dynamics
- 3.1. Introduction
- 3.2. Market Drivers
- 3.3. Market Restrains
- 3.4. Market Trends
- 4. Market Factor Analysis
- 4.1. Porters Five Forces
- 4.2. Supply/Value Chain
- 4.3. PESTEL analysis
- 4.4. Market Entropy
- 4.5. Patent/Trademark Analysis
- 5. Global Residential Food Dehydrator Analysis, Insights and Forecast, 2019-2031
- 5.1. Market Analysis, Insights and Forecast - by Application
- 5.1.1. Online
- 5.1.2. Offline
- 5.2. Market Analysis, Insights and Forecast - by Types
- 5.2.1. Stacked Trays
- 5.2.2. Slide-in Trays
- 5.3. Market Analysis, Insights and Forecast - by Region
- 5.3.1. North America
- 5.3.2. South America
- 5.3.3. Europe
- 5.3.4. Middle East & Africa
- 5.3.5. Asia Pacific
- 5.1. Market Analysis, Insights and Forecast - by Application
- 6. North America Residential Food Dehydrator Analysis, Insights and Forecast, 2019-2031
- 6.1. Market Analysis, Insights and Forecast - by Application
- 6.1.1. Online
- 6.1.2. Offline
- 6.2. Market Analysis, Insights and Forecast - by Types
- 6.2.1. Stacked Trays
- 6.2.2. Slide-in Trays
- 6.1. Market Analysis, Insights and Forecast - by Application
- 7. South America Residential Food Dehydrator Analysis, Insights and Forecast, 2019-2031
- 7.1. Market Analysis, Insights and Forecast - by Application
- 7.1.1. Online
- 7.1.2. Offline
- 7.2. Market Analysis, Insights and Forecast - by Types
- 7.2.1. Stacked Trays
- 7.2.2. Slide-in Trays
- 7.1. Market Analysis, Insights and Forecast - by Application
- 8. Europe Residential Food Dehydrator Analysis, Insights and Forecast, 2019-2031
- 8.1. Market Analysis, Insights and Forecast - by Application
- 8.1.1. Online
- 8.1.2. Offline
- 8.2. Market Analysis, Insights and Forecast - by Types
- 8.2.1. Stacked Trays
- 8.2.2. Slide-in Trays
- 8.1. Market Analysis, Insights and Forecast - by Application
- 9. Middle East & Africa Residential Food Dehydrator Analysis, Insights and Forecast, 2019-2031
- 9.1. Market Analysis, Insights and Forecast - by Application
- 9.1.1. Online
- 9.1.2. Offline
- 9.2. Market Analysis, Insights and Forecast - by Types
- 9.2.1. Stacked Trays
- 9.2.2. Slide-in Trays
- 9.1. Market Analysis, Insights and Forecast - by Application
- 10. Asia Pacific Residential Food Dehydrator Analysis, Insights and Forecast, 2019-2031
- 10.1. Market Analysis, Insights and Forecast - by Application
- 10.1.1. Online
- 10.1.2. Offline
- 10.2. Market Analysis, Insights and Forecast - by Types
- 10.2.1. Stacked Trays
- 10.2.2. Slide-in Trays
- 10.1. Market Analysis, Insights and Forecast - by Application
- 11. Competitive Analysis
- 11.1. Global Market Share Analysis 2024
- 11.2. Company Profiles
- 11.2.1 Excalibur
- 11.2.1.1. Overview
- 11.2.1.2. Products
- 11.2.1.3. SWOT Analysis
- 11.2.1.4. Recent Developments
- 11.2.1.5. Financials (Based on Availability)
- 11.2.2 Nesco
- 11.2.2.1. Overview
- 11.2.2.2. Products
- 11.2.2.3. SWOT Analysis
- 11.2.2.4. Recent Developments
- 11.2.2.5. Financials (Based on Availability)
- 11.2.3 Weston
- 11.2.3.1. Overview
- 11.2.3.2. Products
- 11.2.3.3. SWOT Analysis
- 11.2.3.4. Recent Developments
- 11.2.3.5. Financials (Based on Availability)
- 11.2.4 L’EQUIP
- 11.2.4.1. Overview
- 11.2.4.2. Products
- 11.2.4.3. SWOT Analysis
- 11.2.4.4. Recent Developments
- 11.2.4.5. Financials (Based on Availability)
- 11.2.5 LEM
- 11.2.5.1. Overview
- 11.2.5.2. Products
- 11.2.5.3. SWOT Analysis
- 11.2.5.4. Recent Developments
- 11.2.5.5. Financials (Based on Availability)
- 11.2.6 Open Country
- 11.2.6.1. Overview
- 11.2.6.2. Products
- 11.2.6.3. SWOT Analysis
- 11.2.6.4. Recent Developments
- 11.2.6.5. Financials (Based on Availability)
- 11.2.7 Ronco
- 11.2.7.1. Overview
- 11.2.7.2. Products
- 11.2.7.3. SWOT Analysis
- 11.2.7.4. Recent Developments
- 11.2.7.5. Financials (Based on Availability)
- 11.2.8 TSM Products
- 11.2.8.1. Overview
- 11.2.8.2. Products
- 11.2.8.3. SWOT Analysis
- 11.2.8.4. Recent Developments
- 11.2.8.5. Financials (Based on Availability)
- 11.2.9 Waring
- 11.2.9.1. Overview
- 11.2.9.2. Products
- 11.2.9.3. SWOT Analysis
- 11.2.9.4. Recent Developments
- 11.2.9.5. Financials (Based on Availability)
- 11.2.10 Salton Corp.
- 11.2.10.1. Overview
- 11.2.10.2. Products
- 11.2.10.3. SWOT Analysis
- 11.2.10.4. Recent Developments
- 11.2.10.5. Financials (Based on Availability)
- 11.2.11 Presto
- 11.2.11.1. Overview
- 11.2.11.2. Products
- 11.2.11.3. SWOT Analysis
- 11.2.11.4. Recent Developments
- 11.2.11.5. Financials (Based on Availability)
- 11.2.12 Tribest
- 11.2.12.1. Overview
- 11.2.12.2. Products
- 11.2.12.3. SWOT Analysis
- 11.2.12.4. Recent Developments
- 11.2.12.5. Financials (Based on Availability)
- 11.2.13 Liven
- 11.2.13.1. Overview
- 11.2.13.2. Products
- 11.2.13.3. SWOT Analysis
- 11.2.13.4. Recent Developments
- 11.2.13.5. Financials (Based on Availability)
- 11.2.14 Hamilton Beach
- 11.2.14.1. Overview
- 11.2.14.2. Products
- 11.2.14.3. SWOT Analysis
- 11.2.14.4. Recent Developments
- 11.2.14.5. Financials (Based on Availability)
- 11.2.15 Royalstar
- 11.2.15.1. Overview
- 11.2.15.2. Products
- 11.2.15.3. SWOT Analysis
- 11.2.15.4. Recent Developments
- 11.2.15.5. Financials (Based on Availability)
- 11.2.16 Morphy Richards
- 11.2.16.1. Overview
- 11.2.16.2. Products
- 11.2.16.3. SWOT Analysis
- 11.2.16.4. Recent Developments
- 11.2.16.5. Financials (Based on Availability)
- 11.2.17 Bear
- 11.2.17.1. Overview
- 11.2.17.2. Products
- 11.2.17.3. SWOT Analysis
- 11.2.17.4. Recent Developments
- 11.2.17.5. Financials (Based on Availability)
- 11.2.18 WMF
- 11.2.18.1. Overview
- 11.2.18.2. Products
- 11.2.18.3. SWOT Analysis
- 11.2.18.4. Recent Developments
- 11.2.18.5. Financials (Based on Availability)
- 11.2.19 Lecon
- 11.2.19.1. Overview
- 11.2.19.2. Products
- 11.2.19.3. SWOT Analysis
- 11.2.19.4. Recent Developments
- 11.2.19.5. Financials (Based on Availability)
- 11.2.1 Excalibur
List of Figures
- Figure 1: Global Residential Food Dehydrator Revenue Breakdown (million, %) by Region 2024 & 2032
- Figure 2: Global Residential Food Dehydrator Volume Breakdown (K, %) by Region 2024 & 2032
- Figure 3: North America Residential Food Dehydrator Revenue (million), by Application 2024 & 2032
- Figure 4: North America Residential Food Dehydrator Volume (K), by Application 2024 & 2032
- Figure 5: North America Residential Food Dehydrator Revenue Share (%), by Application 2024 & 2032
- Figure 6: North America Residential Food Dehydrator Volume Share (%), by Application 2024 & 2032
- Figure 7: North America Residential Food Dehydrator Revenue (million), by Types 2024 & 2032
- Figure 8: North America Residential Food Dehydrator Volume (K), by Types 2024 & 2032
- Figure 9: North America Residential Food Dehydrator Revenue Share (%), by Types 2024 & 2032
- Figure 10: North America Residential Food Dehydrator Volume Share (%), by Types 2024 & 2032
- Figure 11: North America Residential Food Dehydrator Revenue (million), by Country 2024 & 2032
- Figure 12: North America Residential Food Dehydrator Volume (K), by Country 2024 & 2032
- Figure 13: North America Residential Food Dehydrator Revenue Share (%), by Country 2024 & 2032
- Figure 14: North America Residential Food Dehydrator Volume Share (%), by Country 2024 & 2032
- Figure 15: South America Residential Food Dehydrator Revenue (million), by Application 2024 & 2032
- Figure 16: South America Residential Food Dehydrator Volume (K), by Application 2024 & 2032
- Figure 17: South America Residential Food Dehydrator Revenue Share (%), by Application 2024 & 2032
- Figure 18: South America Residential Food Dehydrator Volume Share (%), by Application 2024 & 2032
- Figure 19: South America Residential Food Dehydrator Revenue (million), by Types 2024 & 2032
- Figure 20: South America Residential Food Dehydrator Volume (K), by Types 2024 & 2032
- Figure 21: South America Residential Food Dehydrator Revenue Share (%), by Types 2024 & 2032
- Figure 22: South America Residential Food Dehydrator Volume Share (%), by Types 2024 & 2032
- Figure 23: South America Residential Food Dehydrator Revenue (million), by Country 2024 & 2032
- Figure 24: South America Residential Food Dehydrator Volume (K), by Country 2024 & 2032
- Figure 25: South America Residential Food Dehydrator Revenue Share (%), by Country 2024 & 2032
- Figure 26: South America Residential Food Dehydrator Volume Share (%), by Country 2024 & 2032
- Figure 27: Europe Residential Food Dehydrator Revenue (million), by Application 2024 & 2032
- Figure 28: Europe Residential Food Dehydrator Volume (K), by Application 2024 & 2032
- Figure 29: Europe Residential Food Dehydrator Revenue Share (%), by Application 2024 & 2032
- Figure 30: Europe Residential Food Dehydrator Volume Share (%), by Application 2024 & 2032
- Figure 31: Europe Residential Food Dehydrator Revenue (million), by Types 2024 & 2032
- Figure 32: Europe Residential Food Dehydrator Volume (K), by Types 2024 & 2032
- Figure 33: Europe Residential Food Dehydrator Revenue Share (%), by Types 2024 & 2032
- Figure 34: Europe Residential Food Dehydrator Volume Share (%), by Types 2024 & 2032
- Figure 35: Europe Residential Food Dehydrator Revenue (million), by Country 2024 & 2032
- Figure 36: Europe Residential Food Dehydrator Volume (K), by Country 2024 & 2032
- Figure 37: Europe Residential Food Dehydrator Revenue Share (%), by Country 2024 & 2032
- Figure 38: Europe Residential Food Dehydrator Volume Share (%), by Country 2024 & 2032
- Figure 39: Middle East & Africa Residential Food Dehydrator Revenue (million), by Application 2024 & 2032
- Figure 40: Middle East & Africa Residential Food Dehydrator Volume (K), by Application 2024 & 2032
- Figure 41: Middle East & Africa Residential Food Dehydrator Revenue Share (%), by Application 2024 & 2032
- Figure 42: Middle East & Africa Residential Food Dehydrator Volume Share (%), by Application 2024 & 2032
- Figure 43: Middle East & Africa Residential Food Dehydrator Revenue (million), by Types 2024 & 2032
- Figure 44: Middle East & Africa Residential Food Dehydrator Volume (K), by Types 2024 & 2032
- Figure 45: Middle East & Africa Residential Food Dehydrator Revenue Share (%), by Types 2024 & 2032
- Figure 46: Middle East & Africa Residential Food Dehydrator Volume Share (%), by Types 2024 & 2032
- Figure 47: Middle East & Africa Residential Food Dehydrator Revenue (million), by Country 2024 & 2032
- Figure 48: Middle East & Africa Residential Food Dehydrator Volume (K), by Country 2024 & 2032
- Figure 49: Middle East & Africa Residential Food Dehydrator Revenue Share (%), by Country 2024 & 2032
- Figure 50: Middle East & Africa Residential Food Dehydrator Volume Share (%), by Country 2024 & 2032
- Figure 51: Asia Pacific Residential Food Dehydrator Revenue (million), by Application 2024 & 2032
- Figure 52: Asia Pacific Residential Food Dehydrator Volume (K), by Application 2024 & 2032
- Figure 53: Asia Pacific Residential Food Dehydrator Revenue Share (%), by Application 2024 & 2032
- Figure 54: Asia Pacific Residential Food Dehydrator Volume Share (%), by Application 2024 & 2032
- Figure 55: Asia Pacific Residential Food Dehydrator Revenue (million), by Types 2024 & 2032
- Figure 56: Asia Pacific Residential Food Dehydrator Volume (K), by Types 2024 & 2032
- Figure 57: Asia Pacific Residential Food Dehydrator Revenue Share (%), by Types 2024 & 2032
- Figure 58: Asia Pacific Residential Food Dehydrator Volume Share (%), by Types 2024 & 2032
- Figure 59: Asia Pacific Residential Food Dehydrator Revenue (million), by Country 2024 & 2032
- Figure 60: Asia Pacific Residential Food Dehydrator Volume (K), by Country 2024 & 2032
- Figure 61: Asia Pacific Residential Food Dehydrator Revenue Share (%), by Country 2024 & 2032
- Figure 62: Asia Pacific Residential Food Dehydrator Volume Share (%), by Country 2024 & 2032
List of Tables
- Table 1: Global Residential Food Dehydrator Revenue million Forecast, by Region 2019 & 2032
- Table 2: Global Residential Food Dehydrator Volume K Forecast, by Region 2019 & 2032
- Table 3: Global Residential Food Dehydrator Revenue million Forecast, by Application 2019 & 2032
- Table 4: Global Residential Food Dehydrator Volume K Forecast, by Application 2019 & 2032
- Table 5: Global Residential Food Dehydrator Revenue million Forecast, by Types 2019 & 2032
- Table 6: Global Residential Food Dehydrator Volume K Forecast, by Types 2019 & 2032
- Table 7: Global Residential Food Dehydrator Revenue million Forecast, by Region 2019 & 2032
- Table 8: Global Residential Food Dehydrator Volume K Forecast, by Region 2019 & 2032
- Table 9: Global Residential Food Dehydrator Revenue million Forecast, by Application 2019 & 2032
- Table 10: Global Residential Food Dehydrator Volume K Forecast, by Application 2019 & 2032
- Table 11: Global Residential Food Dehydrator Revenue million Forecast, by Types 2019 & 2032
- Table 12: Global Residential Food Dehydrator Volume K Forecast, by Types 2019 & 2032
- Table 13: Global Residential Food Dehydrator Revenue million Forecast, by Country 2019 & 2032
- Table 14: Global Residential Food Dehydrator Volume K Forecast, by Country 2019 & 2032
- Table 15: United States Residential Food Dehydrator Revenue (million) Forecast, by Application 2019 & 2032
- Table 16: United States Residential Food Dehydrator Volume (K) Forecast, by Application 2019 & 2032
- Table 17: Canada Residential Food Dehydrator Revenue (million) Forecast, by Application 2019 & 2032
- Table 18: Canada Residential Food Dehydrator Volume (K) Forecast, by Application 2019 & 2032
- Table 19: Mexico Residential Food Dehydrator Revenue (million) Forecast, by Application 2019 & 2032
- Table 20: Mexico Residential Food Dehydrator Volume (K) Forecast, by Application 2019 & 2032
- Table 21: Global Residential Food Dehydrator Revenue million Forecast, by Application 2019 & 2032
- Table 22: Global Residential Food Dehydrator Volume K Forecast, by Application 2019 & 2032
- Table 23: Global Residential Food Dehydrator Revenue million Forecast, by Types 2019 & 2032
- Table 24: Global Residential Food Dehydrator Volume K Forecast, by Types 2019 & 2032
- Table 25: Global Residential Food Dehydrator Revenue million Forecast, by Country 2019 & 2032
- Table 26: Global Residential Food Dehydrator Volume K Forecast, by Country 2019 & 2032
- Table 27: Brazil Residential Food Dehydrator Revenue (million) Forecast, by Application 2019 & 2032
- Table 28: Brazil Residential Food Dehydrator Volume (K) Forecast, by Application 2019 & 2032
- Table 29: Argentina Residential Food Dehydrator Revenue (million) Forecast, by Application 2019 & 2032
- Table 30: Argentina Residential Food Dehydrator Volume (K) Forecast, by Application 2019 & 2032
- Table 31: Rest of South America Residential Food Dehydrator Revenue (million) Forecast, by Application 2019 & 2032
- Table 32: Rest of South America Residential Food Dehydrator Volume (K) Forecast, by Application 2019 & 2032
- Table 33: Global Residential Food Dehydrator Revenue million Forecast, by Application 2019 & 2032
- Table 34: Global Residential Food Dehydrator Volume K Forecast, by Application 2019 & 2032
- Table 35: Global Residential Food Dehydrator Revenue million Forecast, by Types 2019 & 2032
- Table 36: Global Residential Food Dehydrator Volume K Forecast, by Types 2019 & 2032
- Table 37: Global Residential Food Dehydrator Revenue million Forecast, by Country 2019 & 2032
- Table 38: Global Residential Food Dehydrator Volume K Forecast, by Country 2019 & 2032
- Table 39: United Kingdom Residential Food Dehydrator Revenue (million) Forecast, by Application 2019 & 2032
- Table 40: United Kingdom Residential Food Dehydrator Volume (K) Forecast, by Application 2019 & 2032
- Table 41: Germany Residential Food Dehydrator Revenue (million) Forecast, by Application 2019 & 2032
- Table 42: Germany Residential Food Dehydrator Volume (K) Forecast, by Application 2019 & 2032
- Table 43: France Residential Food Dehydrator Revenue (million) Forecast, by Application 2019 & 2032
- Table 44: France Residential Food Dehydrator Volume (K) Forecast, by Application 2019 & 2032
- Table 45: Italy Residential Food Dehydrator Revenue (million) Forecast, by Application 2019 & 2032
- Table 46: Italy Residential Food Dehydrator Volume (K) Forecast, by Application 2019 & 2032
- Table 47: Spain Residential Food Dehydrator Revenue (million) Forecast, by Application 2019 & 2032
- Table 48: Spain Residential Food Dehydrator Volume (K) Forecast, by Application 2019 & 2032
- Table 49: Russia Residential Food Dehydrator Revenue (million) Forecast, by Application 2019 & 2032
- Table 50: Russia Residential Food Dehydrator Volume (K) Forecast, by Application 2019 & 2032
- Table 51: Benelux Residential Food Dehydrator Revenue (million) Forecast, by Application 2019 & 2032
- Table 52: Benelux Residential Food Dehydrator Volume (K) Forecast, by Application 2019 & 2032
- Table 53: Nordics Residential Food Dehydrator Revenue (million) Forecast, by Application 2019 & 2032
- Table 54: Nordics Residential Food Dehydrator Volume (K) Forecast, by Application 2019 & 2032
- Table 55: Rest of Europe Residential Food Dehydrator Revenue (million) Forecast, by Application 2019 & 2032
- Table 56: Rest of Europe Residential Food Dehydrator Volume (K) Forecast, by Application 2019 & 2032
- Table 57: Global Residential Food Dehydrator Revenue million Forecast, by Application 2019 & 2032
- Table 58: Global Residential Food Dehydrator Volume K Forecast, by Application 2019 & 2032
- Table 59: Global Residential Food Dehydrator Revenue million Forecast, by Types 2019 & 2032
- Table 60: Global Residential Food Dehydrator Volume K Forecast, by Types 2019 & 2032
- Table 61: Global Residential Food Dehydrator Revenue million Forecast, by Country 2019 & 2032
- Table 62: Global Residential Food Dehydrator Volume K Forecast, by Country 2019 & 2032
- Table 63: Turkey Residential Food Dehydrator Revenue (million) Forecast, by Application 2019 & 2032
- Table 64: Turkey Residential Food Dehydrator Volume (K) Forecast, by Application 2019 & 2032
- Table 65: Israel Residential Food Dehydrator Revenue (million) Forecast, by Application 2019 & 2032
- Table 66: Israel Residential Food Dehydrator Volume (K) Forecast, by Application 2019 & 2032
- Table 67: GCC Residential Food Dehydrator Revenue (million) Forecast, by Application 2019 & 2032
- Table 68: GCC Residential Food Dehydrator Volume (K) Forecast, by Application 2019 & 2032
- Table 69: North Africa Residential Food Dehydrator Revenue (million) Forecast, by Application 2019 & 2032
- Table 70: North Africa Residential Food Dehydrator Volume (K) Forecast, by Application 2019 & 2032
- Table 71: South Africa Residential Food Dehydrator Revenue (million) Forecast, by Application 2019 & 2032
- Table 72: South Africa Residential Food Dehydrator Volume (K) Forecast, by Application 2019 & 2032
- Table 73: Rest of Middle East & Africa Residential Food Dehydrator Revenue (million) Forecast, by Application 2019 & 2032
- Table 74: Rest of Middle East & Africa Residential Food Dehydrator Volume (K) Forecast, by Application 2019 & 2032
- Table 75: Global Residential Food Dehydrator Revenue million Forecast, by Application 2019 & 2032
- Table 76: Global Residential Food Dehydrator Volume K Forecast, by Application 2019 & 2032
- Table 77: Global Residential Food Dehydrator Revenue million Forecast, by Types 2019 & 2032
- Table 78: Global Residential Food Dehydrator Volume K Forecast, by Types 2019 & 2032
- Table 79: Global Residential Food Dehydrator Revenue million Forecast, by Country 2019 & 2032
- Table 80: Global Residential Food Dehydrator Volume K Forecast, by Country 2019 & 2032
- Table 81: China Residential Food Dehydrator Revenue (million) Forecast, by Application 2019 & 2032
- Table 82: China Residential Food Dehydrator Volume (K) Forecast, by Application 2019 & 2032
- Table 83: India Residential Food Dehydrator Revenue (million) Forecast, by Application 2019 & 2032
- Table 84: India Residential Food Dehydrator Volume (K) Forecast, by Application 2019 & 2032
- Table 85: Japan Residential Food Dehydrator Revenue (million) Forecast, by Application 2019 & 2032
- Table 86: Japan Residential Food Dehydrator Volume (K) Forecast, by Application 2019 & 2032
- Table 87: South Korea Residential Food Dehydrator Revenue (million) Forecast, by Application 2019 & 2032
- Table 88: South Korea Residential Food Dehydrator Volume (K) Forecast, by Application 2019 & 2032
- Table 89: ASEAN Residential Food Dehydrator Revenue (million) Forecast, by Application 2019 & 2032
- Table 90: ASEAN Residential Food Dehydrator Volume (K) Forecast, by Application 2019 & 2032
- Table 91: Oceania Residential Food Dehydrator Revenue (million) Forecast, by Application 2019 & 2032
- Table 92: Oceania Residential Food Dehydrator Volume (K) Forecast, by Application 2019 & 2032
- Table 93: Rest of Asia Pacific Residential Food Dehydrator Revenue (million) Forecast, by Application 2019 & 2032
- Table 94: Rest of Asia Pacific Residential Food Dehydrator Volume (K) Forecast, by Application 2019 & 2032
Frequently Asked Questions
1. What is the projected Compound Annual Growth Rate (CAGR) of the Residential Food Dehydrator?
The projected CAGR is approximately 2%.
2. Which companies are prominent players in the Residential Food Dehydrator?
Key companies in the market include Excalibur, Nesco, Weston, L’EQUIP, LEM, Open Country, Ronco, TSM Products, Waring, Salton Corp., Presto, Tribest, Liven, Hamilton Beach, Royalstar, Morphy Richards, Bear, WMF, Lecon.
3. What are the main segments of the Residential Food Dehydrator?
The market segments include Application, Types.
4. Can you provide details about the market size?
The market size is estimated to be USD 120 million as of 2022.
5. What are some drivers contributing to market growth?
N/A
6. What are the notable trends driving market growth?
N/A
7. Are there any restraints impacting market growth?
N/A
8. Can you provide examples of recent developments in the market?
N/A
9. What pricing options are available for accessing the report?
Pricing options include single-user, multi-user, and enterprise licenses priced at USD 3950.00, USD 5925.00, and USD 7900.00 respectively.
10. Is the market size provided in terms of value or volume?
The market size is provided in terms of value, measured in million and volume, measured in K.
11. Are there any specific market keywords associated with the report?
Yes, the market keyword associated with the report is "Residential Food Dehydrator," which aids in identifying and referencing the specific market segment covered.
12. How do I determine which pricing option suits my needs best?
The pricing options vary based on user requirements and access needs. Individual users may opt for single-user licenses, while businesses requiring broader access may choose multi-user or enterprise licenses for cost-effective access to the report.
13. Are there any additional resources or data provided in the Residential Food Dehydrator report?
While the report offers comprehensive insights, it's advisable to review the specific contents or supplementary materials provided to ascertain if additional resources or data are available.
14. How can I stay updated on further developments or reports in the Residential Food Dehydrator?
To stay informed about further developments, trends, and reports in the Residential Food Dehydrator, consider subscribing to industry newsletters, following relevant companies and organizations, or regularly checking reputable industry news sources and publications.
Methodology
Step 1 - Identification of Relevant Samples Size from Population Database


Step 2 - Approaches for Defining Global Market Size (Value, Volume* & Price*)

Note*: In applicable scenarios
Step 3 - Data Sources
Primary Research
- Web Analytics
- Survey Reports
- Research Institute
- Latest Research Reports
- Opinion Leaders
Secondary Research
- Annual Reports
- White Paper
- Latest Press Release
- Industry Association
- Paid Database
- Investor Presentations

Step 4 - Data Triangulation
Involves using different sources of information in order to increase the validity of a study
These sources are likely to be stakeholders in a program - participants, other researchers, program staff, other community members, and so on.
Then we put all data in single framework & apply various statistical tools to find out the dynamic on the market.
During the analysis stage, feedback from the stakeholder groups would be compared to determine areas of agreement as well as areas of divergence


