
Key Insights
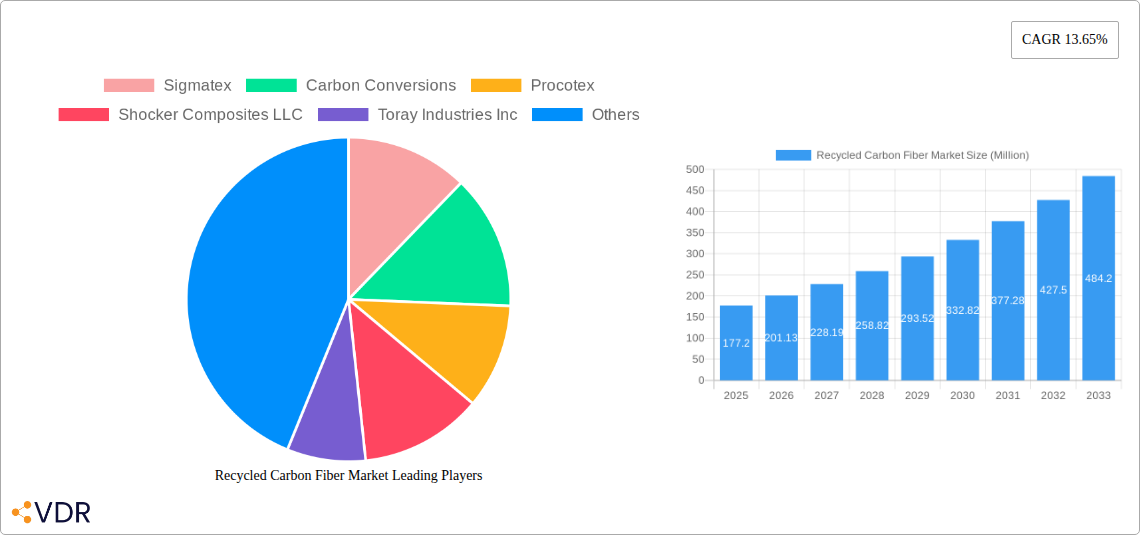
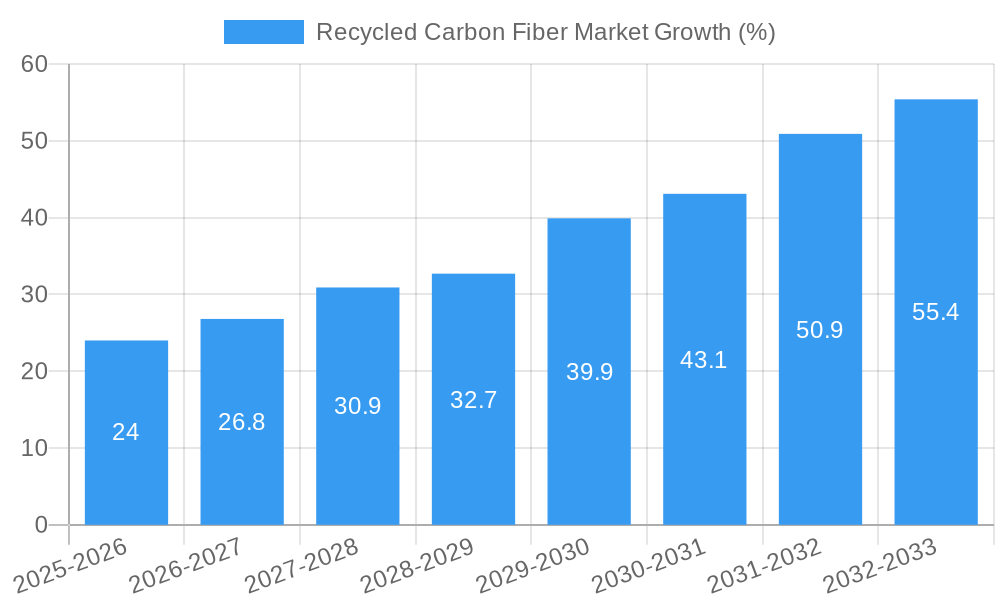
The global recycled carbon fiber market is experiencing robust growth, projected to reach \$177.20 million in 2025 and expand at a compound annual growth rate (CAGR) of 13.65% from 2025 to 2033. This surge is primarily driven by increasing demand for sustainable materials across various industries, coupled with stringent environmental regulations promoting the adoption of recycled alternatives to virgin carbon fiber. The automotive sector, a major consumer of carbon fiber composites, is a key driver, seeking lightweighting solutions to improve fuel efficiency and reduce emissions. The aerospace and defense industry, with its stringent requirements for high-performance materials, also presents significant growth opportunities. Furthermore, the burgeoning wind energy sector, requiring durable and lightweight materials for turbine blades, is increasingly incorporating recycled carbon fiber. The market's segmentation, encompassing chopped and milled recycled carbon fiber sourced from automotive, aerospace, and other sources, reflects diverse application needs and material properties. Innovation in recycling technologies, leading to improved quality and reduced costs of recycled carbon fiber, is further accelerating market expansion.
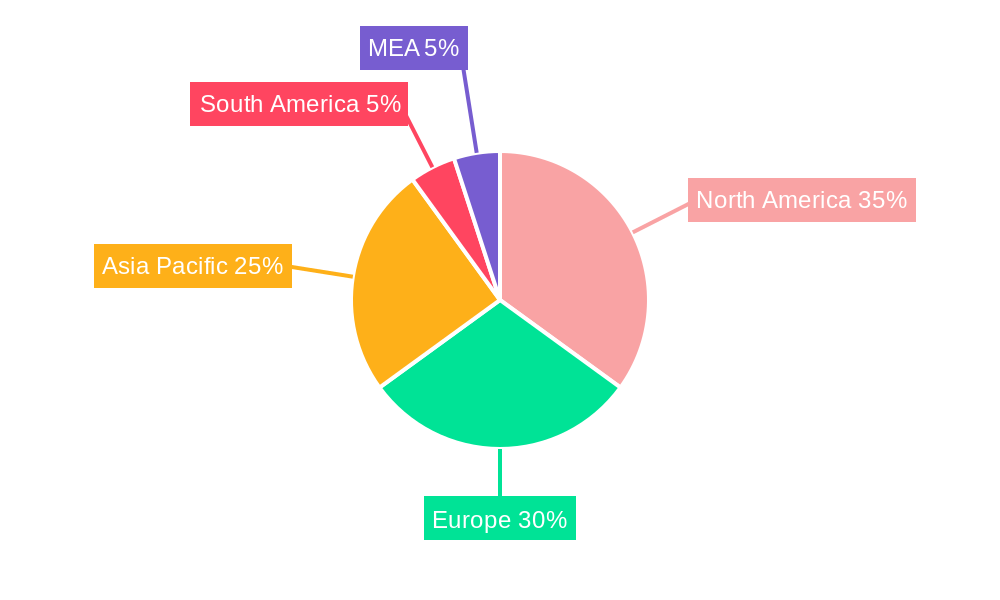
Growth within the recycled carbon fiber market is geographically diverse, with North America, Europe, and Asia Pacific expected to be leading contributors. North America benefits from a strong automotive and aerospace industry, while Europe's emphasis on sustainability and stringent environmental regulations fosters significant market adoption. Rapid industrialization and growing infrastructure projects in Asia Pacific are creating substantial demand. The availability of scrap carbon fiber, advancements in recycling technologies enhancing the quality and consistency of recycled materials, and supportive government policies promoting sustainable manufacturing are key factors determining regional variations in growth. However, challenges remain, including the inconsistent quality of recycled carbon fiber compared to virgin materials, and the need for further investment in efficient and cost-effective recycling processes to fully unlock the market's potential. Despite these hurdles, the market's long-term outlook is positive, fueled by growing environmental consciousness and the inherent advantages of recycled carbon fiber in terms of cost-effectiveness and sustainability.
Recycled Carbon Fiber Market: A Comprehensive Market Report (2019-2033)
This comprehensive report provides an in-depth analysis of the Recycled Carbon Fiber market, encompassing market dynamics, growth trends, regional dominance, product landscape, key players, and future outlook. The study period covers 2019-2033, with 2025 as the base and estimated year. This report is crucial for industry professionals, investors, and strategists seeking to understand and capitalize on the opportunities within this rapidly evolving market. The parent market is the broader composite materials market, while the child market is specifically recycled materials within the composites sector.
Recycled Carbon Fiber Market Dynamics & Structure
This section analyzes the intricate structure and driving forces of the Recycled Carbon Fiber market. We delve into market concentration, assessing the influence of major players such as Sigmatex, Carbon Conversions, Procotex, Shocker Composites LLC, Toray Industries Inc, Alpha Recyclage Composites, Carbon Fiber Remanufacturing, Carbon Fiber Recycling, Mitsubishi Chemical Holdings Corporation, Gen 2 Carbon Limited, Vartega Inc, Karborek RCF (list not exhaustive), and their respective market shares. The report quantifies the market's competitive intensity and identifies key M&A activities within the historical period (2019-2024). We evaluate the impact of technological advancements, such as improved recycling processes and enhanced material properties, and examine the regulatory landscape and its influence on market growth. Furthermore, we consider the role of substitute materials and evolving end-user demographics.
- Market Concentration: xx% market share held by top 5 players (2024).
- M&A Activity (2019-2024): xx deals, with an average deal value of xx Million.
- Technological Innovation Drivers: Improved recycling technologies, enhanced material properties.
- Regulatory Frameworks: Government incentives and regulations impacting recycling rates.
- Competitive Product Substitutes: Virgin carbon fiber, other composite materials.
- End-User Demographics: Shifting demand from automotive to aerospace and renewable energy sectors.
Recycled Carbon Fiber Market Growth Trends & Insights
This section provides a detailed analysis of the Recycled Carbon Fiber market's growth trajectory from 2019 to 2033. Using robust analytical methodologies, we project a Compound Annual Growth Rate (CAGR) of xx% during the forecast period (2025-2033). We analyze market size evolution, pinpointing key inflection points and determining the factors that have influenced adoption rates across different end-user industries. This analysis also incorporates technological disruptions, such as advancements in recycling technologies, and consumer behavior shifts influencing the demand for sustainable materials. Market penetration rates are analyzed by segment, providing a granular understanding of market evolution.
- Market Size (2024): xx Million
- Market Size (2033): xx Million
- CAGR (2025-2033): xx%
- Market Penetration (Automotive, 2024): xx%
Dominant Regions, Countries, or Segments in Recycled Carbon Fiber Market
This section identifies the leading regions, countries, and segments within the Recycled Carbon Fiber market driving growth. We analyze market share and growth potential for each segment (Type: Chopped Recycled Carbon Fiber, Milled Recycled Carbon Fiber; Source: Automotive Scrap, Aerospace Scrap, Other Sources; End-user Industry: Automotive, Aerospace and Defense, Wind Energy, Sporting Goods, Other End-user Industries). Key drivers, such as supportive economic policies, robust infrastructure development, and favorable government regulations, are highlighted for each dominant region/segment.
- Leading Region (2024): North America (xx% market share)
- Fastest-Growing Segment (2025-2033): Automotive (projected CAGR of xx%)
- Key Drivers (North America): Strong government support for sustainable materials, robust automotive industry.
- Key Drivers (Europe): Stringent environmental regulations, growing demand for lightweight materials in aerospace.
Recycled Carbon Fiber Market Product Landscape
The Recycled Carbon Fiber market offers a range of products with varying properties and applications. This section details product innovations, applications, and performance metrics, focusing on unique selling propositions and technological advancements such as improved fiber length retention and enhanced mechanical properties compared to previous generations of recycled carbon fiber. Key improvements in processing efficiency and cost reduction are also discussed.
Key Drivers, Barriers & Challenges in Recycled Carbon Fiber Market
Several factors drive the growth of the Recycled Carbon Fiber market, including increasing environmental concerns, stringent regulations promoting recycling, and the rising demand for sustainable materials in various end-user industries. However, challenges such as inconsistent material quality, high recycling costs compared to virgin fiber, and complexities in the supply chain hinder market expansion. These challenges are analyzed with quantifiable impacts on market growth projections.
- Key Drivers: Growing environmental awareness, stringent environmental regulations, cost advantages over virgin fiber in certain applications.
- Key Challenges: Inconsistent material quality, high recycling costs, complex supply chain logistics.
Emerging Opportunities in Recycled Carbon Fiber Market
Emerging opportunities within the Recycled Carbon Fiber market include the expansion into new applications (e.g., construction, consumer goods), development of innovative recycling technologies to enhance material properties, and tapping into untapped markets in developing economies. Consumer preference for sustainable products further fuels these opportunities.
Growth Accelerators in the Recycled Carbon Fiber Market Industry
Technological advancements in recycling processes, strategic partnerships between recycling companies and original equipment manufacturers (OEMs), and expansion into new geographic markets significantly accelerate the growth of the Recycled Carbon Fiber market. These factors are contributing to increased production capacity and broadened market reach.
Key Players Shaping the Recycled Carbon Fiber Market Market
- Sigmatex
- Carbon Conversions
- Procotex
- Shocker Composites LLC
- Toray Industries Inc
- Alpha Recyclage Composites
- Carbon Fiber Remanufacturing
- Carbon Fiber Recycling
- Mitsubishi Chemical Holdings Corporation
- Gen 2 Carbon Limited
- Vartega Inc
- Karborek RCF
- List Not Exhaustive
Notable Milestones in Recycled Carbon Fiber Market Sector
- August 2022: Vartega announced the expansion of its manufacturing facility, increasing capacity tenfold to 2,000 metric tons per year. This significantly increases supply and demonstrates confidence in future market demand.
- May 2022: Gen 2 Carbon Limited partnered with Deakin University, boosting research and development and expanding its sales reach in Australia. This strategic move enhances the company's technological capabilities and market penetration.
In-Depth Recycled Carbon Fiber Market Market Outlook
The Recycled Carbon Fiber market is poised for substantial growth, driven by technological innovations, supportive government policies, and the increasing demand for sustainable materials. Strategic partnerships and investments in R&D will further accelerate market expansion, creating lucrative opportunities for companies involved in recycling, processing, and utilizing recycled carbon fiber. The forecast period promises significant growth, with numerous opportunities for market entry and expansion.
Recycled Carbon Fiber Market Segmentation
-
1. Type
- 1.1. Chopped Recycled Carbon Fiber
- 1.2. Milled Recycled Carbon Fiber
-
2. Source
- 2.1. Automotive Scrap
- 2.2. Aerospace Scrap
- 2.3. Other Sources
-
3. End-user Industry
- 3.1. Automotive
- 3.2. Aerospace and Defense
- 3.3. Wind Energy
- 3.4. Sporting Goods
- 3.5. Other End-user Industries
Recycled Carbon Fiber Market Segmentation By Geography
-
1. Asia Pacific
- 1.1. China
- 1.2. India
- 1.3. Japan
- 1.4. South Korea
- 1.5. Rest of Asia Pacific
-
2. North America
- 2.1. United States
- 2.2. Canada
- 2.3. Mexico
-
3. Europe
- 3.1. Germany
- 3.2. United Kingdom
- 3.3. Italy
- 3.4. France
- 3.5. Rest of Europe
-
4. Rest of the World
- 4.1. South America
- 4.2. Middle East and Africa
Recycled Carbon Fiber Market REPORT HIGHLIGHTS
| Aspects | Details |
|---|---|
| Study Period | 2019-2033 |
| Base Year | 2024 |
| Estimated Year | 2025 |
| Forecast Period | 2025-2033 |
| Historical Period | 2019-2024 |
| Growth Rate | CAGR of 13.65% from 2019-2033 |
| Segmentation |
|
Table of Contents
- 1. Introduction
- 1.1. Research Scope
- 1.2. Market Segmentation
- 1.3. Research Methodology
- 1.4. Definitions and Assumptions
- 2. Executive Summary
- 2.1. Introduction
- 3. Market Dynamics
- 3.1. Introduction
- 3.2. Market Drivers
- 3.2.1. Rising Demand For Lightweight Vehicles; Growing Carbon Fiber Scrap Recycling and its Reuse in the Wind Energy Sector; Cost Effectiveness of Recycled Carbon Fiber
- 3.3. Market Restrains
- 3.3.1. Availability of Various Substitutes; Supply Chain Security for Recycled Carbon Fiber
- 3.4. Market Trends
- 3.4.1. Increasing Usage in the Aerospace and Defense Industry
- 4. Market Factor Analysis
- 4.1. Porters Five Forces
- 4.2. Supply/Value Chain
- 4.3. PESTEL analysis
- 4.4. Market Entropy
- 4.5. Patent/Trademark Analysis
- 5. Global Recycled Carbon Fiber Market Analysis, Insights and Forecast, 2019-2031
- 5.1. Market Analysis, Insights and Forecast - by Type
- 5.1.1. Chopped Recycled Carbon Fiber
- 5.1.2. Milled Recycled Carbon Fiber
- 5.2. Market Analysis, Insights and Forecast - by Source
- 5.2.1. Automotive Scrap
- 5.2.2. Aerospace Scrap
- 5.2.3. Other Sources
- 5.3. Market Analysis, Insights and Forecast - by End-user Industry
- 5.3.1. Automotive
- 5.3.2. Aerospace and Defense
- 5.3.3. Wind Energy
- 5.3.4. Sporting Goods
- 5.3.5. Other End-user Industries
- 5.4. Market Analysis, Insights and Forecast - by Region
- 5.4.1. Asia Pacific
- 5.4.2. North America
- 5.4.3. Europe
- 5.4.4. Rest of the World
- 5.1. Market Analysis, Insights and Forecast - by Type
- 6. Asia Pacific Recycled Carbon Fiber Market Analysis, Insights and Forecast, 2019-2031
- 6.1. Market Analysis, Insights and Forecast - by Type
- 6.1.1. Chopped Recycled Carbon Fiber
- 6.1.2. Milled Recycled Carbon Fiber
- 6.2. Market Analysis, Insights and Forecast - by Source
- 6.2.1. Automotive Scrap
- 6.2.2. Aerospace Scrap
- 6.2.3. Other Sources
- 6.3. Market Analysis, Insights and Forecast - by End-user Industry
- 6.3.1. Automotive
- 6.3.2. Aerospace and Defense
- 6.3.3. Wind Energy
- 6.3.4. Sporting Goods
- 6.3.5. Other End-user Industries
- 6.1. Market Analysis, Insights and Forecast - by Type
- 7. North America Recycled Carbon Fiber Market Analysis, Insights and Forecast, 2019-2031
- 7.1. Market Analysis, Insights and Forecast - by Type
- 7.1.1. Chopped Recycled Carbon Fiber
- 7.1.2. Milled Recycled Carbon Fiber
- 7.2. Market Analysis, Insights and Forecast - by Source
- 7.2.1. Automotive Scrap
- 7.2.2. Aerospace Scrap
- 7.2.3. Other Sources
- 7.3. Market Analysis, Insights and Forecast - by End-user Industry
- 7.3.1. Automotive
- 7.3.2. Aerospace and Defense
- 7.3.3. Wind Energy
- 7.3.4. Sporting Goods
- 7.3.5. Other End-user Industries
- 7.1. Market Analysis, Insights and Forecast - by Type
- 8. Europe Recycled Carbon Fiber Market Analysis, Insights and Forecast, 2019-2031
- 8.1. Market Analysis, Insights and Forecast - by Type
- 8.1.1. Chopped Recycled Carbon Fiber
- 8.1.2. Milled Recycled Carbon Fiber
- 8.2. Market Analysis, Insights and Forecast - by Source
- 8.2.1. Automotive Scrap
- 8.2.2. Aerospace Scrap
- 8.2.3. Other Sources
- 8.3. Market Analysis, Insights and Forecast - by End-user Industry
- 8.3.1. Automotive
- 8.3.2. Aerospace and Defense
- 8.3.3. Wind Energy
- 8.3.4. Sporting Goods
- 8.3.5. Other End-user Industries
- 8.1. Market Analysis, Insights and Forecast - by Type
- 9. Rest of the World Recycled Carbon Fiber Market Analysis, Insights and Forecast, 2019-2031
- 9.1. Market Analysis, Insights and Forecast - by Type
- 9.1.1. Chopped Recycled Carbon Fiber
- 9.1.2. Milled Recycled Carbon Fiber
- 9.2. Market Analysis, Insights and Forecast - by Source
- 9.2.1. Automotive Scrap
- 9.2.2. Aerospace Scrap
- 9.2.3. Other Sources
- 9.3. Market Analysis, Insights and Forecast - by End-user Industry
- 9.3.1. Automotive
- 9.3.2. Aerospace and Defense
- 9.3.3. Wind Energy
- 9.3.4. Sporting Goods
- 9.3.5. Other End-user Industries
- 9.1. Market Analysis, Insights and Forecast - by Type
- 10. North America Recycled Carbon Fiber Market Analysis, Insights and Forecast, 2019-2031
- 10.1. Market Analysis, Insights and Forecast - By Country/Sub-region
- 10.1.1 United States
- 10.1.2 Canada
- 10.1.3 Mexico
- 11. Europe Recycled Carbon Fiber Market Analysis, Insights and Forecast, 2019-2031
- 11.1. Market Analysis, Insights and Forecast - By Country/Sub-region
- 11.1.1 Germany
- 11.1.2 United Kingdom
- 11.1.3 France
- 11.1.4 Spain
- 11.1.5 Italy
- 11.1.6 Spain
- 11.1.7 Belgium
- 11.1.8 Netherland
- 11.1.9 Nordics
- 11.1.10 Rest of Europe
- 12. Asia Pacific Recycled Carbon Fiber Market Analysis, Insights and Forecast, 2019-2031
- 12.1. Market Analysis, Insights and Forecast - By Country/Sub-region
- 12.1.1 China
- 12.1.2 Japan
- 12.1.3 India
- 12.1.4 South Korea
- 12.1.5 Southeast Asia
- 12.1.6 Australia
- 12.1.7 Indonesia
- 12.1.8 Phillipes
- 12.1.9 Singapore
- 12.1.10 Thailandc
- 12.1.11 Rest of Asia Pacific
- 13. South America Recycled Carbon Fiber Market Analysis, Insights and Forecast, 2019-2031
- 13.1. Market Analysis, Insights and Forecast - By Country/Sub-region
- 13.1.1 Brazil
- 13.1.2 Argentina
- 13.1.3 Peru
- 13.1.4 Chile
- 13.1.5 Colombia
- 13.1.6 Ecuador
- 13.1.7 Venezuela
- 13.1.8 Rest of South America
- 14. North America Recycled Carbon Fiber Market Analysis, Insights and Forecast, 2019-2031
- 14.1. Market Analysis, Insights and Forecast - By Country/Sub-region
- 14.1.1 United States
- 14.1.2 Canada
- 14.1.3 Mexico
- 15. MEA Recycled Carbon Fiber Market Analysis, Insights and Forecast, 2019-2031
- 15.1. Market Analysis, Insights and Forecast - By Country/Sub-region
- 15.1.1 United Arab Emirates
- 15.1.2 Saudi Arabia
- 15.1.3 South Africa
- 15.1.4 Rest of Middle East and Africa
- 16. Competitive Analysis
- 16.1. Global Market Share Analysis 2024
- 16.2. Company Profiles
- 16.2.1 Sigmatex
- 16.2.1.1. Overview
- 16.2.1.2. Products
- 16.2.1.3. SWOT Analysis
- 16.2.1.4. Recent Developments
- 16.2.1.5. Financials (Based on Availability)
- 16.2.2 Carbon Conversions
- 16.2.2.1. Overview
- 16.2.2.2. Products
- 16.2.2.3. SWOT Analysis
- 16.2.2.4. Recent Developments
- 16.2.2.5. Financials (Based on Availability)
- 16.2.3 Procotex
- 16.2.3.1. Overview
- 16.2.3.2. Products
- 16.2.3.3. SWOT Analysis
- 16.2.3.4. Recent Developments
- 16.2.3.5. Financials (Based on Availability)
- 16.2.4 Shocker Composites LLC
- 16.2.4.1. Overview
- 16.2.4.2. Products
- 16.2.4.3. SWOT Analysis
- 16.2.4.4. Recent Developments
- 16.2.4.5. Financials (Based on Availability)
- 16.2.5 Toray Industries Inc
- 16.2.5.1. Overview
- 16.2.5.2. Products
- 16.2.5.3. SWOT Analysis
- 16.2.5.4. Recent Developments
- 16.2.5.5. Financials (Based on Availability)
- 16.2.6 Alpha Recyclage Composites
- 16.2.6.1. Overview
- 16.2.6.2. Products
- 16.2.6.3. SWOT Analysis
- 16.2.6.4. Recent Developments
- 16.2.6.5. Financials (Based on Availability)
- 16.2.7 Carbon Fiber Remanufacturing
- 16.2.7.1. Overview
- 16.2.7.2. Products
- 16.2.7.3. SWOT Analysis
- 16.2.7.4. Recent Developments
- 16.2.7.5. Financials (Based on Availability)
- 16.2.8 Carbon Fiber Recycling
- 16.2.8.1. Overview
- 16.2.8.2. Products
- 16.2.8.3. SWOT Analysis
- 16.2.8.4. Recent Developments
- 16.2.8.5. Financials (Based on Availability)
- 16.2.9 Mitsubishi Chemical Holdings Corporation
- 16.2.9.1. Overview
- 16.2.9.2. Products
- 16.2.9.3. SWOT Analysis
- 16.2.9.4. Recent Developments
- 16.2.9.5. Financials (Based on Availability)
- 16.2.10 Gen 2 Carbon Limited
- 16.2.10.1. Overview
- 16.2.10.2. Products
- 16.2.10.3. SWOT Analysis
- 16.2.10.4. Recent Developments
- 16.2.10.5. Financials (Based on Availability)
- 16.2.11 Vartega Inc *List Not Exhaustive
- 16.2.11.1. Overview
- 16.2.11.2. Products
- 16.2.11.3. SWOT Analysis
- 16.2.11.4. Recent Developments
- 16.2.11.5. Financials (Based on Availability)
- 16.2.12 Karborek RCF
- 16.2.12.1. Overview
- 16.2.12.2. Products
- 16.2.12.3. SWOT Analysis
- 16.2.12.4. Recent Developments
- 16.2.12.5. Financials (Based on Availability)
- 16.2.1 Sigmatex
List of Figures
- Figure 1: Global Recycled Carbon Fiber Market Revenue Breakdown (Million, %) by Region 2024 & 2032
- Figure 2: Global Recycled Carbon Fiber Market Volume Breakdown (K Tons, %) by Region 2024 & 2032
- Figure 3: North America Recycled Carbon Fiber Market Revenue (Million), by Country 2024 & 2032
- Figure 4: North America Recycled Carbon Fiber Market Volume (K Tons), by Country 2024 & 2032
- Figure 5: North America Recycled Carbon Fiber Market Revenue Share (%), by Country 2024 & 2032
- Figure 6: North America Recycled Carbon Fiber Market Volume Share (%), by Country 2024 & 2032
- Figure 7: Europe Recycled Carbon Fiber Market Revenue (Million), by Country 2024 & 2032
- Figure 8: Europe Recycled Carbon Fiber Market Volume (K Tons), by Country 2024 & 2032
- Figure 9: Europe Recycled Carbon Fiber Market Revenue Share (%), by Country 2024 & 2032
- Figure 10: Europe Recycled Carbon Fiber Market Volume Share (%), by Country 2024 & 2032
- Figure 11: Asia Pacific Recycled Carbon Fiber Market Revenue (Million), by Country 2024 & 2032
- Figure 12: Asia Pacific Recycled Carbon Fiber Market Volume (K Tons), by Country 2024 & 2032
- Figure 13: Asia Pacific Recycled Carbon Fiber Market Revenue Share (%), by Country 2024 & 2032
- Figure 14: Asia Pacific Recycled Carbon Fiber Market Volume Share (%), by Country 2024 & 2032
- Figure 15: South America Recycled Carbon Fiber Market Revenue (Million), by Country 2024 & 2032
- Figure 16: South America Recycled Carbon Fiber Market Volume (K Tons), by Country 2024 & 2032
- Figure 17: South America Recycled Carbon Fiber Market Revenue Share (%), by Country 2024 & 2032
- Figure 18: South America Recycled Carbon Fiber Market Volume Share (%), by Country 2024 & 2032
- Figure 19: North America Recycled Carbon Fiber Market Revenue (Million), by Country 2024 & 2032
- Figure 20: North America Recycled Carbon Fiber Market Volume (K Tons), by Country 2024 & 2032
- Figure 21: North America Recycled Carbon Fiber Market Revenue Share (%), by Country 2024 & 2032
- Figure 22: North America Recycled Carbon Fiber Market Volume Share (%), by Country 2024 & 2032
- Figure 23: MEA Recycled Carbon Fiber Market Revenue (Million), by Country 2024 & 2032
- Figure 24: MEA Recycled Carbon Fiber Market Volume (K Tons), by Country 2024 & 2032
- Figure 25: MEA Recycled Carbon Fiber Market Revenue Share (%), by Country 2024 & 2032
- Figure 26: MEA Recycled Carbon Fiber Market Volume Share (%), by Country 2024 & 2032
- Figure 27: Asia Pacific Recycled Carbon Fiber Market Revenue (Million), by Type 2024 & 2032
- Figure 28: Asia Pacific Recycled Carbon Fiber Market Volume (K Tons), by Type 2024 & 2032
- Figure 29: Asia Pacific Recycled Carbon Fiber Market Revenue Share (%), by Type 2024 & 2032
- Figure 30: Asia Pacific Recycled Carbon Fiber Market Volume Share (%), by Type 2024 & 2032
- Figure 31: Asia Pacific Recycled Carbon Fiber Market Revenue (Million), by Source 2024 & 2032
- Figure 32: Asia Pacific Recycled Carbon Fiber Market Volume (K Tons), by Source 2024 & 2032
- Figure 33: Asia Pacific Recycled Carbon Fiber Market Revenue Share (%), by Source 2024 & 2032
- Figure 34: Asia Pacific Recycled Carbon Fiber Market Volume Share (%), by Source 2024 & 2032
- Figure 35: Asia Pacific Recycled Carbon Fiber Market Revenue (Million), by End-user Industry 2024 & 2032
- Figure 36: Asia Pacific Recycled Carbon Fiber Market Volume (K Tons), by End-user Industry 2024 & 2032
- Figure 37: Asia Pacific Recycled Carbon Fiber Market Revenue Share (%), by End-user Industry 2024 & 2032
- Figure 38: Asia Pacific Recycled Carbon Fiber Market Volume Share (%), by End-user Industry 2024 & 2032
- Figure 39: Asia Pacific Recycled Carbon Fiber Market Revenue (Million), by Country 2024 & 2032
- Figure 40: Asia Pacific Recycled Carbon Fiber Market Volume (K Tons), by Country 2024 & 2032
- Figure 41: Asia Pacific Recycled Carbon Fiber Market Revenue Share (%), by Country 2024 & 2032
- Figure 42: Asia Pacific Recycled Carbon Fiber Market Volume Share (%), by Country 2024 & 2032
- Figure 43: North America Recycled Carbon Fiber Market Revenue (Million), by Type 2024 & 2032
- Figure 44: North America Recycled Carbon Fiber Market Volume (K Tons), by Type 2024 & 2032
- Figure 45: North America Recycled Carbon Fiber Market Revenue Share (%), by Type 2024 & 2032
- Figure 46: North America Recycled Carbon Fiber Market Volume Share (%), by Type 2024 & 2032
- Figure 47: North America Recycled Carbon Fiber Market Revenue (Million), by Source 2024 & 2032
- Figure 48: North America Recycled Carbon Fiber Market Volume (K Tons), by Source 2024 & 2032
- Figure 49: North America Recycled Carbon Fiber Market Revenue Share (%), by Source 2024 & 2032
- Figure 50: North America Recycled Carbon Fiber Market Volume Share (%), by Source 2024 & 2032
- Figure 51: North America Recycled Carbon Fiber Market Revenue (Million), by End-user Industry 2024 & 2032
- Figure 52: North America Recycled Carbon Fiber Market Volume (K Tons), by End-user Industry 2024 & 2032
- Figure 53: North America Recycled Carbon Fiber Market Revenue Share (%), by End-user Industry 2024 & 2032
- Figure 54: North America Recycled Carbon Fiber Market Volume Share (%), by End-user Industry 2024 & 2032
- Figure 55: North America Recycled Carbon Fiber Market Revenue (Million), by Country 2024 & 2032
- Figure 56: North America Recycled Carbon Fiber Market Volume (K Tons), by Country 2024 & 2032
- Figure 57: North America Recycled Carbon Fiber Market Revenue Share (%), by Country 2024 & 2032
- Figure 58: North America Recycled Carbon Fiber Market Volume Share (%), by Country 2024 & 2032
- Figure 59: Europe Recycled Carbon Fiber Market Revenue (Million), by Type 2024 & 2032
- Figure 60: Europe Recycled Carbon Fiber Market Volume (K Tons), by Type 2024 & 2032
- Figure 61: Europe Recycled Carbon Fiber Market Revenue Share (%), by Type 2024 & 2032
- Figure 62: Europe Recycled Carbon Fiber Market Volume Share (%), by Type 2024 & 2032
- Figure 63: Europe Recycled Carbon Fiber Market Revenue (Million), by Source 2024 & 2032
- Figure 64: Europe Recycled Carbon Fiber Market Volume (K Tons), by Source 2024 & 2032
- Figure 65: Europe Recycled Carbon Fiber Market Revenue Share (%), by Source 2024 & 2032
- Figure 66: Europe Recycled Carbon Fiber Market Volume Share (%), by Source 2024 & 2032
- Figure 67: Europe Recycled Carbon Fiber Market Revenue (Million), by End-user Industry 2024 & 2032
- Figure 68: Europe Recycled Carbon Fiber Market Volume (K Tons), by End-user Industry 2024 & 2032
- Figure 69: Europe Recycled Carbon Fiber Market Revenue Share (%), by End-user Industry 2024 & 2032
- Figure 70: Europe Recycled Carbon Fiber Market Volume Share (%), by End-user Industry 2024 & 2032
- Figure 71: Europe Recycled Carbon Fiber Market Revenue (Million), by Country 2024 & 2032
- Figure 72: Europe Recycled Carbon Fiber Market Volume (K Tons), by Country 2024 & 2032
- Figure 73: Europe Recycled Carbon Fiber Market Revenue Share (%), by Country 2024 & 2032
- Figure 74: Europe Recycled Carbon Fiber Market Volume Share (%), by Country 2024 & 2032
- Figure 75: Rest of the World Recycled Carbon Fiber Market Revenue (Million), by Type 2024 & 2032
- Figure 76: Rest of the World Recycled Carbon Fiber Market Volume (K Tons), by Type 2024 & 2032
- Figure 77: Rest of the World Recycled Carbon Fiber Market Revenue Share (%), by Type 2024 & 2032
- Figure 78: Rest of the World Recycled Carbon Fiber Market Volume Share (%), by Type 2024 & 2032
- Figure 79: Rest of the World Recycled Carbon Fiber Market Revenue (Million), by Source 2024 & 2032
- Figure 80: Rest of the World Recycled Carbon Fiber Market Volume (K Tons), by Source 2024 & 2032
- Figure 81: Rest of the World Recycled Carbon Fiber Market Revenue Share (%), by Source 2024 & 2032
- Figure 82: Rest of the World Recycled Carbon Fiber Market Volume Share (%), by Source 2024 & 2032
- Figure 83: Rest of the World Recycled Carbon Fiber Market Revenue (Million), by End-user Industry 2024 & 2032
- Figure 84: Rest of the World Recycled Carbon Fiber Market Volume (K Tons), by End-user Industry 2024 & 2032
- Figure 85: Rest of the World Recycled Carbon Fiber Market Revenue Share (%), by End-user Industry 2024 & 2032
- Figure 86: Rest of the World Recycled Carbon Fiber Market Volume Share (%), by End-user Industry 2024 & 2032
- Figure 87: Rest of the World Recycled Carbon Fiber Market Revenue (Million), by Country 2024 & 2032
- Figure 88: Rest of the World Recycled Carbon Fiber Market Volume (K Tons), by Country 2024 & 2032
- Figure 89: Rest of the World Recycled Carbon Fiber Market Revenue Share (%), by Country 2024 & 2032
- Figure 90: Rest of the World Recycled Carbon Fiber Market Volume Share (%), by Country 2024 & 2032
List of Tables
- Table 1: Global Recycled Carbon Fiber Market Revenue Million Forecast, by Region 2019 & 2032
- Table 2: Global Recycled Carbon Fiber Market Volume K Tons Forecast, by Region 2019 & 2032
- Table 3: Global Recycled Carbon Fiber Market Revenue Million Forecast, by Type 2019 & 2032
- Table 4: Global Recycled Carbon Fiber Market Volume K Tons Forecast, by Type 2019 & 2032
- Table 5: Global Recycled Carbon Fiber Market Revenue Million Forecast, by Source 2019 & 2032
- Table 6: Global Recycled Carbon Fiber Market Volume K Tons Forecast, by Source 2019 & 2032
- Table 7: Global Recycled Carbon Fiber Market Revenue Million Forecast, by End-user Industry 2019 & 2032
- Table 8: Global Recycled Carbon Fiber Market Volume K Tons Forecast, by End-user Industry 2019 & 2032
- Table 9: Global Recycled Carbon Fiber Market Revenue Million Forecast, by Region 2019 & 2032
- Table 10: Global Recycled Carbon Fiber Market Volume K Tons Forecast, by Region 2019 & 2032
- Table 11: Global Recycled Carbon Fiber Market Revenue Million Forecast, by Country 2019 & 2032
- Table 12: Global Recycled Carbon Fiber Market Volume K Tons Forecast, by Country 2019 & 2032
- Table 13: United States Recycled Carbon Fiber Market Revenue (Million) Forecast, by Application 2019 & 2032
- Table 14: United States Recycled Carbon Fiber Market Volume (K Tons) Forecast, by Application 2019 & 2032
- Table 15: Canada Recycled Carbon Fiber Market Revenue (Million) Forecast, by Application 2019 & 2032
- Table 16: Canada Recycled Carbon Fiber Market Volume (K Tons) Forecast, by Application 2019 & 2032
- Table 17: Mexico Recycled Carbon Fiber Market Revenue (Million) Forecast, by Application 2019 & 2032
- Table 18: Mexico Recycled Carbon Fiber Market Volume (K Tons) Forecast, by Application 2019 & 2032
- Table 19: Global Recycled Carbon Fiber Market Revenue Million Forecast, by Country 2019 & 2032
- Table 20: Global Recycled Carbon Fiber Market Volume K Tons Forecast, by Country 2019 & 2032
- Table 21: Germany Recycled Carbon Fiber Market Revenue (Million) Forecast, by Application 2019 & 2032
- Table 22: Germany Recycled Carbon Fiber Market Volume (K Tons) Forecast, by Application 2019 & 2032
- Table 23: United Kingdom Recycled Carbon Fiber Market Revenue (Million) Forecast, by Application 2019 & 2032
- Table 24: United Kingdom Recycled Carbon Fiber Market Volume (K Tons) Forecast, by Application 2019 & 2032
- Table 25: France Recycled Carbon Fiber Market Revenue (Million) Forecast, by Application 2019 & 2032
- Table 26: France Recycled Carbon Fiber Market Volume (K Tons) Forecast, by Application 2019 & 2032
- Table 27: Spain Recycled Carbon Fiber Market Revenue (Million) Forecast, by Application 2019 & 2032
- Table 28: Spain Recycled Carbon Fiber Market Volume (K Tons) Forecast, by Application 2019 & 2032
- Table 29: Italy Recycled Carbon Fiber Market Revenue (Million) Forecast, by Application 2019 & 2032
- Table 30: Italy Recycled Carbon Fiber Market Volume (K Tons) Forecast, by Application 2019 & 2032
- Table 31: Spain Recycled Carbon Fiber Market Revenue (Million) Forecast, by Application 2019 & 2032
- Table 32: Spain Recycled Carbon Fiber Market Volume (K Tons) Forecast, by Application 2019 & 2032
- Table 33: Belgium Recycled Carbon Fiber Market Revenue (Million) Forecast, by Application 2019 & 2032
- Table 34: Belgium Recycled Carbon Fiber Market Volume (K Tons) Forecast, by Application 2019 & 2032
- Table 35: Netherland Recycled Carbon Fiber Market Revenue (Million) Forecast, by Application 2019 & 2032
- Table 36: Netherland Recycled Carbon Fiber Market Volume (K Tons) Forecast, by Application 2019 & 2032
- Table 37: Nordics Recycled Carbon Fiber Market Revenue (Million) Forecast, by Application 2019 & 2032
- Table 38: Nordics Recycled Carbon Fiber Market Volume (K Tons) Forecast, by Application 2019 & 2032
- Table 39: Rest of Europe Recycled Carbon Fiber Market Revenue (Million) Forecast, by Application 2019 & 2032
- Table 40: Rest of Europe Recycled Carbon Fiber Market Volume (K Tons) Forecast, by Application 2019 & 2032
- Table 41: Global Recycled Carbon Fiber Market Revenue Million Forecast, by Country 2019 & 2032
- Table 42: Global Recycled Carbon Fiber Market Volume K Tons Forecast, by Country 2019 & 2032
- Table 43: China Recycled Carbon Fiber Market Revenue (Million) Forecast, by Application 2019 & 2032
- Table 44: China Recycled Carbon Fiber Market Volume (K Tons) Forecast, by Application 2019 & 2032
- Table 45: Japan Recycled Carbon Fiber Market Revenue (Million) Forecast, by Application 2019 & 2032
- Table 46: Japan Recycled Carbon Fiber Market Volume (K Tons) Forecast, by Application 2019 & 2032
- Table 47: India Recycled Carbon Fiber Market Revenue (Million) Forecast, by Application 2019 & 2032
- Table 48: India Recycled Carbon Fiber Market Volume (K Tons) Forecast, by Application 2019 & 2032
- Table 49: South Korea Recycled Carbon Fiber Market Revenue (Million) Forecast, by Application 2019 & 2032
- Table 50: South Korea Recycled Carbon Fiber Market Volume (K Tons) Forecast, by Application 2019 & 2032
- Table 51: Southeast Asia Recycled Carbon Fiber Market Revenue (Million) Forecast, by Application 2019 & 2032
- Table 52: Southeast Asia Recycled Carbon Fiber Market Volume (K Tons) Forecast, by Application 2019 & 2032
- Table 53: Australia Recycled Carbon Fiber Market Revenue (Million) Forecast, by Application 2019 & 2032
- Table 54: Australia Recycled Carbon Fiber Market Volume (K Tons) Forecast, by Application 2019 & 2032
- Table 55: Indonesia Recycled Carbon Fiber Market Revenue (Million) Forecast, by Application 2019 & 2032
- Table 56: Indonesia Recycled Carbon Fiber Market Volume (K Tons) Forecast, by Application 2019 & 2032
- Table 57: Phillipes Recycled Carbon Fiber Market Revenue (Million) Forecast, by Application 2019 & 2032
- Table 58: Phillipes Recycled Carbon Fiber Market Volume (K Tons) Forecast, by Application 2019 & 2032
- Table 59: Singapore Recycled Carbon Fiber Market Revenue (Million) Forecast, by Application 2019 & 2032
- Table 60: Singapore Recycled Carbon Fiber Market Volume (K Tons) Forecast, by Application 2019 & 2032
- Table 61: Thailandc Recycled Carbon Fiber Market Revenue (Million) Forecast, by Application 2019 & 2032
- Table 62: Thailandc Recycled Carbon Fiber Market Volume (K Tons) Forecast, by Application 2019 & 2032
- Table 63: Rest of Asia Pacific Recycled Carbon Fiber Market Revenue (Million) Forecast, by Application 2019 & 2032
- Table 64: Rest of Asia Pacific Recycled Carbon Fiber Market Volume (K Tons) Forecast, by Application 2019 & 2032
- Table 65: Global Recycled Carbon Fiber Market Revenue Million Forecast, by Country 2019 & 2032
- Table 66: Global Recycled Carbon Fiber Market Volume K Tons Forecast, by Country 2019 & 2032
- Table 67: Brazil Recycled Carbon Fiber Market Revenue (Million) Forecast, by Application 2019 & 2032
- Table 68: Brazil Recycled Carbon Fiber Market Volume (K Tons) Forecast, by Application 2019 & 2032
- Table 69: Argentina Recycled Carbon Fiber Market Revenue (Million) Forecast, by Application 2019 & 2032
- Table 70: Argentina Recycled Carbon Fiber Market Volume (K Tons) Forecast, by Application 2019 & 2032
- Table 71: Peru Recycled Carbon Fiber Market Revenue (Million) Forecast, by Application 2019 & 2032
- Table 72: Peru Recycled Carbon Fiber Market Volume (K Tons) Forecast, by Application 2019 & 2032
- Table 73: Chile Recycled Carbon Fiber Market Revenue (Million) Forecast, by Application 2019 & 2032
- Table 74: Chile Recycled Carbon Fiber Market Volume (K Tons) Forecast, by Application 2019 & 2032
- Table 75: Colombia Recycled Carbon Fiber Market Revenue (Million) Forecast, by Application 2019 & 2032
- Table 76: Colombia Recycled Carbon Fiber Market Volume (K Tons) Forecast, by Application 2019 & 2032
- Table 77: Ecuador Recycled Carbon Fiber Market Revenue (Million) Forecast, by Application 2019 & 2032
- Table 78: Ecuador Recycled Carbon Fiber Market Volume (K Tons) Forecast, by Application 2019 & 2032
- Table 79: Venezuela Recycled Carbon Fiber Market Revenue (Million) Forecast, by Application 2019 & 2032
- Table 80: Venezuela Recycled Carbon Fiber Market Volume (K Tons) Forecast, by Application 2019 & 2032
- Table 81: Rest of South America Recycled Carbon Fiber Market Revenue (Million) Forecast, by Application 2019 & 2032
- Table 82: Rest of South America Recycled Carbon Fiber Market Volume (K Tons) Forecast, by Application 2019 & 2032
- Table 83: Global Recycled Carbon Fiber Market Revenue Million Forecast, by Country 2019 & 2032
- Table 84: Global Recycled Carbon Fiber Market Volume K Tons Forecast, by Country 2019 & 2032
- Table 85: United States Recycled Carbon Fiber Market Revenue (Million) Forecast, by Application 2019 & 2032
- Table 86: United States Recycled Carbon Fiber Market Volume (K Tons) Forecast, by Application 2019 & 2032
- Table 87: Canada Recycled Carbon Fiber Market Revenue (Million) Forecast, by Application 2019 & 2032
- Table 88: Canada Recycled Carbon Fiber Market Volume (K Tons) Forecast, by Application 2019 & 2032
- Table 89: Mexico Recycled Carbon Fiber Market Revenue (Million) Forecast, by Application 2019 & 2032
- Table 90: Mexico Recycled Carbon Fiber Market Volume (K Tons) Forecast, by Application 2019 & 2032
- Table 91: Global Recycled Carbon Fiber Market Revenue Million Forecast, by Country 2019 & 2032
- Table 92: Global Recycled Carbon Fiber Market Volume K Tons Forecast, by Country 2019 & 2032
- Table 93: United Arab Emirates Recycled Carbon Fiber Market Revenue (Million) Forecast, by Application 2019 & 2032
- Table 94: United Arab Emirates Recycled Carbon Fiber Market Volume (K Tons) Forecast, by Application 2019 & 2032
- Table 95: Saudi Arabia Recycled Carbon Fiber Market Revenue (Million) Forecast, by Application 2019 & 2032
- Table 96: Saudi Arabia Recycled Carbon Fiber Market Volume (K Tons) Forecast, by Application 2019 & 2032
- Table 97: South Africa Recycled Carbon Fiber Market Revenue (Million) Forecast, by Application 2019 & 2032
- Table 98: South Africa Recycled Carbon Fiber Market Volume (K Tons) Forecast, by Application 2019 & 2032
- Table 99: Rest of Middle East and Africa Recycled Carbon Fiber Market Revenue (Million) Forecast, by Application 2019 & 2032
- Table 100: Rest of Middle East and Africa Recycled Carbon Fiber Market Volume (K Tons) Forecast, by Application 2019 & 2032
- Table 101: Global Recycled Carbon Fiber Market Revenue Million Forecast, by Type 2019 & 2032
- Table 102: Global Recycled Carbon Fiber Market Volume K Tons Forecast, by Type 2019 & 2032
- Table 103: Global Recycled Carbon Fiber Market Revenue Million Forecast, by Source 2019 & 2032
- Table 104: Global Recycled Carbon Fiber Market Volume K Tons Forecast, by Source 2019 & 2032
- Table 105: Global Recycled Carbon Fiber Market Revenue Million Forecast, by End-user Industry 2019 & 2032
- Table 106: Global Recycled Carbon Fiber Market Volume K Tons Forecast, by End-user Industry 2019 & 2032
- Table 107: Global Recycled Carbon Fiber Market Revenue Million Forecast, by Country 2019 & 2032
- Table 108: Global Recycled Carbon Fiber Market Volume K Tons Forecast, by Country 2019 & 2032
- Table 109: China Recycled Carbon Fiber Market Revenue (Million) Forecast, by Application 2019 & 2032
- Table 110: China Recycled Carbon Fiber Market Volume (K Tons) Forecast, by Application 2019 & 2032
- Table 111: India Recycled Carbon Fiber Market Revenue (Million) Forecast, by Application 2019 & 2032
- Table 112: India Recycled Carbon Fiber Market Volume (K Tons) Forecast, by Application 2019 & 2032
- Table 113: Japan Recycled Carbon Fiber Market Revenue (Million) Forecast, by Application 2019 & 2032
- Table 114: Japan Recycled Carbon Fiber Market Volume (K Tons) Forecast, by Application 2019 & 2032
- Table 115: South Korea Recycled Carbon Fiber Market Revenue (Million) Forecast, by Application 2019 & 2032
- Table 116: South Korea Recycled Carbon Fiber Market Volume (K Tons) Forecast, by Application 2019 & 2032
- Table 117: Rest of Asia Pacific Recycled Carbon Fiber Market Revenue (Million) Forecast, by Application 2019 & 2032
- Table 118: Rest of Asia Pacific Recycled Carbon Fiber Market Volume (K Tons) Forecast, by Application 2019 & 2032
- Table 119: Global Recycled Carbon Fiber Market Revenue Million Forecast, by Type 2019 & 2032
- Table 120: Global Recycled Carbon Fiber Market Volume K Tons Forecast, by Type 2019 & 2032
- Table 121: Global Recycled Carbon Fiber Market Revenue Million Forecast, by Source 2019 & 2032
- Table 122: Global Recycled Carbon Fiber Market Volume K Tons Forecast, by Source 2019 & 2032
- Table 123: Global Recycled Carbon Fiber Market Revenue Million Forecast, by End-user Industry 2019 & 2032
- Table 124: Global Recycled Carbon Fiber Market Volume K Tons Forecast, by End-user Industry 2019 & 2032
- Table 125: Global Recycled Carbon Fiber Market Revenue Million Forecast, by Country 2019 & 2032
- Table 126: Global Recycled Carbon Fiber Market Volume K Tons Forecast, by Country 2019 & 2032
- Table 127: United States Recycled Carbon Fiber Market Revenue (Million) Forecast, by Application 2019 & 2032
- Table 128: United States Recycled Carbon Fiber Market Volume (K Tons) Forecast, by Application 2019 & 2032
- Table 129: Canada Recycled Carbon Fiber Market Revenue (Million) Forecast, by Application 2019 & 2032
- Table 130: Canada Recycled Carbon Fiber Market Volume (K Tons) Forecast, by Application 2019 & 2032
- Table 131: Mexico Recycled Carbon Fiber Market Revenue (Million) Forecast, by Application 2019 & 2032
- Table 132: Mexico Recycled Carbon Fiber Market Volume (K Tons) Forecast, by Application 2019 & 2032
- Table 133: Global Recycled Carbon Fiber Market Revenue Million Forecast, by Type 2019 & 2032
- Table 134: Global Recycled Carbon Fiber Market Volume K Tons Forecast, by Type 2019 & 2032
- Table 135: Global Recycled Carbon Fiber Market Revenue Million Forecast, by Source 2019 & 2032
- Table 136: Global Recycled Carbon Fiber Market Volume K Tons Forecast, by Source 2019 & 2032
- Table 137: Global Recycled Carbon Fiber Market Revenue Million Forecast, by End-user Industry 2019 & 2032
- Table 138: Global Recycled Carbon Fiber Market Volume K Tons Forecast, by End-user Industry 2019 & 2032
- Table 139: Global Recycled Carbon Fiber Market Revenue Million Forecast, by Country 2019 & 2032
- Table 140: Global Recycled Carbon Fiber Market Volume K Tons Forecast, by Country 2019 & 2032
- Table 141: Germany Recycled Carbon Fiber Market Revenue (Million) Forecast, by Application 2019 & 2032
- Table 142: Germany Recycled Carbon Fiber Market Volume (K Tons) Forecast, by Application 2019 & 2032
- Table 143: United Kingdom Recycled Carbon Fiber Market Revenue (Million) Forecast, by Application 2019 & 2032
- Table 144: United Kingdom Recycled Carbon Fiber Market Volume (K Tons) Forecast, by Application 2019 & 2032
- Table 145: Italy Recycled Carbon Fiber Market Revenue (Million) Forecast, by Application 2019 & 2032
- Table 146: Italy Recycled Carbon Fiber Market Volume (K Tons) Forecast, by Application 2019 & 2032
- Table 147: France Recycled Carbon Fiber Market Revenue (Million) Forecast, by Application 2019 & 2032
- Table 148: France Recycled Carbon Fiber Market Volume (K Tons) Forecast, by Application 2019 & 2032
- Table 149: Rest of Europe Recycled Carbon Fiber Market Revenue (Million) Forecast, by Application 2019 & 2032
- Table 150: Rest of Europe Recycled Carbon Fiber Market Volume (K Tons) Forecast, by Application 2019 & 2032
- Table 151: Global Recycled Carbon Fiber Market Revenue Million Forecast, by Type 2019 & 2032
- Table 152: Global Recycled Carbon Fiber Market Volume K Tons Forecast, by Type 2019 & 2032
- Table 153: Global Recycled Carbon Fiber Market Revenue Million Forecast, by Source 2019 & 2032
- Table 154: Global Recycled Carbon Fiber Market Volume K Tons Forecast, by Source 2019 & 2032
- Table 155: Global Recycled Carbon Fiber Market Revenue Million Forecast, by End-user Industry 2019 & 2032
- Table 156: Global Recycled Carbon Fiber Market Volume K Tons Forecast, by End-user Industry 2019 & 2032
- Table 157: Global Recycled Carbon Fiber Market Revenue Million Forecast, by Country 2019 & 2032
- Table 158: Global Recycled Carbon Fiber Market Volume K Tons Forecast, by Country 2019 & 2032
- Table 159: South America Recycled Carbon Fiber Market Revenue (Million) Forecast, by Application 2019 & 2032
- Table 160: South America Recycled Carbon Fiber Market Volume (K Tons) Forecast, by Application 2019 & 2032
- Table 161: Middle East and Africa Recycled Carbon Fiber Market Revenue (Million) Forecast, by Application 2019 & 2032
- Table 162: Middle East and Africa Recycled Carbon Fiber Market Volume (K Tons) Forecast, by Application 2019 & 2032
Frequently Asked Questions
1. What is the projected Compound Annual Growth Rate (CAGR) of the Recycled Carbon Fiber Market?
The projected CAGR is approximately 13.65%.
2. Which companies are prominent players in the Recycled Carbon Fiber Market?
Key companies in the market include Sigmatex, Carbon Conversions, Procotex, Shocker Composites LLC, Toray Industries Inc, Alpha Recyclage Composites, Carbon Fiber Remanufacturing, Carbon Fiber Recycling, Mitsubishi Chemical Holdings Corporation, Gen 2 Carbon Limited, Vartega Inc *List Not Exhaustive, Karborek RCF.
3. What are the main segments of the Recycled Carbon Fiber Market?
The market segments include Type, Source, End-user Industry.
4. Can you provide details about the market size?
The market size is estimated to be USD 177.20 Million as of 2022.
5. What are some drivers contributing to market growth?
Rising Demand For Lightweight Vehicles; Growing Carbon Fiber Scrap Recycling and its Reuse in the Wind Energy Sector; Cost Effectiveness of Recycled Carbon Fiber.
6. What are the notable trends driving market growth?
Increasing Usage in the Aerospace and Defense Industry.
7. Are there any restraints impacting market growth?
Availability of Various Substitutes; Supply Chain Security for Recycled Carbon Fiber.
8. Can you provide examples of recent developments in the market?
August 2022: Vartega announced the expansion of its 50,000-square-foot manufacturing facility with a planned capacity of 2,000 metric tons per year. The company has expanded its production capacity ten times more than the previous capacity.
9. What pricing options are available for accessing the report?
Pricing options include single-user, multi-user, and enterprise licenses priced at USD 4750, USD 5250, and USD 8750 respectively.
10. Is the market size provided in terms of value or volume?
The market size is provided in terms of value, measured in Million and volume, measured in K Tons.
11. Are there any specific market keywords associated with the report?
Yes, the market keyword associated with the report is "Recycled Carbon Fiber Market," which aids in identifying and referencing the specific market segment covered.
12. How do I determine which pricing option suits my needs best?
The pricing options vary based on user requirements and access needs. Individual users may opt for single-user licenses, while businesses requiring broader access may choose multi-user or enterprise licenses for cost-effective access to the report.
13. Are there any additional resources or data provided in the Recycled Carbon Fiber Market report?
While the report offers comprehensive insights, it's advisable to review the specific contents or supplementary materials provided to ascertain if additional resources or data are available.
14. How can I stay updated on further developments or reports in the Recycled Carbon Fiber Market?
To stay informed about further developments, trends, and reports in the Recycled Carbon Fiber Market, consider subscribing to industry newsletters, following relevant companies and organizations, or regularly checking reputable industry news sources and publications.
Methodology
Step 1 - Identification of Relevant Samples Size from Population Database


Step 2 - Approaches for Defining Global Market Size (Value, Volume* & Price*)

Note*: In applicable scenarios
Step 3 - Data Sources
Primary Research
- Web Analytics
- Survey Reports
- Research Institute
- Latest Research Reports
- Opinion Leaders
Secondary Research
- Annual Reports
- White Paper
- Latest Press Release
- Industry Association
- Paid Database
- Investor Presentations

Step 4 - Data Triangulation
Involves using different sources of information in order to increase the validity of a study
These sources are likely to be stakeholders in a program - participants, other researchers, program staff, other community members, and so on.
Then we put all data in single framework & apply various statistical tools to find out the dynamic on the market.
During the analysis stage, feedback from the stakeholder groups would be compared to determine areas of agreement as well as areas of divergence


