
Key Insights
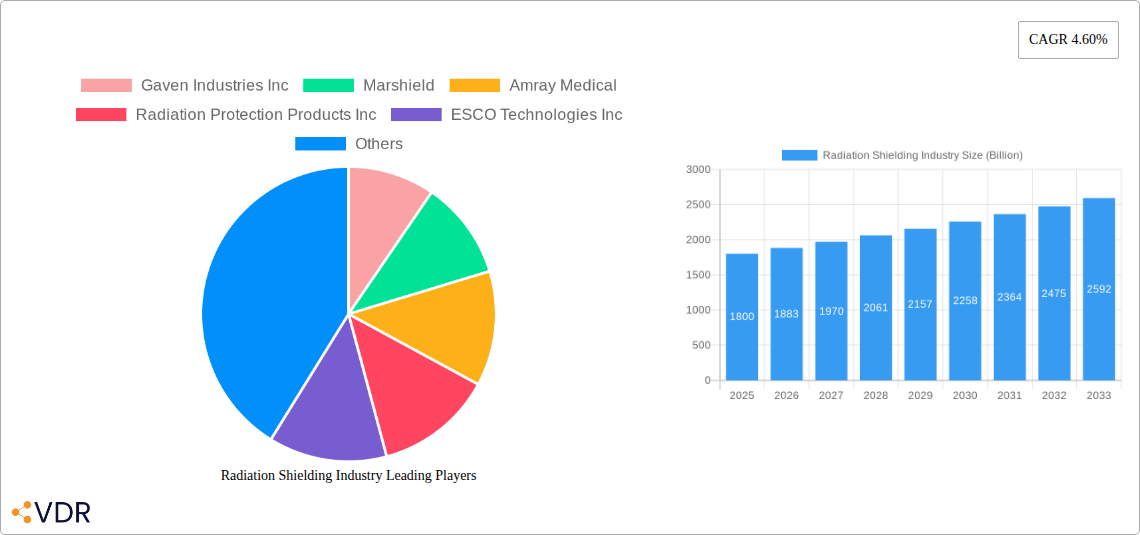
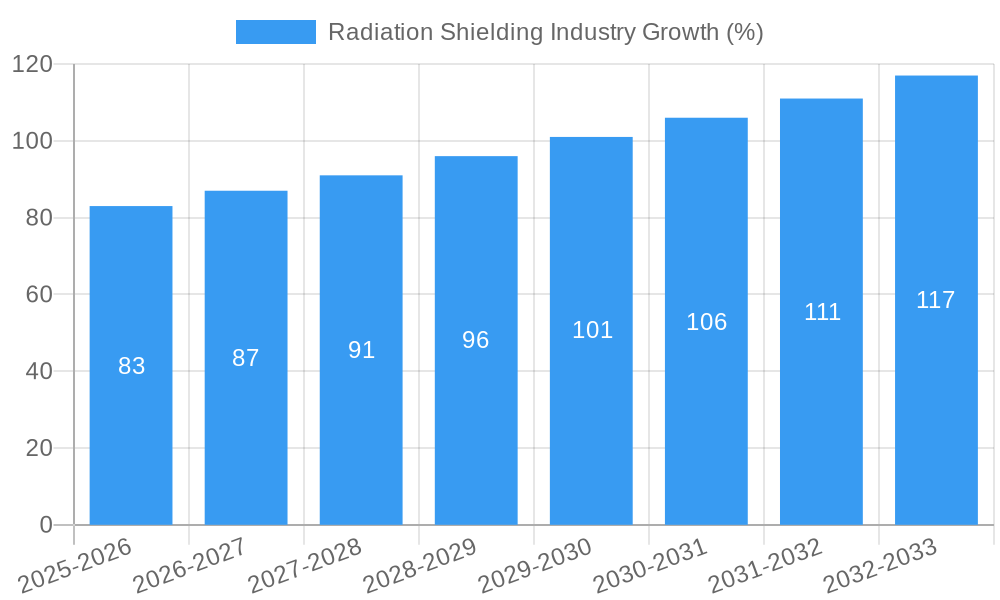
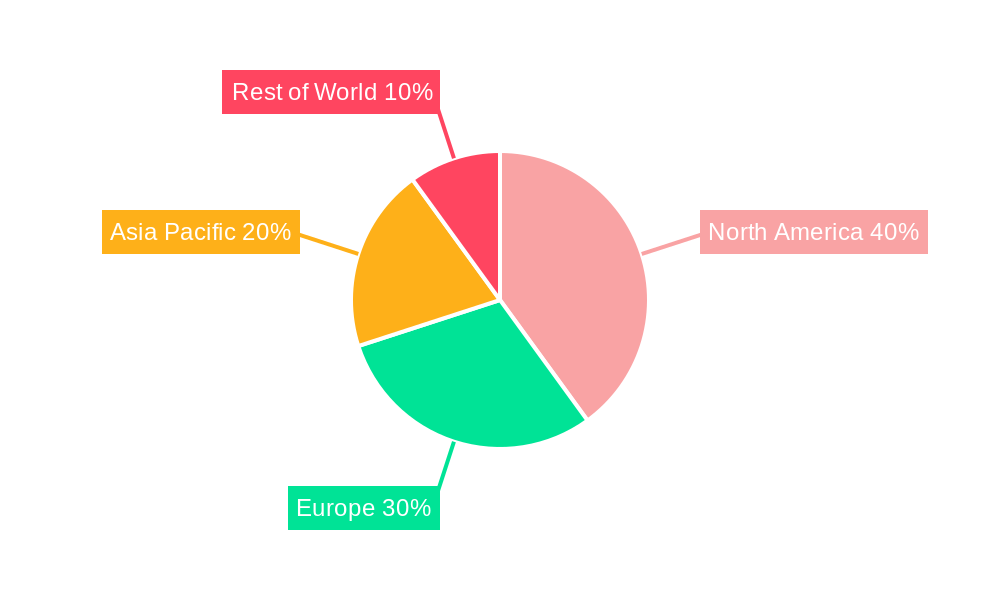
The global radiation shielding market, valued at $1.8 billion in 2025, is projected to experience robust growth, driven by a compound annual growth rate (CAGR) of 4.60% from 2025 to 2033. This expansion is fueled by several key factors. The increasing prevalence of cancer and other diseases requiring radiation therapy is significantly boosting demand for radiation shielding solutions in hospitals and diagnostic centers. Furthermore, the growing number of research institutions conducting nuclear and radiological studies necessitates advanced shielding technologies to ensure the safety of personnel and the environment. Technological advancements in shielding materials, such as the development of lighter, more effective, and cost-efficient solutions, are further contributing to market growth. Regulations mandating stricter radiation safety protocols in healthcare and research settings are also driving adoption. The market is segmented by end-user (hospitals, research institutes, other) and solution (radiation therapy shielding, diagnostic shielding), with hospitals and diagnostic centers currently dominating due to the high volume of radiation procedures conducted. North America and Europe are expected to hold significant market share initially, but the Asia-Pacific region is poised for rapid expansion, driven by increasing healthcare infrastructure development and rising disposable incomes.
While the market presents significant opportunities, challenges remain. The high initial investment cost associated with radiation shielding equipment can be a barrier to entry for smaller healthcare facilities and research institutions. Furthermore, the availability of skilled professionals to install and maintain these systems can pose limitations. Competition among established players and emerging companies is intense, requiring manufacturers to continuously innovate and offer cost-effective and superior solutions to maintain their market position. Fluctuations in raw material prices and economic downturns could also impact market growth. However, the long-term outlook remains positive, particularly given the increasing focus on patient safety and the growing need for advanced radiation shielding technologies across various sectors.
Radiation Shielding Industry Market Report: 2019-2033
This comprehensive report provides a detailed analysis of the global radiation shielding industry, encompassing market size, growth trends, key players, and future prospects. With a focus on both parent and child markets, this report is an invaluable resource for industry professionals, investors, and researchers seeking to understand and capitalize on opportunities within this dynamic sector. The study period covers 2019-2033, with 2025 as the base and estimated year, and a forecast period of 2025-2033. The historical period analyzed is 2019-2024. The market size is projected to reach xx Billion by 2033.
Keywords: Radiation shielding, radiation therapy shielding, diagnostic shielding, hospitals, research institutes, medical devices, lead shielding, radiation protection, market analysis, market forecast, industry trends, key players, market size, CAGR, M&A, regulatory framework.
Radiation Shielding Industry Market Dynamics & Structure
The radiation shielding market is characterized by a moderately concentrated landscape, with a few large players and numerous smaller, specialized firms. Technological innovation, particularly in materials science and design, is a key driver, alongside stringent regulatory frameworks governing radiation safety. Competitive substitutes are limited, primarily focusing on differing material compositions (e.g., lead vs. alternative materials) and design features. The end-user demographic is primarily driven by the growth of healthcare infrastructure, particularly in developing economies. M&A activity has been moderate, with strategic acquisitions aimed at expanding product portfolios and geographic reach.
- Market Concentration: Moderately concentrated, with a Herfindahl-Hirschman Index (HHI) of xx.
- Technological Innovation: Driven by advancements in materials science (e.g., lighter, more effective shielding materials), design optimization, and automation in manufacturing.
- Regulatory Framework: Stringent regulations regarding radiation safety, driving demand for compliant shielding solutions.
- Competitive Substitutes: Limited, primarily varying by material composition and design, with limited price competition due to high regulatory compliance requirements.
- End-User Demographics: Primarily hospitals and research institutes, influenced by growth in healthcare infrastructure and research funding.
- M&A Trends: Moderate activity, focused on strategic acquisitions expanding product lines and geographic reach. Approximately xx M&A deals were recorded between 2019 and 2024.
Radiation Shielding Industry Growth Trends & Insights
The radiation shielding market has experienced steady growth over the past few years, driven by the increasing adoption of radiation technologies in healthcare and research. This growth is projected to continue at a CAGR of xx% during the forecast period (2025-2033), reaching a market value of xx Billion by 2033. Technological advancements, such as the development of lighter and more effective shielding materials, are contributing to increased adoption rates. Furthermore, a growing awareness of radiation safety among healthcare professionals and researchers is driving market demand. Changes in consumer behavior, primarily focused on patient safety and improved treatment outcomes, further support market expansion. Market penetration in key regions remains relatively low, leaving significant room for future expansion.
Dominant Regions, Countries, or Segments in Radiation Shielding Industry
North America currently holds the largest market share in the radiation shielding industry, driven by advanced healthcare infrastructure, high adoption rates of radiation technologies, and stringent regulatory frameworks. However, the Asia-Pacific region is experiencing the fastest growth, fueled by rapid economic development, increasing healthcare spending, and expanding research activities. Within market segments, the Hospitals and Diagnostic Centers end-user segment dominates due to high demand for radiation shielding in medical imaging and radiation therapy. Similarly, Radiation Therapy Shielding holds the largest share of the solutions segment due to the significant volume of radiation therapy procedures performed globally.
- Key Drivers:
- North America: Advanced healthcare infrastructure, high adoption of radiation technologies, stringent regulations.
- Asia-Pacific: Rapid economic growth, increasing healthcare spending, expanding research activities.
- Hospitals & Diagnostic Centers: High demand for radiation shielding in medical imaging and radiation therapy.
- Radiation Therapy Shielding: High volume of radiation therapy procedures.
Radiation Shielding Industry Product Landscape
The radiation shielding industry offers a range of products, including lead shielding, concrete shielding, and specialized shielding materials. Innovations focus on developing lighter, more flexible, and cost-effective shielding solutions without compromising radiation attenuation capabilities. Product applications span a broad spectrum, ranging from medical imaging equipment to industrial radiation sources. Key performance metrics include radiation attenuation effectiveness, weight, flexibility, and cost-effectiveness.
Key Drivers, Barriers & Challenges in Radiation Shielding Industry
Key Drivers: The increasing adoption of radiation technologies in healthcare and research, coupled with stringent safety regulations, are primary drivers. Technological advancements leading to more efficient and lighter shielding materials contribute significantly. Growing awareness regarding radiation safety and its potential health effects further boosts market demand.
Key Challenges: Supply chain disruptions, particularly related to raw material sourcing (e.g., lead), pose a significant challenge. Regulatory compliance requirements can be complex and costly, potentially hindering market entry for smaller players. Intense competition, particularly among larger players, can also put pressure on profit margins. The market is estimated to face a xx% impact from supply chain issues in 2025.
Emerging Opportunities in Radiation Shielding Industry
Emerging opportunities lie in the development of innovative shielding materials (e.g., composites, nanomaterials), personalized shielding solutions tailored to specific applications, and expansion into untapped markets in developing economies. The increasing use of radiation technologies in industrial applications (e.g., non-destructive testing) also presents a significant growth avenue.
Growth Accelerators in the Radiation Shielding Industry
Technological breakthroughs in materials science, leading to lighter, more effective, and cost-efficient shielding materials, are key growth accelerators. Strategic partnerships between shielding manufacturers and healthcare providers can facilitate wider adoption of radiation shielding solutions. Expansion into emerging markets with growing healthcare infrastructure offers significant growth potential.
Key Players Shaping the Radiation Shielding Industry Market
- Gaven Industries Inc
- Marshield
- Amray Medical
- Radiation Protection Products Inc
- ESCO Technologies Inc
- Nelco Inc
- Global Partners in Shielding Inc
- Veritas Medical Solutions LLC
- A&L Shielding
- Ray-Bar Engineering Corp
Notable Milestones in Radiation Shielding Industry Sector
- April 2022: Radiaction Medical Ltd. received FDA 510(k) clearance for its RadiationShield System.
- March 2022: Rampart IC secured an exclusive distribution agreement with Japan Lifeline (JLL) for its Rampart M1128 shielding device.
In-Depth Radiation Shielding Industry Market Outlook
The radiation shielding market is poised for robust growth over the forecast period, driven by technological advancements, increased awareness of radiation safety, and expanding applications across healthcare and industrial sectors. Strategic investments in R&D, coupled with strategic partnerships and market expansion initiatives, will be crucial for players seeking to capitalize on emerging opportunities and maintain a competitive edge in this dynamic market. The market is expected to witness significant expansion in the adoption of advanced shielding materials and solutions.
Radiation Shielding Industry Segmentation
-
1. Solution
- 1.1. Radiation Therapy Shielding
- 1.2. Diagnostic Shielding
-
2. End User
- 2.1. Hospitals and Diagnostic Centers
- 2.2. Research Institutes
- 2.3. Other End Users
Radiation Shielding Industry Segmentation By Geography
-
1. North America
- 1.1. United States
- 1.2. Canada
- 1.3. Mexico
-
2. Europe
- 2.1. Germany
- 2.2. United Kingdom
- 2.3. France
- 2.4. Italy
- 2.5. Spain
- 2.6. Rest of Europe
-
3. Asia Pacific
- 3.1. China
- 3.2. Japan
- 3.3. India
- 3.4. Australia
- 3.5. South Korea
- 3.6. Rest of Asia Pacific
-
4. Middle East and Africa
- 4.1. GCC
- 4.2. South Africa
- 4.3. Rest of Middle East and Africa
-
5. South America
- 5.1. Brazil
- 5.2. Argentina
- 5.3. Rest of South America
Radiation Shielding Industry REPORT HIGHLIGHTS
| Aspects | Details |
|---|---|
| Study Period | 2019-2033 |
| Base Year | 2024 |
| Estimated Year | 2025 |
| Forecast Period | 2025-2033 |
| Historical Period | 2019-2024 |
| Growth Rate | CAGR of 4.60% from 2019-2033 |
| Segmentation |
|
Table of Contents
- 1. Introduction
- 1.1. Research Scope
- 1.2. Market Segmentation
- 1.3. Research Methodology
- 1.4. Definitions and Assumptions
- 2. Executive Summary
- 2.1. Introduction
- 3. Market Dynamics
- 3.1. Introduction
- 3.2. Market Drivers
- 3.2.1. Increasing Usage of Nuclear Medicine and Radiation Therapy for Diagnosis and Treatment; Rising Burden of Chronic Diseases; Growing Safety Awareness Among People Working in Radiation-prone Environments
- 3.3. Market Restrains
- 3.3.1. Lack of Awareness Among Healthcare Professionals; High Cost of Radiation Shielding
- 3.4. Market Trends
- 3.4.1. Diagnostic Shielding Holds Significant Share in the Global Medical Radiation Shielding Market
- 4. Market Factor Analysis
- 4.1. Porters Five Forces
- 4.2. Supply/Value Chain
- 4.3. PESTEL analysis
- 4.4. Market Entropy
- 4.5. Patent/Trademark Analysis
- 5. Global Radiation Shielding Industry Analysis, Insights and Forecast, 2019-2031
- 5.1. Market Analysis, Insights and Forecast - by Solution
- 5.1.1. Radiation Therapy Shielding
- 5.1.2. Diagnostic Shielding
- 5.2. Market Analysis, Insights and Forecast - by End User
- 5.2.1. Hospitals and Diagnostic Centers
- 5.2.2. Research Institutes
- 5.2.3. Other End Users
- 5.3. Market Analysis, Insights and Forecast - by Region
- 5.3.1. North America
- 5.3.2. Europe
- 5.3.3. Asia Pacific
- 5.3.4. Middle East and Africa
- 5.3.5. South America
- 5.1. Market Analysis, Insights and Forecast - by Solution
- 6. North America Radiation Shielding Industry Analysis, Insights and Forecast, 2019-2031
- 6.1. Market Analysis, Insights and Forecast - by Solution
- 6.1.1. Radiation Therapy Shielding
- 6.1.2. Diagnostic Shielding
- 6.2. Market Analysis, Insights and Forecast - by End User
- 6.2.1. Hospitals and Diagnostic Centers
- 6.2.2. Research Institutes
- 6.2.3. Other End Users
- 6.1. Market Analysis, Insights and Forecast - by Solution
- 7. Europe Radiation Shielding Industry Analysis, Insights and Forecast, 2019-2031
- 7.1. Market Analysis, Insights and Forecast - by Solution
- 7.1.1. Radiation Therapy Shielding
- 7.1.2. Diagnostic Shielding
- 7.2. Market Analysis, Insights and Forecast - by End User
- 7.2.1. Hospitals and Diagnostic Centers
- 7.2.2. Research Institutes
- 7.2.3. Other End Users
- 7.1. Market Analysis, Insights and Forecast - by Solution
- 8. Asia Pacific Radiation Shielding Industry Analysis, Insights and Forecast, 2019-2031
- 8.1. Market Analysis, Insights and Forecast - by Solution
- 8.1.1. Radiation Therapy Shielding
- 8.1.2. Diagnostic Shielding
- 8.2. Market Analysis, Insights and Forecast - by End User
- 8.2.1. Hospitals and Diagnostic Centers
- 8.2.2. Research Institutes
- 8.2.3. Other End Users
- 8.1. Market Analysis, Insights and Forecast - by Solution
- 9. Middle East and Africa Radiation Shielding Industry Analysis, Insights and Forecast, 2019-2031
- 9.1. Market Analysis, Insights and Forecast - by Solution
- 9.1.1. Radiation Therapy Shielding
- 9.1.2. Diagnostic Shielding
- 9.2. Market Analysis, Insights and Forecast - by End User
- 9.2.1. Hospitals and Diagnostic Centers
- 9.2.2. Research Institutes
- 9.2.3. Other End Users
- 9.1. Market Analysis, Insights and Forecast - by Solution
- 10. South America Radiation Shielding Industry Analysis, Insights and Forecast, 2019-2031
- 10.1. Market Analysis, Insights and Forecast - by Solution
- 10.1.1. Radiation Therapy Shielding
- 10.1.2. Diagnostic Shielding
- 10.2. Market Analysis, Insights and Forecast - by End User
- 10.2.1. Hospitals and Diagnostic Centers
- 10.2.2. Research Institutes
- 10.2.3. Other End Users
- 10.1. Market Analysis, Insights and Forecast - by Solution
- 11. North America Radiation Shielding Industry Analysis, Insights and Forecast, 2019-2031
- 11.1. Market Analysis, Insights and Forecast - By Country/Sub-region
- 11.1.1 United States
- 11.1.2 Canada
- 11.1.3 Mexico
- 12. South America Radiation Shielding Industry Analysis, Insights and Forecast, 2019-2031
- 12.1. Market Analysis, Insights and Forecast - By Country/Sub-region
- 12.1.1 Brazil
- 12.1.2 Mexico
- 12.1.3 Rest of South America
- 13. Europe Radiation Shielding Industry Analysis, Insights and Forecast, 2019-2031
- 13.1. Market Analysis, Insights and Forecast - By Country/Sub-region
- 13.1.1 United Kingdom
- 13.1.2 Germany
- 13.1.3 France
- 13.1.4 Italy
- 13.1.5 Spain
- 13.1.6 Russia
- 13.1.7 Rest of Europe
- 14. Asia Pacific Radiation Shielding Industry Analysis, Insights and Forecast, 2019-2031
- 14.1. Market Analysis, Insights and Forecast - By Country/Sub-region
- 14.1.1 China
- 14.1.2 Japan
- 14.1.3 India
- 14.1.4 South Korea
- 14.1.5 Taiwan
- 14.1.6 Australia
- 14.1.7 Rest of Asia-Pacific
- 15. MEA Radiation Shielding Industry Analysis, Insights and Forecast, 2019-2031
- 15.1. Market Analysis, Insights and Forecast - By Country/Sub-region
- 15.1.1 Middle East
- 15.1.2 Africa
- 16. Competitive Analysis
- 16.1. Global Market Share Analysis 2024
- 16.2. Company Profiles
- 16.2.1 Gaven Industries Inc
- 16.2.1.1. Overview
- 16.2.1.2. Products
- 16.2.1.3. SWOT Analysis
- 16.2.1.4. Recent Developments
- 16.2.1.5. Financials (Based on Availability)
- 16.2.2 Marshield
- 16.2.2.1. Overview
- 16.2.2.2. Products
- 16.2.2.3. SWOT Analysis
- 16.2.2.4. Recent Developments
- 16.2.2.5. Financials (Based on Availability)
- 16.2.3 Amray Medical
- 16.2.3.1. Overview
- 16.2.3.2. Products
- 16.2.3.3. SWOT Analysis
- 16.2.3.4. Recent Developments
- 16.2.3.5. Financials (Based on Availability)
- 16.2.4 Radiation Protection Products Inc
- 16.2.4.1. Overview
- 16.2.4.2. Products
- 16.2.4.3. SWOT Analysis
- 16.2.4.4. Recent Developments
- 16.2.4.5. Financials (Based on Availability)
- 16.2.5 ESCO Technologies Inc
- 16.2.5.1. Overview
- 16.2.5.2. Products
- 16.2.5.3. SWOT Analysis
- 16.2.5.4. Recent Developments
- 16.2.5.5. Financials (Based on Availability)
- 16.2.6 Nelco Inc
- 16.2.6.1. Overview
- 16.2.6.2. Products
- 16.2.6.3. SWOT Analysis
- 16.2.6.4. Recent Developments
- 16.2.6.5. Financials (Based on Availability)
- 16.2.7 Global Partners in Shielding Inc
- 16.2.7.1. Overview
- 16.2.7.2. Products
- 16.2.7.3. SWOT Analysis
- 16.2.7.4. Recent Developments
- 16.2.7.5. Financials (Based on Availability)
- 16.2.8 Veritas Medical Solutions LLC*List Not Exhaustive
- 16.2.8.1. Overview
- 16.2.8.2. Products
- 16.2.8.3. SWOT Analysis
- 16.2.8.4. Recent Developments
- 16.2.8.5. Financials (Based on Availability)
- 16.2.9 A&L Shielding
- 16.2.9.1. Overview
- 16.2.9.2. Products
- 16.2.9.3. SWOT Analysis
- 16.2.9.4. Recent Developments
- 16.2.9.5. Financials (Based on Availability)
- 16.2.10 Ray-Bar Engineering Corp
- 16.2.10.1. Overview
- 16.2.10.2. Products
- 16.2.10.3. SWOT Analysis
- 16.2.10.4. Recent Developments
- 16.2.10.5. Financials (Based on Availability)
- 16.2.1 Gaven Industries Inc
List of Figures
- Figure 1: Global Radiation Shielding Industry Revenue Breakdown (Billion, %) by Region 2024 & 2032
- Figure 2: North America Radiation Shielding Industry Revenue (Billion), by Country 2024 & 2032
- Figure 3: North America Radiation Shielding Industry Revenue Share (%), by Country 2024 & 2032
- Figure 4: South America Radiation Shielding Industry Revenue (Billion), by Country 2024 & 2032
- Figure 5: South America Radiation Shielding Industry Revenue Share (%), by Country 2024 & 2032
- Figure 6: Europe Radiation Shielding Industry Revenue (Billion), by Country 2024 & 2032
- Figure 7: Europe Radiation Shielding Industry Revenue Share (%), by Country 2024 & 2032
- Figure 8: Asia Pacific Radiation Shielding Industry Revenue (Billion), by Country 2024 & 2032
- Figure 9: Asia Pacific Radiation Shielding Industry Revenue Share (%), by Country 2024 & 2032
- Figure 10: MEA Radiation Shielding Industry Revenue (Billion), by Country 2024 & 2032
- Figure 11: MEA Radiation Shielding Industry Revenue Share (%), by Country 2024 & 2032
- Figure 12: North America Radiation Shielding Industry Revenue (Billion), by Solution 2024 & 2032
- Figure 13: North America Radiation Shielding Industry Revenue Share (%), by Solution 2024 & 2032
- Figure 14: North America Radiation Shielding Industry Revenue (Billion), by End User 2024 & 2032
- Figure 15: North America Radiation Shielding Industry Revenue Share (%), by End User 2024 & 2032
- Figure 16: North America Radiation Shielding Industry Revenue (Billion), by Country 2024 & 2032
- Figure 17: North America Radiation Shielding Industry Revenue Share (%), by Country 2024 & 2032
- Figure 18: Europe Radiation Shielding Industry Revenue (Billion), by Solution 2024 & 2032
- Figure 19: Europe Radiation Shielding Industry Revenue Share (%), by Solution 2024 & 2032
- Figure 20: Europe Radiation Shielding Industry Revenue (Billion), by End User 2024 & 2032
- Figure 21: Europe Radiation Shielding Industry Revenue Share (%), by End User 2024 & 2032
- Figure 22: Europe Radiation Shielding Industry Revenue (Billion), by Country 2024 & 2032
- Figure 23: Europe Radiation Shielding Industry Revenue Share (%), by Country 2024 & 2032
- Figure 24: Asia Pacific Radiation Shielding Industry Revenue (Billion), by Solution 2024 & 2032
- Figure 25: Asia Pacific Radiation Shielding Industry Revenue Share (%), by Solution 2024 & 2032
- Figure 26: Asia Pacific Radiation Shielding Industry Revenue (Billion), by End User 2024 & 2032
- Figure 27: Asia Pacific Radiation Shielding Industry Revenue Share (%), by End User 2024 & 2032
- Figure 28: Asia Pacific Radiation Shielding Industry Revenue (Billion), by Country 2024 & 2032
- Figure 29: Asia Pacific Radiation Shielding Industry Revenue Share (%), by Country 2024 & 2032
- Figure 30: Middle East and Africa Radiation Shielding Industry Revenue (Billion), by Solution 2024 & 2032
- Figure 31: Middle East and Africa Radiation Shielding Industry Revenue Share (%), by Solution 2024 & 2032
- Figure 32: Middle East and Africa Radiation Shielding Industry Revenue (Billion), by End User 2024 & 2032
- Figure 33: Middle East and Africa Radiation Shielding Industry Revenue Share (%), by End User 2024 & 2032
- Figure 34: Middle East and Africa Radiation Shielding Industry Revenue (Billion), by Country 2024 & 2032
- Figure 35: Middle East and Africa Radiation Shielding Industry Revenue Share (%), by Country 2024 & 2032
- Figure 36: South America Radiation Shielding Industry Revenue (Billion), by Solution 2024 & 2032
- Figure 37: South America Radiation Shielding Industry Revenue Share (%), by Solution 2024 & 2032
- Figure 38: South America Radiation Shielding Industry Revenue (Billion), by End User 2024 & 2032
- Figure 39: South America Radiation Shielding Industry Revenue Share (%), by End User 2024 & 2032
- Figure 40: South America Radiation Shielding Industry Revenue (Billion), by Country 2024 & 2032
- Figure 41: South America Radiation Shielding Industry Revenue Share (%), by Country 2024 & 2032
List of Tables
- Table 1: Global Radiation Shielding Industry Revenue Billion Forecast, by Region 2019 & 2032
- Table 2: Global Radiation Shielding Industry Revenue Billion Forecast, by Solution 2019 & 2032
- Table 3: Global Radiation Shielding Industry Revenue Billion Forecast, by End User 2019 & 2032
- Table 4: Global Radiation Shielding Industry Revenue Billion Forecast, by Region 2019 & 2032
- Table 5: Global Radiation Shielding Industry Revenue Billion Forecast, by Country 2019 & 2032
- Table 6: United States Radiation Shielding Industry Revenue (Billion) Forecast, by Application 2019 & 2032
- Table 7: Canada Radiation Shielding Industry Revenue (Billion) Forecast, by Application 2019 & 2032
- Table 8: Mexico Radiation Shielding Industry Revenue (Billion) Forecast, by Application 2019 & 2032
- Table 9: Global Radiation Shielding Industry Revenue Billion Forecast, by Country 2019 & 2032
- Table 10: Brazil Radiation Shielding Industry Revenue (Billion) Forecast, by Application 2019 & 2032
- Table 11: Mexico Radiation Shielding Industry Revenue (Billion) Forecast, by Application 2019 & 2032
- Table 12: Rest of South America Radiation Shielding Industry Revenue (Billion) Forecast, by Application 2019 & 2032
- Table 13: Global Radiation Shielding Industry Revenue Billion Forecast, by Country 2019 & 2032
- Table 14: United Kingdom Radiation Shielding Industry Revenue (Billion) Forecast, by Application 2019 & 2032
- Table 15: Germany Radiation Shielding Industry Revenue (Billion) Forecast, by Application 2019 & 2032
- Table 16: France Radiation Shielding Industry Revenue (Billion) Forecast, by Application 2019 & 2032
- Table 17: Italy Radiation Shielding Industry Revenue (Billion) Forecast, by Application 2019 & 2032
- Table 18: Spain Radiation Shielding Industry Revenue (Billion) Forecast, by Application 2019 & 2032
- Table 19: Russia Radiation Shielding Industry Revenue (Billion) Forecast, by Application 2019 & 2032
- Table 20: Rest of Europe Radiation Shielding Industry Revenue (Billion) Forecast, by Application 2019 & 2032
- Table 21: Global Radiation Shielding Industry Revenue Billion Forecast, by Country 2019 & 2032
- Table 22: China Radiation Shielding Industry Revenue (Billion) Forecast, by Application 2019 & 2032
- Table 23: Japan Radiation Shielding Industry Revenue (Billion) Forecast, by Application 2019 & 2032
- Table 24: India Radiation Shielding Industry Revenue (Billion) Forecast, by Application 2019 & 2032
- Table 25: South Korea Radiation Shielding Industry Revenue (Billion) Forecast, by Application 2019 & 2032
- Table 26: Taiwan Radiation Shielding Industry Revenue (Billion) Forecast, by Application 2019 & 2032
- Table 27: Australia Radiation Shielding Industry Revenue (Billion) Forecast, by Application 2019 & 2032
- Table 28: Rest of Asia-Pacific Radiation Shielding Industry Revenue (Billion) Forecast, by Application 2019 & 2032
- Table 29: Global Radiation Shielding Industry Revenue Billion Forecast, by Country 2019 & 2032
- Table 30: Middle East Radiation Shielding Industry Revenue (Billion) Forecast, by Application 2019 & 2032
- Table 31: Africa Radiation Shielding Industry Revenue (Billion) Forecast, by Application 2019 & 2032
- Table 32: Global Radiation Shielding Industry Revenue Billion Forecast, by Solution 2019 & 2032
- Table 33: Global Radiation Shielding Industry Revenue Billion Forecast, by End User 2019 & 2032
- Table 34: Global Radiation Shielding Industry Revenue Billion Forecast, by Country 2019 & 2032
- Table 35: United States Radiation Shielding Industry Revenue (Billion) Forecast, by Application 2019 & 2032
- Table 36: Canada Radiation Shielding Industry Revenue (Billion) Forecast, by Application 2019 & 2032
- Table 37: Mexico Radiation Shielding Industry Revenue (Billion) Forecast, by Application 2019 & 2032
- Table 38: Global Radiation Shielding Industry Revenue Billion Forecast, by Solution 2019 & 2032
- Table 39: Global Radiation Shielding Industry Revenue Billion Forecast, by End User 2019 & 2032
- Table 40: Global Radiation Shielding Industry Revenue Billion Forecast, by Country 2019 & 2032
- Table 41: Germany Radiation Shielding Industry Revenue (Billion) Forecast, by Application 2019 & 2032
- Table 42: United Kingdom Radiation Shielding Industry Revenue (Billion) Forecast, by Application 2019 & 2032
- Table 43: France Radiation Shielding Industry Revenue (Billion) Forecast, by Application 2019 & 2032
- Table 44: Italy Radiation Shielding Industry Revenue (Billion) Forecast, by Application 2019 & 2032
- Table 45: Spain Radiation Shielding Industry Revenue (Billion) Forecast, by Application 2019 & 2032
- Table 46: Rest of Europe Radiation Shielding Industry Revenue (Billion) Forecast, by Application 2019 & 2032
- Table 47: Global Radiation Shielding Industry Revenue Billion Forecast, by Solution 2019 & 2032
- Table 48: Global Radiation Shielding Industry Revenue Billion Forecast, by End User 2019 & 2032
- Table 49: Global Radiation Shielding Industry Revenue Billion Forecast, by Country 2019 & 2032
- Table 50: China Radiation Shielding Industry Revenue (Billion) Forecast, by Application 2019 & 2032
- Table 51: Japan Radiation Shielding Industry Revenue (Billion) Forecast, by Application 2019 & 2032
- Table 52: India Radiation Shielding Industry Revenue (Billion) Forecast, by Application 2019 & 2032
- Table 53: Australia Radiation Shielding Industry Revenue (Billion) Forecast, by Application 2019 & 2032
- Table 54: South Korea Radiation Shielding Industry Revenue (Billion) Forecast, by Application 2019 & 2032
- Table 55: Rest of Asia Pacific Radiation Shielding Industry Revenue (Billion) Forecast, by Application 2019 & 2032
- Table 56: Global Radiation Shielding Industry Revenue Billion Forecast, by Solution 2019 & 2032
- Table 57: Global Radiation Shielding Industry Revenue Billion Forecast, by End User 2019 & 2032
- Table 58: Global Radiation Shielding Industry Revenue Billion Forecast, by Country 2019 & 2032
- Table 59: GCC Radiation Shielding Industry Revenue (Billion) Forecast, by Application 2019 & 2032
- Table 60: South Africa Radiation Shielding Industry Revenue (Billion) Forecast, by Application 2019 & 2032
- Table 61: Rest of Middle East and Africa Radiation Shielding Industry Revenue (Billion) Forecast, by Application 2019 & 2032
- Table 62: Global Radiation Shielding Industry Revenue Billion Forecast, by Solution 2019 & 2032
- Table 63: Global Radiation Shielding Industry Revenue Billion Forecast, by End User 2019 & 2032
- Table 64: Global Radiation Shielding Industry Revenue Billion Forecast, by Country 2019 & 2032
- Table 65: Brazil Radiation Shielding Industry Revenue (Billion) Forecast, by Application 2019 & 2032
- Table 66: Argentina Radiation Shielding Industry Revenue (Billion) Forecast, by Application 2019 & 2032
- Table 67: Rest of South America Radiation Shielding Industry Revenue (Billion) Forecast, by Application 2019 & 2032
Frequently Asked Questions
1. What is the projected Compound Annual Growth Rate (CAGR) of the Radiation Shielding Industry?
The projected CAGR is approximately 4.60%.
2. Which companies are prominent players in the Radiation Shielding Industry?
Key companies in the market include Gaven Industries Inc, Marshield, Amray Medical, Radiation Protection Products Inc, ESCO Technologies Inc, Nelco Inc, Global Partners in Shielding Inc, Veritas Medical Solutions LLC*List Not Exhaustive, A&L Shielding, Ray-Bar Engineering Corp.
3. What are the main segments of the Radiation Shielding Industry?
The market segments include Solution, End User.
4. Can you provide details about the market size?
The market size is estimated to be USD 1.8 Billion as of 2022.
5. What are some drivers contributing to market growth?
Increasing Usage of Nuclear Medicine and Radiation Therapy for Diagnosis and Treatment; Rising Burden of Chronic Diseases; Growing Safety Awareness Among People Working in Radiation-prone Environments.
6. What are the notable trends driving market growth?
Diagnostic Shielding Holds Significant Share in the Global Medical Radiation Shielding Market.
7. Are there any restraints impacting market growth?
Lack of Awareness Among Healthcare Professionals; High Cost of Radiation Shielding.
8. Can you provide examples of recent developments in the market?
In April 2022, Radiaction Medical Ltd. received Food and Drug Administration 510(K) clearance to market its RadiationShield System in the United States.
9. What pricing options are available for accessing the report?
Pricing options include single-user, multi-user, and enterprise licenses priced at USD 4750, USD 5250, and USD 8750 respectively.
10. Is the market size provided in terms of value or volume?
The market size is provided in terms of value, measured in Billion.
11. Are there any specific market keywords associated with the report?
Yes, the market keyword associated with the report is "Radiation Shielding Industry," which aids in identifying and referencing the specific market segment covered.
12. How do I determine which pricing option suits my needs best?
The pricing options vary based on user requirements and access needs. Individual users may opt for single-user licenses, while businesses requiring broader access may choose multi-user or enterprise licenses for cost-effective access to the report.
13. Are there any additional resources or data provided in the Radiation Shielding Industry report?
While the report offers comprehensive insights, it's advisable to review the specific contents or supplementary materials provided to ascertain if additional resources or data are available.
14. How can I stay updated on further developments or reports in the Radiation Shielding Industry?
To stay informed about further developments, trends, and reports in the Radiation Shielding Industry, consider subscribing to industry newsletters, following relevant companies and organizations, or regularly checking reputable industry news sources and publications.
Methodology
Step 1 - Identification of Relevant Samples Size from Population Database


Step 2 - Approaches for Defining Global Market Size (Value, Volume* & Price*)

Note*: In applicable scenarios
Step 3 - Data Sources
Primary Research
- Web Analytics
- Survey Reports
- Research Institute
- Latest Research Reports
- Opinion Leaders
Secondary Research
- Annual Reports
- White Paper
- Latest Press Release
- Industry Association
- Paid Database
- Investor Presentations

Step 4 - Data Triangulation
Involves using different sources of information in order to increase the validity of a study
These sources are likely to be stakeholders in a program - participants, other researchers, program staff, other community members, and so on.
Then we put all data in single framework & apply various statistical tools to find out the dynamic on the market.
During the analysis stage, feedback from the stakeholder groups would be compared to determine areas of agreement as well as areas of divergence


