
Key Insights
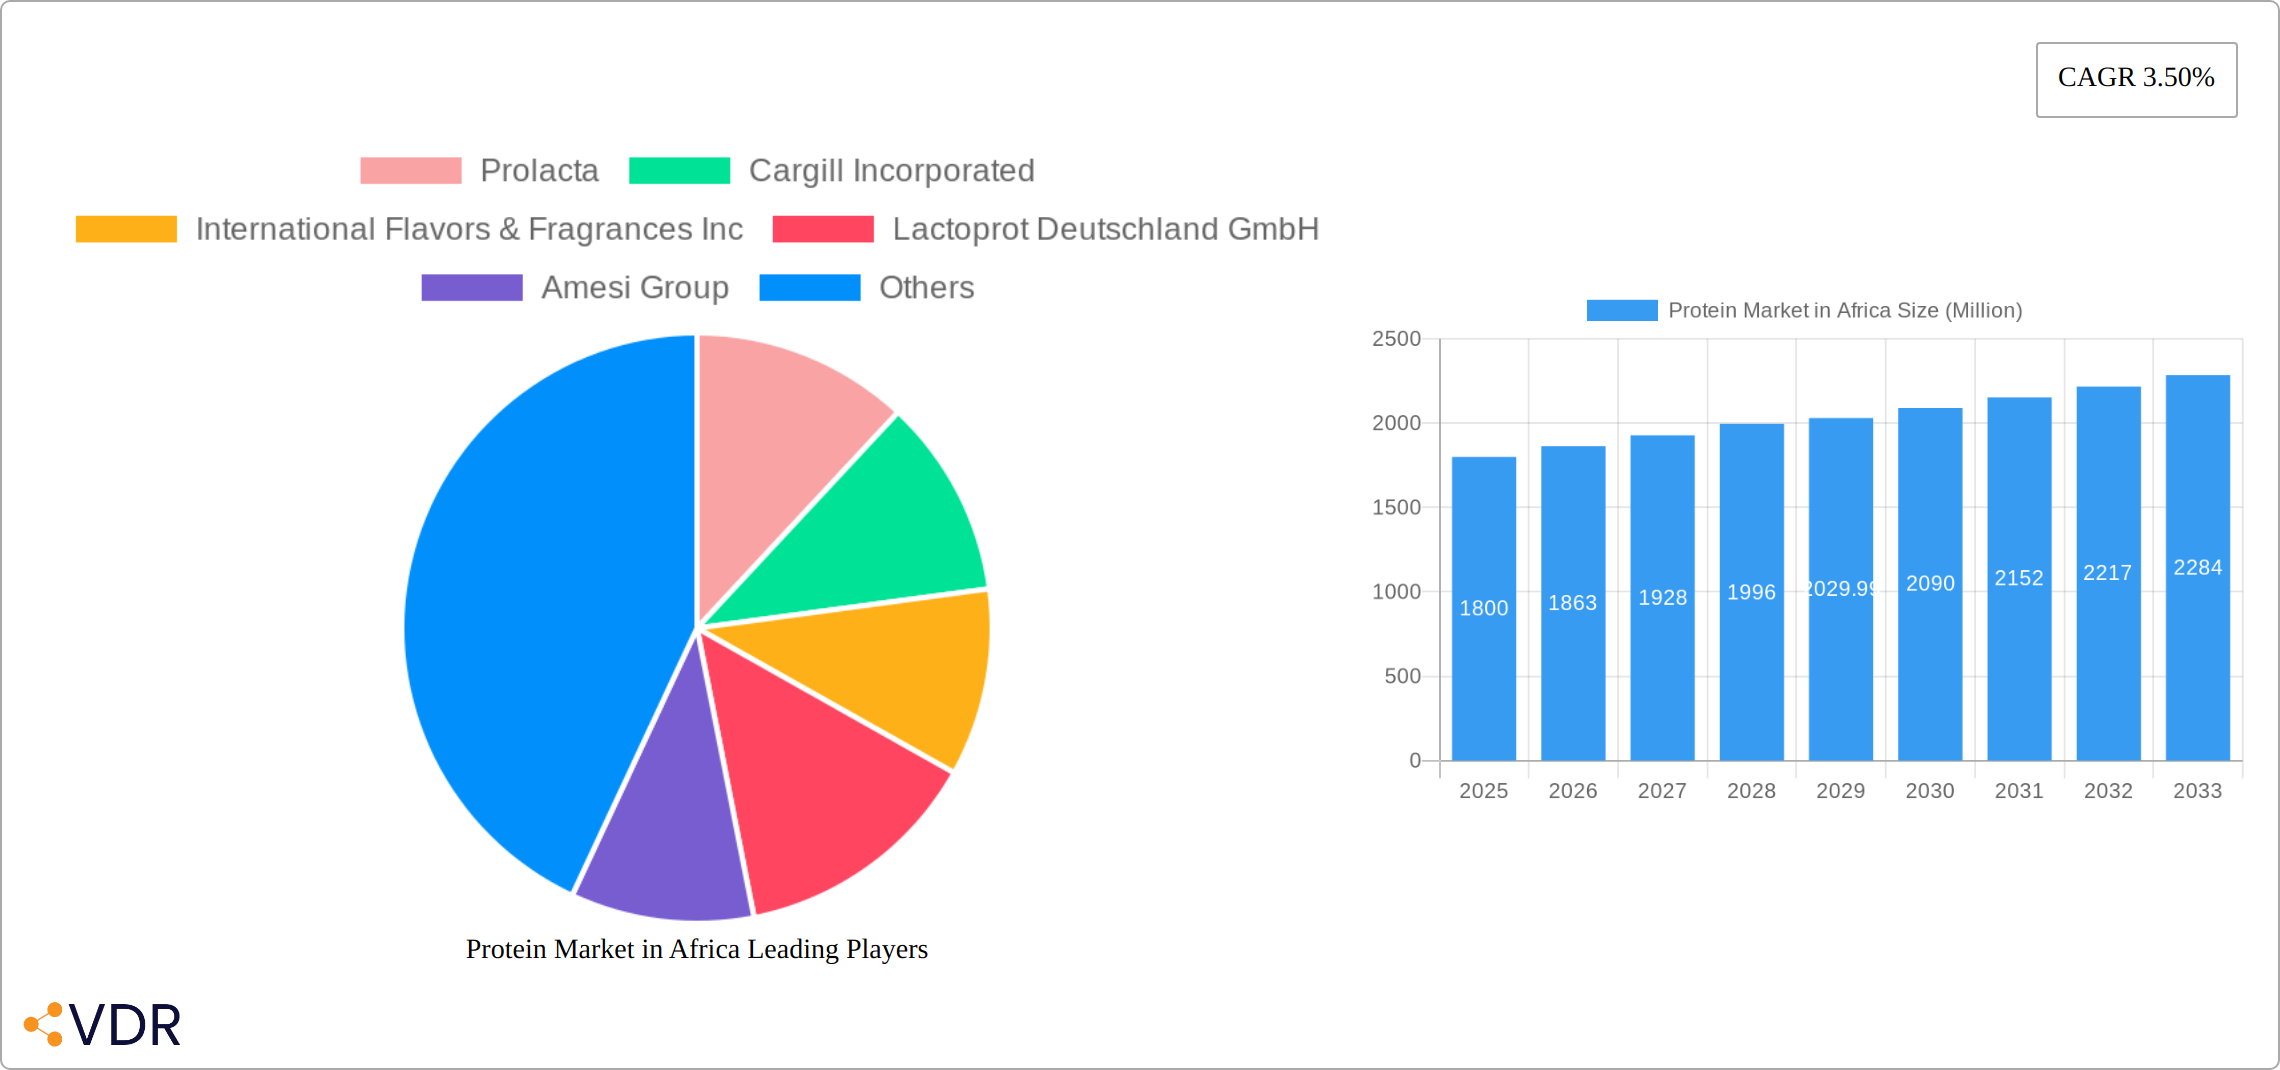
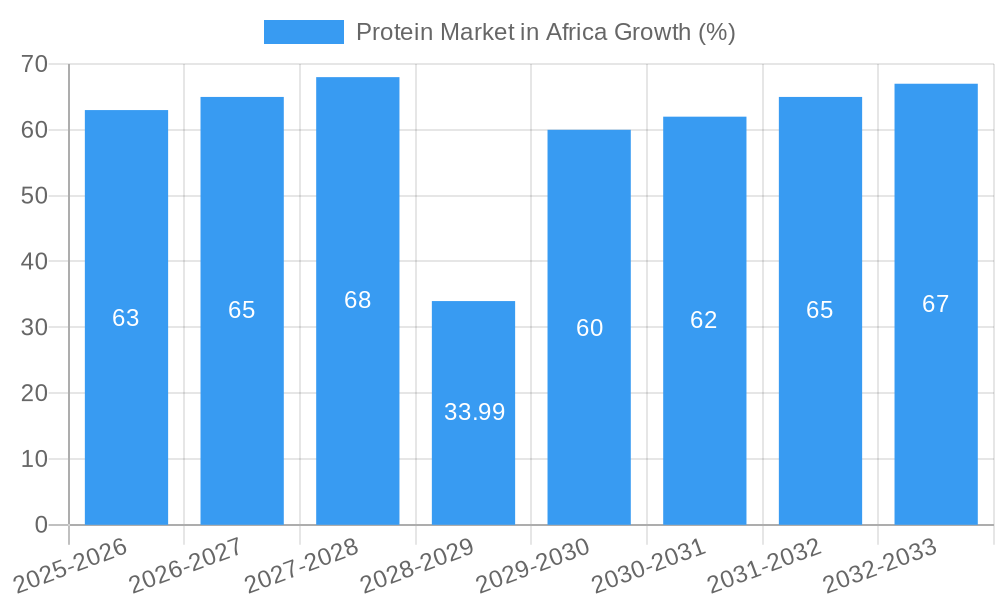
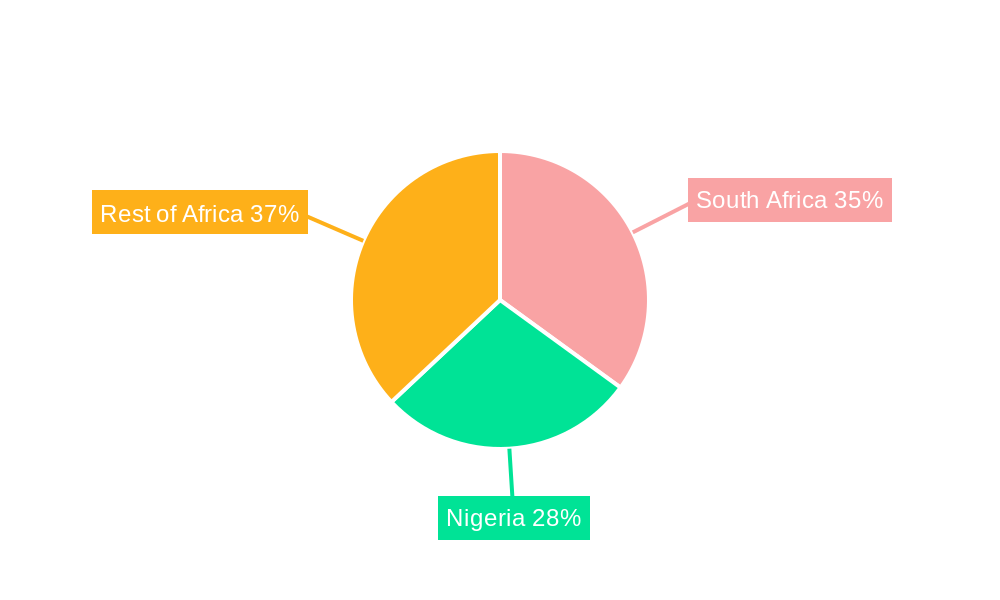
The African protein market, projected to reach $2029.99 million by 2029, exhibits a robust Compound Annual Growth Rate (CAGR) of 3.50%. This growth is fueled by several key drivers. Rising incomes and a burgeoning population are increasing demand for protein-rich foods across various segments, particularly in animal feed and the food and beverage industries. Furthermore, the expanding middle class is driving consumption of higher-value protein sources. South Africa and Nigeria represent significant market share, due to their larger economies and populations, while other countries like Kenya, Uganda, and Tanzania show promising growth potential. The increasing focus on sustainable and ethical sourcing of protein is also shaping market trends, with a growing interest in plant-based proteins to complement traditional animal-derived sources. However, challenges such as inconsistent agricultural practices and infrastructure limitations in certain regions pose restraints to market expansion. Addressing these challenges through investments in agricultural technology and infrastructure development will be crucial for unlocking the market's full potential.
The market segmentation reveals diverse opportunities. Animal-sourced proteins currently dominate, but the plant-based protein segment is experiencing rapid growth driven by health consciousness and environmental concerns. The animal feed sector is a major consumer of protein, reflecting the growing livestock industry in Africa. The food and beverage sector utilizes protein for diverse applications, ranging from dairy products and meat alternatives to protein bars and functional beverages. Key players like Prolacta, Cargill, and IFF are actively participating, driving innovation and competition. The forecast period (2025-2033) suggests continued growth trajectory, driven by factors mentioned above, indicating promising investment opportunities for businesses operating in or looking to enter this dynamic market.
This comprehensive report provides an in-depth analysis of the burgeoning protein market in Africa, encompassing market dynamics, growth trends, regional dominance, product landscapes, key players, and future outlooks. The study period covers 2019-2033, with 2025 as the base and estimated year. This report is essential for industry professionals, investors, and anyone seeking to understand the opportunities and challenges within this rapidly evolving sector.
Protein Market in Africa Market Dynamics & Structure
The African protein market is characterized by a complex interplay of factors influencing its structure and growth trajectory. Market concentration is currently moderate, with a few large multinational players like Cargill Incorporated and Kerry Group plc alongside a number of regional and local companies. Technological innovation, particularly in plant-based protein sources, is a significant driver. Regulatory frameworks vary across African nations, impacting both production and distribution. Competitive substitutes, such as traditional protein sources, exert pressure, while the growing health-conscious population fuels demand for alternative protein options. Mergers and acquisitions (M&A) are shaping the market landscape, with significant deals recorded.
- Market Concentration: Moderate, with xx% market share held by top 5 players in 2025.
- Technological Innovation: Strong focus on plant-based protein and improving animal feed efficiency.
- Regulatory Frameworks: Vary significantly across countries, impacting market access and product standards.
- Competitive Substitutes: Traditional protein sources, such as meat and dairy, remain dominant but face competition from plant-based options.
- End-User Demographics: Growing population, rising middle class, and increasing health awareness fuel demand.
- M&A Trends: xx major M&A deals in the last five years, indicating a consolidating market. Average deal value: xx Million units.
Protein Market in Africa Growth Trends & Insights
The African protein market exhibits robust growth, driven by several factors. Market size is expanding significantly, with a projected Compound Annual Growth Rate (CAGR) of xx% from 2025 to 2033. This growth is fuelled by increasing population, rising disposable incomes, and changing dietary habits. Technological disruptions, including innovations in plant-based protein production and efficient animal feed formulations, are further accelerating adoption rates. Consumer behavior is shifting towards healthier and more sustainable protein sources. Market penetration of plant-based proteins is increasing steadily, reaching xx% in 2025.
Dominant Regions, Countries, or Segments in Protein Market in Africa
South Africa and Nigeria represent the largest national markets for protein, followed by the rest of Africa. The animal protein segment (primarily meat and dairy) currently holds the largest market share, however, the plant-based protein segment shows the highest growth potential. Within end-users, the animal feed industry is a major consumer of protein, while the food and beverage sector exhibits strong growth prospects in value-added products.
- Leading Region: South Africa, owing to its advanced infrastructure and larger economy.
- Leading Country: Nigeria, due to its high population density and rapid economic growth.
- Fastest-Growing Segment: Plant-based protein, driven by health consciousness and sustainability concerns.
- Key Drivers: Government initiatives, increasing urbanization, and improving infrastructure in key regions.
Protein Market in Africa Product Landscape
The protein market showcases a diverse range of products, including animal-sourced proteins (meat, dairy, eggs), and plant-based proteins (soy, pea, etc.). Innovation focuses on developing functional proteins with enhanced nutritional value and improved processing capabilities. Novel food technologies and sustainable sourcing methods are gaining traction. Key selling propositions emphasize health benefits, taste, and convenience.
Key Drivers, Barriers & Challenges in Protein Market in Africa
Key Drivers:
- Growing population and rising middle class.
- Increasing demand for high-protein foods.
- Growing awareness of health and nutrition.
- Government initiatives promoting food security and nutrition.
Key Challenges:
- Limited infrastructure in some regions.
- High cost of production and distribution.
- Regulatory hurdles for certain protein sources.
- Competition from traditional protein sources.
- Climate change impacts on agricultural production.
Emerging Opportunities in Protein Market in Africa
The African protein market presents significant untapped potential. Emerging opportunities include:
- Expanding into underserved markets.
- Developing value-added protein products.
- Catering to specific dietary needs (vegan, vegetarian).
- Leveraging technology to enhance production efficiency.
- Promoting sustainable and ethical sourcing practices.
Growth Accelerators in the Protein Market in Africa Industry
Strategic partnerships between multinational companies and local producers can accelerate market growth by leveraging expertise and fostering capacity building. Investing in R&D to develop innovative protein sources tailored to the African context and further enhancing processing technologies are also key growth catalysts. Government policies supporting agricultural development and food security can further strengthen the sector.
Key Players Shaping the Protein Market in Africa Market
- Prolacta
- Cargill Incorporated
- International Flavors & Fragrances Inc
- Lactoprot Deutschland GmbH
- Amesi Group
- Fonterra Co-operative Group Limited
- Hilmar Cheese Company Inc
- Kerry Group plc
- Tiger Brands Limited
- RCL Foods Limited
Notable Milestones in Protein Market in Africa Sector
- April 2018: Kerry Group acquired Dutch plant-based protein manufacturer Ojah BV, expanding its soy protein portfolio.
- June 2020: Kerry Group launched 13 new plant protein ingredients, boosting its offerings in the food and beverage sector.
- February 2021: DuPont's Nutrition & Biosciences merged with IFF, creating a stronger player in soy protein ingredients.
In-Depth Protein Market in Africa Market Outlook
The African protein market is poised for continued strong growth, driven by favourable demographic trends, increasing consumer demand for protein-rich foods, and technological advancements in protein production and processing. Strategic investments in infrastructure, sustainable farming practices, and value chain development will be crucial in unlocking the market's full potential. The increasing focus on plant-based proteins presents a significant opportunity for growth and diversification within the sector.
Protein Market in Africa Segmentation
-
1. Source
-
1.1. Animal
-
1.1.1. By Protein Type
- 1.1.1.1. Casein and Caseinates
- 1.1.1.2. Collagen
- 1.1.1.3. Egg Protein
- 1.1.1.4. Gelatin
- 1.1.1.5. Insect Protein
- 1.1.1.6. Milk Protein
- 1.1.1.7. Whey Protein
- 1.1.1.8. Other Animal Protein
-
1.1.1. By Protein Type
-
1.2. Microbial
- 1.2.1. Algae Protein
- 1.2.2. Mycoprotein
-
1.3. Plant
- 1.3.1. Hemp Protein
- 1.3.2. Pea Protein
- 1.3.3. Potato Protein
- 1.3.4. Rice Protein
- 1.3.5. Soy Protein
- 1.3.6. Wheat Protein
- 1.3.7. Other Plant Protein
-
1.1. Animal
-
2. End User
- 2.1. Animal Feed
-
2.2. Food and Beverages
-
2.2.1. By Sub End User
- 2.2.1.1. Bakery
- 2.2.1.2. Breakfast Cereals
- 2.2.1.3. Condiments/Sauces
- 2.2.1.4. Confectionery
- 2.2.1.5. Dairy and Dairy Alternative Products
- 2.2.1.6. Meat/Poultry/Seafood and Meat Alternative Products
- 2.2.1.7. RTE/RTC Food Products
- 2.2.1.8. Snacks
-
2.2.1. By Sub End User
- 2.3. Personal Care and Cosmetics
-
2.4. Supplements
- 2.4.1. Baby Food and Infant Formula
- 2.4.2. Elderly Nutrition and Medical Nutrition
- 2.4.3. Sport/Performance Nutrition
Protein Market in Africa Segmentation By Geography
-
1. North America
- 1.1. United States
- 1.2. Canada
- 1.3. Mexico
-
2. South America
- 2.1. Brazil
- 2.2. Argentina
- 2.3. Rest of South America
-
3. Europe
- 3.1. United Kingdom
- 3.2. Germany
- 3.3. France
- 3.4. Italy
- 3.5. Spain
- 3.6. Russia
- 3.7. Benelux
- 3.8. Nordics
- 3.9. Rest of Europe
-
4. Middle East & Africa
- 4.1. Turkey
- 4.2. Israel
- 4.3. GCC
- 4.4. North Africa
- 4.5. South Africa
- 4.6. Rest of Middle East & Africa
-
5. Asia Pacific
- 5.1. China
- 5.2. India
- 5.3. Japan
- 5.4. South Korea
- 5.5. ASEAN
- 5.6. Oceania
- 5.7. Rest of Asia Pacific
Protein Market in Africa REPORT HIGHLIGHTS
| Aspects | Details |
|---|---|
| Study Period | 2019-2033 |
| Base Year | 2024 |
| Estimated Year | 2025 |
| Forecast Period | 2025-2033 |
| Historical Period | 2019-2024 |
| Growth Rate | CAGR of 3.50% from 2019-2033 |
| Segmentation |
|
Table of Contents
- 1. Introduction
- 1.1. Research Scope
- 1.2. Market Segmentation
- 1.3. Research Methodology
- 1.4. Definitions and Assumptions
- 2. Executive Summary
- 2.1. Introduction
- 3. Market Dynamics
- 3.1. Introduction
- 3.2. Market Drivers
- 3.2.1. Increasing Demand For Convenience & Processed Food
- 3.3. Market Restrains
- 3.3.1. Increased Consumer Awareness On Side-Effects Of Chemical Additives
- 3.4. Market Trends
- 3.4.1. OTHER KEY INDUSTRY TRENDS COVERED IN THE REPORT
- 4. Market Factor Analysis
- 4.1. Porters Five Forces
- 4.2. Supply/Value Chain
- 4.3. PESTEL analysis
- 4.4. Market Entropy
- 4.5. Patent/Trademark Analysis
- 5. Global Protein Market in Africa Analysis, Insights and Forecast, 2019-2031
- 5.1. Market Analysis, Insights and Forecast - by Source
- 5.1.1. Animal
- 5.1.1.1. By Protein Type
- 5.1.1.1.1. Casein and Caseinates
- 5.1.1.1.2. Collagen
- 5.1.1.1.3. Egg Protein
- 5.1.1.1.4. Gelatin
- 5.1.1.1.5. Insect Protein
- 5.1.1.1.6. Milk Protein
- 5.1.1.1.7. Whey Protein
- 5.1.1.1.8. Other Animal Protein
- 5.1.1.1. By Protein Type
- 5.1.2. Microbial
- 5.1.2.1. Algae Protein
- 5.1.2.2. Mycoprotein
- 5.1.3. Plant
- 5.1.3.1. Hemp Protein
- 5.1.3.2. Pea Protein
- 5.1.3.3. Potato Protein
- 5.1.3.4. Rice Protein
- 5.1.3.5. Soy Protein
- 5.1.3.6. Wheat Protein
- 5.1.3.7. Other Plant Protein
- 5.1.1. Animal
- 5.2. Market Analysis, Insights and Forecast - by End User
- 5.2.1. Animal Feed
- 5.2.2. Food and Beverages
- 5.2.2.1. By Sub End User
- 5.2.2.1.1. Bakery
- 5.2.2.1.2. Breakfast Cereals
- 5.2.2.1.3. Condiments/Sauces
- 5.2.2.1.4. Confectionery
- 5.2.2.1.5. Dairy and Dairy Alternative Products
- 5.2.2.1.6. Meat/Poultry/Seafood and Meat Alternative Products
- 5.2.2.1.7. RTE/RTC Food Products
- 5.2.2.1.8. Snacks
- 5.2.2.1. By Sub End User
- 5.2.3. Personal Care and Cosmetics
- 5.2.4. Supplements
- 5.2.4.1. Baby Food and Infant Formula
- 5.2.4.2. Elderly Nutrition and Medical Nutrition
- 5.2.4.3. Sport/Performance Nutrition
- 5.3. Market Analysis, Insights and Forecast - by Region
- 5.3.1. North America
- 5.3.2. South America
- 5.3.3. Europe
- 5.3.4. Middle East & Africa
- 5.3.5. Asia Pacific
- 5.1. Market Analysis, Insights and Forecast - by Source
- 6. North America Protein Market in Africa Analysis, Insights and Forecast, 2019-2031
- 6.1. Market Analysis, Insights and Forecast - by Source
- 6.1.1. Animal
- 6.1.1.1. By Protein Type
- 6.1.1.1.1. Casein and Caseinates
- 6.1.1.1.2. Collagen
- 6.1.1.1.3. Egg Protein
- 6.1.1.1.4. Gelatin
- 6.1.1.1.5. Insect Protein
- 6.1.1.1.6. Milk Protein
- 6.1.1.1.7. Whey Protein
- 6.1.1.1.8. Other Animal Protein
- 6.1.1.1. By Protein Type
- 6.1.2. Microbial
- 6.1.2.1. Algae Protein
- 6.1.2.2. Mycoprotein
- 6.1.3. Plant
- 6.1.3.1. Hemp Protein
- 6.1.3.2. Pea Protein
- 6.1.3.3. Potato Protein
- 6.1.3.4. Rice Protein
- 6.1.3.5. Soy Protein
- 6.1.3.6. Wheat Protein
- 6.1.3.7. Other Plant Protein
- 6.1.1. Animal
- 6.2. Market Analysis, Insights and Forecast - by End User
- 6.2.1. Animal Feed
- 6.2.2. Food and Beverages
- 6.2.2.1. By Sub End User
- 6.2.2.1.1. Bakery
- 6.2.2.1.2. Breakfast Cereals
- 6.2.2.1.3. Condiments/Sauces
- 6.2.2.1.4. Confectionery
- 6.2.2.1.5. Dairy and Dairy Alternative Products
- 6.2.2.1.6. Meat/Poultry/Seafood and Meat Alternative Products
- 6.2.2.1.7. RTE/RTC Food Products
- 6.2.2.1.8. Snacks
- 6.2.2.1. By Sub End User
- 6.2.3. Personal Care and Cosmetics
- 6.2.4. Supplements
- 6.2.4.1. Baby Food and Infant Formula
- 6.2.4.2. Elderly Nutrition and Medical Nutrition
- 6.2.4.3. Sport/Performance Nutrition
- 6.1. Market Analysis, Insights and Forecast - by Source
- 7. South America Protein Market in Africa Analysis, Insights and Forecast, 2019-2031
- 7.1. Market Analysis, Insights and Forecast - by Source
- 7.1.1. Animal
- 7.1.1.1. By Protein Type
- 7.1.1.1.1. Casein and Caseinates
- 7.1.1.1.2. Collagen
- 7.1.1.1.3. Egg Protein
- 7.1.1.1.4. Gelatin
- 7.1.1.1.5. Insect Protein
- 7.1.1.1.6. Milk Protein
- 7.1.1.1.7. Whey Protein
- 7.1.1.1.8. Other Animal Protein
- 7.1.1.1. By Protein Type
- 7.1.2. Microbial
- 7.1.2.1. Algae Protein
- 7.1.2.2. Mycoprotein
- 7.1.3. Plant
- 7.1.3.1. Hemp Protein
- 7.1.3.2. Pea Protein
- 7.1.3.3. Potato Protein
- 7.1.3.4. Rice Protein
- 7.1.3.5. Soy Protein
- 7.1.3.6. Wheat Protein
- 7.1.3.7. Other Plant Protein
- 7.1.1. Animal
- 7.2. Market Analysis, Insights and Forecast - by End User
- 7.2.1. Animal Feed
- 7.2.2. Food and Beverages
- 7.2.2.1. By Sub End User
- 7.2.2.1.1. Bakery
- 7.2.2.1.2. Breakfast Cereals
- 7.2.2.1.3. Condiments/Sauces
- 7.2.2.1.4. Confectionery
- 7.2.2.1.5. Dairy and Dairy Alternative Products
- 7.2.2.1.6. Meat/Poultry/Seafood and Meat Alternative Products
- 7.2.2.1.7. RTE/RTC Food Products
- 7.2.2.1.8. Snacks
- 7.2.2.1. By Sub End User
- 7.2.3. Personal Care and Cosmetics
- 7.2.4. Supplements
- 7.2.4.1. Baby Food and Infant Formula
- 7.2.4.2. Elderly Nutrition and Medical Nutrition
- 7.2.4.3. Sport/Performance Nutrition
- 7.1. Market Analysis, Insights and Forecast - by Source
- 8. Europe Protein Market in Africa Analysis, Insights and Forecast, 2019-2031
- 8.1. Market Analysis, Insights and Forecast - by Source
- 8.1.1. Animal
- 8.1.1.1. By Protein Type
- 8.1.1.1.1. Casein and Caseinates
- 8.1.1.1.2. Collagen
- 8.1.1.1.3. Egg Protein
- 8.1.1.1.4. Gelatin
- 8.1.1.1.5. Insect Protein
- 8.1.1.1.6. Milk Protein
- 8.1.1.1.7. Whey Protein
- 8.1.1.1.8. Other Animal Protein
- 8.1.1.1. By Protein Type
- 8.1.2. Microbial
- 8.1.2.1. Algae Protein
- 8.1.2.2. Mycoprotein
- 8.1.3. Plant
- 8.1.3.1. Hemp Protein
- 8.1.3.2. Pea Protein
- 8.1.3.3. Potato Protein
- 8.1.3.4. Rice Protein
- 8.1.3.5. Soy Protein
- 8.1.3.6. Wheat Protein
- 8.1.3.7. Other Plant Protein
- 8.1.1. Animal
- 8.2. Market Analysis, Insights and Forecast - by End User
- 8.2.1. Animal Feed
- 8.2.2. Food and Beverages
- 8.2.2.1. By Sub End User
- 8.2.2.1.1. Bakery
- 8.2.2.1.2. Breakfast Cereals
- 8.2.2.1.3. Condiments/Sauces
- 8.2.2.1.4. Confectionery
- 8.2.2.1.5. Dairy and Dairy Alternative Products
- 8.2.2.1.6. Meat/Poultry/Seafood and Meat Alternative Products
- 8.2.2.1.7. RTE/RTC Food Products
- 8.2.2.1.8. Snacks
- 8.2.2.1. By Sub End User
- 8.2.3. Personal Care and Cosmetics
- 8.2.4. Supplements
- 8.2.4.1. Baby Food and Infant Formula
- 8.2.4.2. Elderly Nutrition and Medical Nutrition
- 8.2.4.3. Sport/Performance Nutrition
- 8.1. Market Analysis, Insights and Forecast - by Source
- 9. Middle East & Africa Protein Market in Africa Analysis, Insights and Forecast, 2019-2031
- 9.1. Market Analysis, Insights and Forecast - by Source
- 9.1.1. Animal
- 9.1.1.1. By Protein Type
- 9.1.1.1.1. Casein and Caseinates
- 9.1.1.1.2. Collagen
- 9.1.1.1.3. Egg Protein
- 9.1.1.1.4. Gelatin
- 9.1.1.1.5. Insect Protein
- 9.1.1.1.6. Milk Protein
- 9.1.1.1.7. Whey Protein
- 9.1.1.1.8. Other Animal Protein
- 9.1.1.1. By Protein Type
- 9.1.2. Microbial
- 9.1.2.1. Algae Protein
- 9.1.2.2. Mycoprotein
- 9.1.3. Plant
- 9.1.3.1. Hemp Protein
- 9.1.3.2. Pea Protein
- 9.1.3.3. Potato Protein
- 9.1.3.4. Rice Protein
- 9.1.3.5. Soy Protein
- 9.1.3.6. Wheat Protein
- 9.1.3.7. Other Plant Protein
- 9.1.1. Animal
- 9.2. Market Analysis, Insights and Forecast - by End User
- 9.2.1. Animal Feed
- 9.2.2. Food and Beverages
- 9.2.2.1. By Sub End User
- 9.2.2.1.1. Bakery
- 9.2.2.1.2. Breakfast Cereals
- 9.2.2.1.3. Condiments/Sauces
- 9.2.2.1.4. Confectionery
- 9.2.2.1.5. Dairy and Dairy Alternative Products
- 9.2.2.1.6. Meat/Poultry/Seafood and Meat Alternative Products
- 9.2.2.1.7. RTE/RTC Food Products
- 9.2.2.1.8. Snacks
- 9.2.2.1. By Sub End User
- 9.2.3. Personal Care and Cosmetics
- 9.2.4. Supplements
- 9.2.4.1. Baby Food and Infant Formula
- 9.2.4.2. Elderly Nutrition and Medical Nutrition
- 9.2.4.3. Sport/Performance Nutrition
- 9.1. Market Analysis, Insights and Forecast - by Source
- 10. Asia Pacific Protein Market in Africa Analysis, Insights and Forecast, 2019-2031
- 10.1. Market Analysis, Insights and Forecast - by Source
- 10.1.1. Animal
- 10.1.1.1. By Protein Type
- 10.1.1.1.1. Casein and Caseinates
- 10.1.1.1.2. Collagen
- 10.1.1.1.3. Egg Protein
- 10.1.1.1.4. Gelatin
- 10.1.1.1.5. Insect Protein
- 10.1.1.1.6. Milk Protein
- 10.1.1.1.7. Whey Protein
- 10.1.1.1.8. Other Animal Protein
- 10.1.1.1. By Protein Type
- 10.1.2. Microbial
- 10.1.2.1. Algae Protein
- 10.1.2.2. Mycoprotein
- 10.1.3. Plant
- 10.1.3.1. Hemp Protein
- 10.1.3.2. Pea Protein
- 10.1.3.3. Potato Protein
- 10.1.3.4. Rice Protein
- 10.1.3.5. Soy Protein
- 10.1.3.6. Wheat Protein
- 10.1.3.7. Other Plant Protein
- 10.1.1. Animal
- 10.2. Market Analysis, Insights and Forecast - by End User
- 10.2.1. Animal Feed
- 10.2.2. Food and Beverages
- 10.2.2.1. By Sub End User
- 10.2.2.1.1. Bakery
- 10.2.2.1.2. Breakfast Cereals
- 10.2.2.1.3. Condiments/Sauces
- 10.2.2.1.4. Confectionery
- 10.2.2.1.5. Dairy and Dairy Alternative Products
- 10.2.2.1.6. Meat/Poultry/Seafood and Meat Alternative Products
- 10.2.2.1.7. RTE/RTC Food Products
- 10.2.2.1.8. Snacks
- 10.2.2.1. By Sub End User
- 10.2.3. Personal Care and Cosmetics
- 10.2.4. Supplements
- 10.2.4.1. Baby Food and Infant Formula
- 10.2.4.2. Elderly Nutrition and Medical Nutrition
- 10.2.4.3. Sport/Performance Nutrition
- 10.1. Market Analysis, Insights and Forecast - by Source
- 11. South Africa Protein Market in Africa Analysis, Insights and Forecast, 2019-2031
- 12. Sudan Protein Market in Africa Analysis, Insights and Forecast, 2019-2031
- 13. Uganda Protein Market in Africa Analysis, Insights and Forecast, 2019-2031
- 14. Tanzania Protein Market in Africa Analysis, Insights and Forecast, 2019-2031
- 15. Kenya Protein Market in Africa Analysis, Insights and Forecast, 2019-2031
- 16. Rest of Africa Protein Market in Africa Analysis, Insights and Forecast, 2019-2031
- 17. Competitive Analysis
- 17.1. Global Market Share Analysis 2024
- 17.2. Company Profiles
- 17.2.1 Prolacta
- 17.2.1.1. Overview
- 17.2.1.2. Products
- 17.2.1.3. SWOT Analysis
- 17.2.1.4. Recent Developments
- 17.2.1.5. Financials (Based on Availability)
- 17.2.2 Cargill Incorporated
- 17.2.2.1. Overview
- 17.2.2.2. Products
- 17.2.2.3. SWOT Analysis
- 17.2.2.4. Recent Developments
- 17.2.2.5. Financials (Based on Availability)
- 17.2.3 International Flavors & Fragrances Inc
- 17.2.3.1. Overview
- 17.2.3.2. Products
- 17.2.3.3. SWOT Analysis
- 17.2.3.4. Recent Developments
- 17.2.3.5. Financials (Based on Availability)
- 17.2.4 Lactoprot Deutschland GmbH
- 17.2.4.1. Overview
- 17.2.4.2. Products
- 17.2.4.3. SWOT Analysis
- 17.2.4.4. Recent Developments
- 17.2.4.5. Financials (Based on Availability)
- 17.2.5 Amesi Group
- 17.2.5.1. Overview
- 17.2.5.2. Products
- 17.2.5.3. SWOT Analysis
- 17.2.5.4. Recent Developments
- 17.2.5.5. Financials (Based on Availability)
- 17.2.6 Fonterra Co-operative Group Limited
- 17.2.6.1. Overview
- 17.2.6.2. Products
- 17.2.6.3. SWOT Analysis
- 17.2.6.4. Recent Developments
- 17.2.6.5. Financials (Based on Availability)
- 17.2.7 Hilmar Cheese Company Inc
- 17.2.7.1. Overview
- 17.2.7.2. Products
- 17.2.7.3. SWOT Analysis
- 17.2.7.4. Recent Developments
- 17.2.7.5. Financials (Based on Availability)
- 17.2.8 Kerry Group plc
- 17.2.8.1. Overview
- 17.2.8.2. Products
- 17.2.8.3. SWOT Analysis
- 17.2.8.4. Recent Developments
- 17.2.8.5. Financials (Based on Availability)
- 17.2.9 Tiger Brands Limited
- 17.2.9.1. Overview
- 17.2.9.2. Products
- 17.2.9.3. SWOT Analysis
- 17.2.9.4. Recent Developments
- 17.2.9.5. Financials (Based on Availability)
- 17.2.10 RCL Foods Limited
- 17.2.10.1. Overview
- 17.2.10.2. Products
- 17.2.10.3. SWOT Analysis
- 17.2.10.4. Recent Developments
- 17.2.10.5. Financials (Based on Availability)
- 17.2.1 Prolacta
List of Figures
- Figure 1: Global Protein Market in Africa Revenue Breakdown (Million, %) by Region 2024 & 2032
- Figure 2: Global Protein Market in Africa Volume Breakdown (K Tons, %) by Region 2024 & 2032
- Figure 3: Africa Protein Market in Africa Revenue (Million), by Country 2024 & 2032
- Figure 4: Africa Protein Market in Africa Volume (K Tons), by Country 2024 & 2032
- Figure 5: Africa Protein Market in Africa Revenue Share (%), by Country 2024 & 2032
- Figure 6: Africa Protein Market in Africa Volume Share (%), by Country 2024 & 2032
- Figure 7: North America Protein Market in Africa Revenue (Million), by Source 2024 & 2032
- Figure 8: North America Protein Market in Africa Volume (K Tons), by Source 2024 & 2032
- Figure 9: North America Protein Market in Africa Revenue Share (%), by Source 2024 & 2032
- Figure 10: North America Protein Market in Africa Volume Share (%), by Source 2024 & 2032
- Figure 11: North America Protein Market in Africa Revenue (Million), by End User 2024 & 2032
- Figure 12: North America Protein Market in Africa Volume (K Tons), by End User 2024 & 2032
- Figure 13: North America Protein Market in Africa Revenue Share (%), by End User 2024 & 2032
- Figure 14: North America Protein Market in Africa Volume Share (%), by End User 2024 & 2032
- Figure 15: North America Protein Market in Africa Revenue (Million), by Country 2024 & 2032
- Figure 16: North America Protein Market in Africa Volume (K Tons), by Country 2024 & 2032
- Figure 17: North America Protein Market in Africa Revenue Share (%), by Country 2024 & 2032
- Figure 18: North America Protein Market in Africa Volume Share (%), by Country 2024 & 2032
- Figure 19: South America Protein Market in Africa Revenue (Million), by Source 2024 & 2032
- Figure 20: South America Protein Market in Africa Volume (K Tons), by Source 2024 & 2032
- Figure 21: South America Protein Market in Africa Revenue Share (%), by Source 2024 & 2032
- Figure 22: South America Protein Market in Africa Volume Share (%), by Source 2024 & 2032
- Figure 23: South America Protein Market in Africa Revenue (Million), by End User 2024 & 2032
- Figure 24: South America Protein Market in Africa Volume (K Tons), by End User 2024 & 2032
- Figure 25: South America Protein Market in Africa Revenue Share (%), by End User 2024 & 2032
- Figure 26: South America Protein Market in Africa Volume Share (%), by End User 2024 & 2032
- Figure 27: South America Protein Market in Africa Revenue (Million), by Country 2024 & 2032
- Figure 28: South America Protein Market in Africa Volume (K Tons), by Country 2024 & 2032
- Figure 29: South America Protein Market in Africa Revenue Share (%), by Country 2024 & 2032
- Figure 30: South America Protein Market in Africa Volume Share (%), by Country 2024 & 2032
- Figure 31: Europe Protein Market in Africa Revenue (Million), by Source 2024 & 2032
- Figure 32: Europe Protein Market in Africa Volume (K Tons), by Source 2024 & 2032
- Figure 33: Europe Protein Market in Africa Revenue Share (%), by Source 2024 & 2032
- Figure 34: Europe Protein Market in Africa Volume Share (%), by Source 2024 & 2032
- Figure 35: Europe Protein Market in Africa Revenue (Million), by End User 2024 & 2032
- Figure 36: Europe Protein Market in Africa Volume (K Tons), by End User 2024 & 2032
- Figure 37: Europe Protein Market in Africa Revenue Share (%), by End User 2024 & 2032
- Figure 38: Europe Protein Market in Africa Volume Share (%), by End User 2024 & 2032
- Figure 39: Europe Protein Market in Africa Revenue (Million), by Country 2024 & 2032
- Figure 40: Europe Protein Market in Africa Volume (K Tons), by Country 2024 & 2032
- Figure 41: Europe Protein Market in Africa Revenue Share (%), by Country 2024 & 2032
- Figure 42: Europe Protein Market in Africa Volume Share (%), by Country 2024 & 2032
- Figure 43: Middle East & Africa Protein Market in Africa Revenue (Million), by Source 2024 & 2032
- Figure 44: Middle East & Africa Protein Market in Africa Volume (K Tons), by Source 2024 & 2032
- Figure 45: Middle East & Africa Protein Market in Africa Revenue Share (%), by Source 2024 & 2032
- Figure 46: Middle East & Africa Protein Market in Africa Volume Share (%), by Source 2024 & 2032
- Figure 47: Middle East & Africa Protein Market in Africa Revenue (Million), by End User 2024 & 2032
- Figure 48: Middle East & Africa Protein Market in Africa Volume (K Tons), by End User 2024 & 2032
- Figure 49: Middle East & Africa Protein Market in Africa Revenue Share (%), by End User 2024 & 2032
- Figure 50: Middle East & Africa Protein Market in Africa Volume Share (%), by End User 2024 & 2032
- Figure 51: Middle East & Africa Protein Market in Africa Revenue (Million), by Country 2024 & 2032
- Figure 52: Middle East & Africa Protein Market in Africa Volume (K Tons), by Country 2024 & 2032
- Figure 53: Middle East & Africa Protein Market in Africa Revenue Share (%), by Country 2024 & 2032
- Figure 54: Middle East & Africa Protein Market in Africa Volume Share (%), by Country 2024 & 2032
- Figure 55: Asia Pacific Protein Market in Africa Revenue (Million), by Source 2024 & 2032
- Figure 56: Asia Pacific Protein Market in Africa Volume (K Tons), by Source 2024 & 2032
- Figure 57: Asia Pacific Protein Market in Africa Revenue Share (%), by Source 2024 & 2032
- Figure 58: Asia Pacific Protein Market in Africa Volume Share (%), by Source 2024 & 2032
- Figure 59: Asia Pacific Protein Market in Africa Revenue (Million), by End User 2024 & 2032
- Figure 60: Asia Pacific Protein Market in Africa Volume (K Tons), by End User 2024 & 2032
- Figure 61: Asia Pacific Protein Market in Africa Revenue Share (%), by End User 2024 & 2032
- Figure 62: Asia Pacific Protein Market in Africa Volume Share (%), by End User 2024 & 2032
- Figure 63: Asia Pacific Protein Market in Africa Revenue (Million), by Country 2024 & 2032
- Figure 64: Asia Pacific Protein Market in Africa Volume (K Tons), by Country 2024 & 2032
- Figure 65: Asia Pacific Protein Market in Africa Revenue Share (%), by Country 2024 & 2032
- Figure 66: Asia Pacific Protein Market in Africa Volume Share (%), by Country 2024 & 2032
List of Tables
- Table 1: Global Protein Market in Africa Revenue Million Forecast, by Region 2019 & 2032
- Table 2: Global Protein Market in Africa Volume K Tons Forecast, by Region 2019 & 2032
- Table 3: Global Protein Market in Africa Revenue Million Forecast, by Source 2019 & 2032
- Table 4: Global Protein Market in Africa Volume K Tons Forecast, by Source 2019 & 2032
- Table 5: Global Protein Market in Africa Revenue Million Forecast, by End User 2019 & 2032
- Table 6: Global Protein Market in Africa Volume K Tons Forecast, by End User 2019 & 2032
- Table 7: Global Protein Market in Africa Revenue Million Forecast, by Region 2019 & 2032
- Table 8: Global Protein Market in Africa Volume K Tons Forecast, by Region 2019 & 2032
- Table 9: Global Protein Market in Africa Revenue Million Forecast, by Country 2019 & 2032
- Table 10: Global Protein Market in Africa Volume K Tons Forecast, by Country 2019 & 2032
- Table 11: South Africa Protein Market in Africa Revenue (Million) Forecast, by Application 2019 & 2032
- Table 12: South Africa Protein Market in Africa Volume (K Tons) Forecast, by Application 2019 & 2032
- Table 13: Sudan Protein Market in Africa Revenue (Million) Forecast, by Application 2019 & 2032
- Table 14: Sudan Protein Market in Africa Volume (K Tons) Forecast, by Application 2019 & 2032
- Table 15: Uganda Protein Market in Africa Revenue (Million) Forecast, by Application 2019 & 2032
- Table 16: Uganda Protein Market in Africa Volume (K Tons) Forecast, by Application 2019 & 2032
- Table 17: Tanzania Protein Market in Africa Revenue (Million) Forecast, by Application 2019 & 2032
- Table 18: Tanzania Protein Market in Africa Volume (K Tons) Forecast, by Application 2019 & 2032
- Table 19: Kenya Protein Market in Africa Revenue (Million) Forecast, by Application 2019 & 2032
- Table 20: Kenya Protein Market in Africa Volume (K Tons) Forecast, by Application 2019 & 2032
- Table 21: Rest of Africa Protein Market in Africa Revenue (Million) Forecast, by Application 2019 & 2032
- Table 22: Rest of Africa Protein Market in Africa Volume (K Tons) Forecast, by Application 2019 & 2032
- Table 23: Global Protein Market in Africa Revenue Million Forecast, by Source 2019 & 2032
- Table 24: Global Protein Market in Africa Volume K Tons Forecast, by Source 2019 & 2032
- Table 25: Global Protein Market in Africa Revenue Million Forecast, by End User 2019 & 2032
- Table 26: Global Protein Market in Africa Volume K Tons Forecast, by End User 2019 & 2032
- Table 27: Global Protein Market in Africa Revenue Million Forecast, by Country 2019 & 2032
- Table 28: Global Protein Market in Africa Volume K Tons Forecast, by Country 2019 & 2032
- Table 29: United States Protein Market in Africa Revenue (Million) Forecast, by Application 2019 & 2032
- Table 30: United States Protein Market in Africa Volume (K Tons) Forecast, by Application 2019 & 2032
- Table 31: Canada Protein Market in Africa Revenue (Million) Forecast, by Application 2019 & 2032
- Table 32: Canada Protein Market in Africa Volume (K Tons) Forecast, by Application 2019 & 2032
- Table 33: Mexico Protein Market in Africa Revenue (Million) Forecast, by Application 2019 & 2032
- Table 34: Mexico Protein Market in Africa Volume (K Tons) Forecast, by Application 2019 & 2032
- Table 35: Global Protein Market in Africa Revenue Million Forecast, by Source 2019 & 2032
- Table 36: Global Protein Market in Africa Volume K Tons Forecast, by Source 2019 & 2032
- Table 37: Global Protein Market in Africa Revenue Million Forecast, by End User 2019 & 2032
- Table 38: Global Protein Market in Africa Volume K Tons Forecast, by End User 2019 & 2032
- Table 39: Global Protein Market in Africa Revenue Million Forecast, by Country 2019 & 2032
- Table 40: Global Protein Market in Africa Volume K Tons Forecast, by Country 2019 & 2032
- Table 41: Brazil Protein Market in Africa Revenue (Million) Forecast, by Application 2019 & 2032
- Table 42: Brazil Protein Market in Africa Volume (K Tons) Forecast, by Application 2019 & 2032
- Table 43: Argentina Protein Market in Africa Revenue (Million) Forecast, by Application 2019 & 2032
- Table 44: Argentina Protein Market in Africa Volume (K Tons) Forecast, by Application 2019 & 2032
- Table 45: Rest of South America Protein Market in Africa Revenue (Million) Forecast, by Application 2019 & 2032
- Table 46: Rest of South America Protein Market in Africa Volume (K Tons) Forecast, by Application 2019 & 2032
- Table 47: Global Protein Market in Africa Revenue Million Forecast, by Source 2019 & 2032
- Table 48: Global Protein Market in Africa Volume K Tons Forecast, by Source 2019 & 2032
- Table 49: Global Protein Market in Africa Revenue Million Forecast, by End User 2019 & 2032
- Table 50: Global Protein Market in Africa Volume K Tons Forecast, by End User 2019 & 2032
- Table 51: Global Protein Market in Africa Revenue Million Forecast, by Country 2019 & 2032
- Table 52: Global Protein Market in Africa Volume K Tons Forecast, by Country 2019 & 2032
- Table 53: United Kingdom Protein Market in Africa Revenue (Million) Forecast, by Application 2019 & 2032
- Table 54: United Kingdom Protein Market in Africa Volume (K Tons) Forecast, by Application 2019 & 2032
- Table 55: Germany Protein Market in Africa Revenue (Million) Forecast, by Application 2019 & 2032
- Table 56: Germany Protein Market in Africa Volume (K Tons) Forecast, by Application 2019 & 2032
- Table 57: France Protein Market in Africa Revenue (Million) Forecast, by Application 2019 & 2032
- Table 58: France Protein Market in Africa Volume (K Tons) Forecast, by Application 2019 & 2032
- Table 59: Italy Protein Market in Africa Revenue (Million) Forecast, by Application 2019 & 2032
- Table 60: Italy Protein Market in Africa Volume (K Tons) Forecast, by Application 2019 & 2032
- Table 61: Spain Protein Market in Africa Revenue (Million) Forecast, by Application 2019 & 2032
- Table 62: Spain Protein Market in Africa Volume (K Tons) Forecast, by Application 2019 & 2032
- Table 63: Russia Protein Market in Africa Revenue (Million) Forecast, by Application 2019 & 2032
- Table 64: Russia Protein Market in Africa Volume (K Tons) Forecast, by Application 2019 & 2032
- Table 65: Benelux Protein Market in Africa Revenue (Million) Forecast, by Application 2019 & 2032
- Table 66: Benelux Protein Market in Africa Volume (K Tons) Forecast, by Application 2019 & 2032
- Table 67: Nordics Protein Market in Africa Revenue (Million) Forecast, by Application 2019 & 2032
- Table 68: Nordics Protein Market in Africa Volume (K Tons) Forecast, by Application 2019 & 2032
- Table 69: Rest of Europe Protein Market in Africa Revenue (Million) Forecast, by Application 2019 & 2032
- Table 70: Rest of Europe Protein Market in Africa Volume (K Tons) Forecast, by Application 2019 & 2032
- Table 71: Global Protein Market in Africa Revenue Million Forecast, by Source 2019 & 2032
- Table 72: Global Protein Market in Africa Volume K Tons Forecast, by Source 2019 & 2032
- Table 73: Global Protein Market in Africa Revenue Million Forecast, by End User 2019 & 2032
- Table 74: Global Protein Market in Africa Volume K Tons Forecast, by End User 2019 & 2032
- Table 75: Global Protein Market in Africa Revenue Million Forecast, by Country 2019 & 2032
- Table 76: Global Protein Market in Africa Volume K Tons Forecast, by Country 2019 & 2032
- Table 77: Turkey Protein Market in Africa Revenue (Million) Forecast, by Application 2019 & 2032
- Table 78: Turkey Protein Market in Africa Volume (K Tons) Forecast, by Application 2019 & 2032
- Table 79: Israel Protein Market in Africa Revenue (Million) Forecast, by Application 2019 & 2032
- Table 80: Israel Protein Market in Africa Volume (K Tons) Forecast, by Application 2019 & 2032
- Table 81: GCC Protein Market in Africa Revenue (Million) Forecast, by Application 2019 & 2032
- Table 82: GCC Protein Market in Africa Volume (K Tons) Forecast, by Application 2019 & 2032
- Table 83: North Africa Protein Market in Africa Revenue (Million) Forecast, by Application 2019 & 2032
- Table 84: North Africa Protein Market in Africa Volume (K Tons) Forecast, by Application 2019 & 2032
- Table 85: South Africa Protein Market in Africa Revenue (Million) Forecast, by Application 2019 & 2032
- Table 86: South Africa Protein Market in Africa Volume (K Tons) Forecast, by Application 2019 & 2032
- Table 87: Rest of Middle East & Africa Protein Market in Africa Revenue (Million) Forecast, by Application 2019 & 2032
- Table 88: Rest of Middle East & Africa Protein Market in Africa Volume (K Tons) Forecast, by Application 2019 & 2032
- Table 89: Global Protein Market in Africa Revenue Million Forecast, by Source 2019 & 2032
- Table 90: Global Protein Market in Africa Volume K Tons Forecast, by Source 2019 & 2032
- Table 91: Global Protein Market in Africa Revenue Million Forecast, by End User 2019 & 2032
- Table 92: Global Protein Market in Africa Volume K Tons Forecast, by End User 2019 & 2032
- Table 93: Global Protein Market in Africa Revenue Million Forecast, by Country 2019 & 2032
- Table 94: Global Protein Market in Africa Volume K Tons Forecast, by Country 2019 & 2032
- Table 95: China Protein Market in Africa Revenue (Million) Forecast, by Application 2019 & 2032
- Table 96: China Protein Market in Africa Volume (K Tons) Forecast, by Application 2019 & 2032
- Table 97: India Protein Market in Africa Revenue (Million) Forecast, by Application 2019 & 2032
- Table 98: India Protein Market in Africa Volume (K Tons) Forecast, by Application 2019 & 2032
- Table 99: Japan Protein Market in Africa Revenue (Million) Forecast, by Application 2019 & 2032
- Table 100: Japan Protein Market in Africa Volume (K Tons) Forecast, by Application 2019 & 2032
- Table 101: South Korea Protein Market in Africa Revenue (Million) Forecast, by Application 2019 & 2032
- Table 102: South Korea Protein Market in Africa Volume (K Tons) Forecast, by Application 2019 & 2032
- Table 103: ASEAN Protein Market in Africa Revenue (Million) Forecast, by Application 2019 & 2032
- Table 104: ASEAN Protein Market in Africa Volume (K Tons) Forecast, by Application 2019 & 2032
- Table 105: Oceania Protein Market in Africa Revenue (Million) Forecast, by Application 2019 & 2032
- Table 106: Oceania Protein Market in Africa Volume (K Tons) Forecast, by Application 2019 & 2032
- Table 107: Rest of Asia Pacific Protein Market in Africa Revenue (Million) Forecast, by Application 2019 & 2032
- Table 108: Rest of Asia Pacific Protein Market in Africa Volume (K Tons) Forecast, by Application 2019 & 2032
Frequently Asked Questions
1. What is the projected Compound Annual Growth Rate (CAGR) of the Protein Market in Africa?
The projected CAGR is approximately 3.50%.
2. Which companies are prominent players in the Protein Market in Africa?
Key companies in the market include Prolacta, Cargill Incorporated, International Flavors & Fragrances Inc, Lactoprot Deutschland GmbH, Amesi Group, Fonterra Co-operative Group Limited, Hilmar Cheese Company Inc, Kerry Group plc, Tiger Brands Limited , RCL Foods Limited.
3. What are the main segments of the Protein Market in Africa?
The market segments include Source, End User.
4. Can you provide details about the market size?
The market size is estimated to be USD 2029.99 Million as of 2022.
5. What are some drivers contributing to market growth?
Increasing Demand For Convenience & Processed Food.
6. What are the notable trends driving market growth?
OTHER KEY INDUSTRY TRENDS COVERED IN THE REPORT.
7. Are there any restraints impacting market growth?
Increased Consumer Awareness On Side-Effects Of Chemical Additives.
8. Can you provide examples of recent developments in the market?
February 2021: DuPont's Nutrition & Biosciences and the ingredient company IFF announced their merger in 2021. The combined company will continue to operate under the name IFF. The complementary portfolios give the company leadership positions within a range of ingredients, including soy protein.June 2020: Kerry Group expanded its range of plant protein ingredients. The range includes organic, vegan, and allergen-free products that are widely used in various food and beverage applications. In total, 13 new plant protein ingredients have been developed for the ProDiem and Hypro ranges.April 2018: Kerry Group acquired Dutch plant-based protein manufacturer Ojah BV. With this acquisition, Kerry Group added Plenti as a soy-protein brand to its product portfolio.
9. What pricing options are available for accessing the report?
Pricing options include single-user, multi-user, and enterprise licenses priced at USD 3800, USD 4500, and USD 5800 respectively.
10. Is the market size provided in terms of value or volume?
The market size is provided in terms of value, measured in Million and volume, measured in K Tons.
11. Are there any specific market keywords associated with the report?
Yes, the market keyword associated with the report is "Protein Market in Africa," which aids in identifying and referencing the specific market segment covered.
12. How do I determine which pricing option suits my needs best?
The pricing options vary based on user requirements and access needs. Individual users may opt for single-user licenses, while businesses requiring broader access may choose multi-user or enterprise licenses for cost-effective access to the report.
13. Are there any additional resources or data provided in the Protein Market in Africa report?
While the report offers comprehensive insights, it's advisable to review the specific contents or supplementary materials provided to ascertain if additional resources or data are available.
14. How can I stay updated on further developments or reports in the Protein Market in Africa?
To stay informed about further developments, trends, and reports in the Protein Market in Africa, consider subscribing to industry newsletters, following relevant companies and organizations, or regularly checking reputable industry news sources and publications.
Methodology
Step 1 - Identification of Relevant Samples Size from Population Database


Step 2 - Approaches for Defining Global Market Size (Value, Volume* & Price*)

Note*: In applicable scenarios
Step 3 - Data Sources
Primary Research
- Web Analytics
- Survey Reports
- Research Institute
- Latest Research Reports
- Opinion Leaders
Secondary Research
- Annual Reports
- White Paper
- Latest Press Release
- Industry Association
- Paid Database
- Investor Presentations

Step 4 - Data Triangulation
Involves using different sources of information in order to increase the validity of a study
These sources are likely to be stakeholders in a program - participants, other researchers, program staff, other community members, and so on.
Then we put all data in single framework & apply various statistical tools to find out the dynamic on the market.
During the analysis stage, feedback from the stakeholder groups would be compared to determine areas of agreement as well as areas of divergence


