
Key Insights
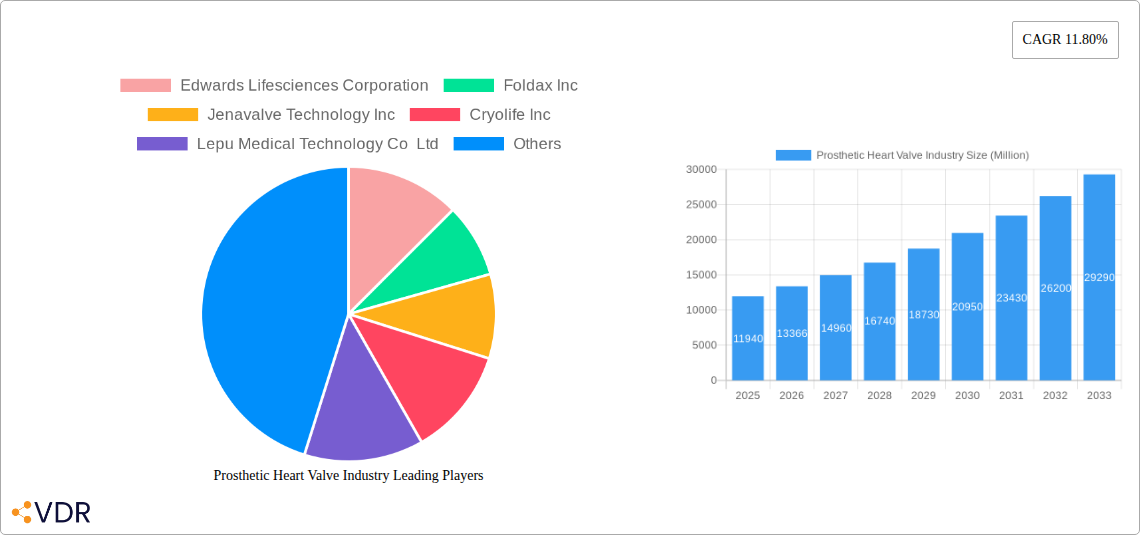
The global prosthetic heart valve market, valued at $11.94 billion in 2025, is projected to experience robust growth, driven by an aging population, increasing prevalence of cardiovascular diseases, and advancements in minimally invasive surgical techniques. The compound annual growth rate (CAGR) of 11.80% from 2025 to 2033 signifies substantial market expansion. Key market segments include mechanical, bioprosthetic, and transcatheter heart valves, catering to mitral, aortic, and other valve positions. Technological advancements, such as the development of less-invasive transcatheter valves, are significantly impacting market growth, offering patients reduced recovery times and improved outcomes. Furthermore, the rising adoption of these minimally invasive procedures in developing economies is expected to fuel market expansion. The competitive landscape features established players like Edwards Lifesciences, Medtronic, and Abbott Laboratories, alongside emerging companies introducing innovative valve designs and delivery systems. Regional variations in market growth are anticipated, with North America and Europe expected to retain significant market share due to advanced healthcare infrastructure and high prevalence of cardiovascular diseases. However, the Asia-Pacific region is poised for substantial growth, driven by increasing healthcare spending and rising awareness about cardiovascular health.
The market's growth is, however, subject to certain restraints. High cost of procedures, potential complications associated with valve implantation, and stringent regulatory approvals pose challenges. Despite these limitations, the continuous development of improved valve designs with enhanced durability and biocompatibility, alongside the growing adoption of advanced imaging techniques for accurate diagnosis and precise placement, are likely to overcome these challenges. The focus on improving patient outcomes and reducing the overall cost of treatment through technological advancements and strategic partnerships will be crucial for sustained market growth in the forecast period. The market's future hinges on continued research and development, leading to safer and more effective prosthetic heart valve technologies.
Prosthetic Heart Valve Industry: A Comprehensive Market Report (2019-2033)
This comprehensive report provides an in-depth analysis of the prosthetic heart valve industry, encompassing market dynamics, growth trends, regional segmentation, product landscape, key players, and future outlook. The report covers the period from 2019 to 2033, with a focus on the estimated year 2025. The global market size is projected to reach xx Million units by 2033. This detailed analysis is invaluable for industry professionals, investors, and strategic decision-makers seeking a clear understanding of this vital medical device sector.
Prosthetic Heart Valve Industry Market Dynamics & Structure
This section analyzes the competitive landscape, technological advancements, regulatory influences, and market trends within the prosthetic heart valve industry. The market is characterized by a moderately concentrated structure with key players like Edwards Lifesciences holding significant market share. However, emerging companies and innovative technologies are continuously shaping the competitive dynamics.
Market Concentration & Competitive Landscape:
- High market concentration with a few dominant players.
- Increased competition from emerging companies with innovative technologies.
- Strategic partnerships and mergers & acquisitions (M&A) significantly influence market share. The number of M&A deals in the period 2019-2024 was estimated to be xx.
- Market share of top 5 players in 2024: xx%.
Technological Innovation:
- Continuous development of minimally invasive transcatheter procedures.
- Advancements in biomaterial science leading to improved valve durability and longevity.
- Growing adoption of personalized medicine and patient-specific valve designs.
- Innovation barriers include high regulatory hurdles and extensive clinical trials.
Regulatory Frameworks:
- Stringent regulatory approvals (e.g., FDA) significantly impact product launch timelines.
- Varying regulatory landscapes across different geographies.
- Emphasis on post-market surveillance and data collection.
Competitive Product Substitutes & End-User Demographics:
- Limited direct substitutes, primarily existing surgical approaches.
- Aging population and rising prevalence of cardiovascular diseases are key drivers of market growth.
- The end-user demographic is primarily the elderly population (65+), with an increasing number of younger patients.
Prosthetic Heart Valve Industry Growth Trends & Insights
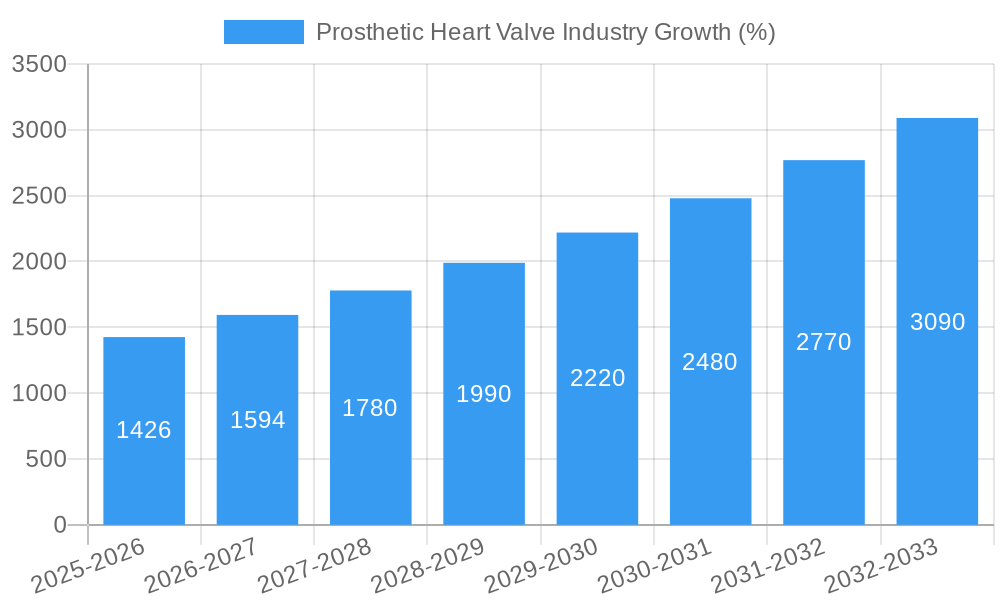
The prosthetic heart valve market has experienced substantial growth over the past few years, driven by an aging global population, increasing prevalence of cardiovascular diseases, and technological advancements in minimally invasive procedures. The market size has shown consistent growth from xx Million units in 2019 to xx Million units in 2024. The Compound Annual Growth Rate (CAGR) during the historical period (2019-2024) is estimated to be xx%, while the projected CAGR during the forecast period (2025-2033) is estimated to be xx%. This growth is fueled by factors such as the increasing adoption of transcatheter aortic valve replacement (TAVR) procedures and the development of innovative bioprosthetic valves with enhanced durability. Market penetration of TAVR procedures is steadily increasing, with xx% penetration in developed markets in 2024, expected to rise to xx% by 2033.
Dominant Regions, Countries, or Segments in Prosthetic Heart Valve Industry
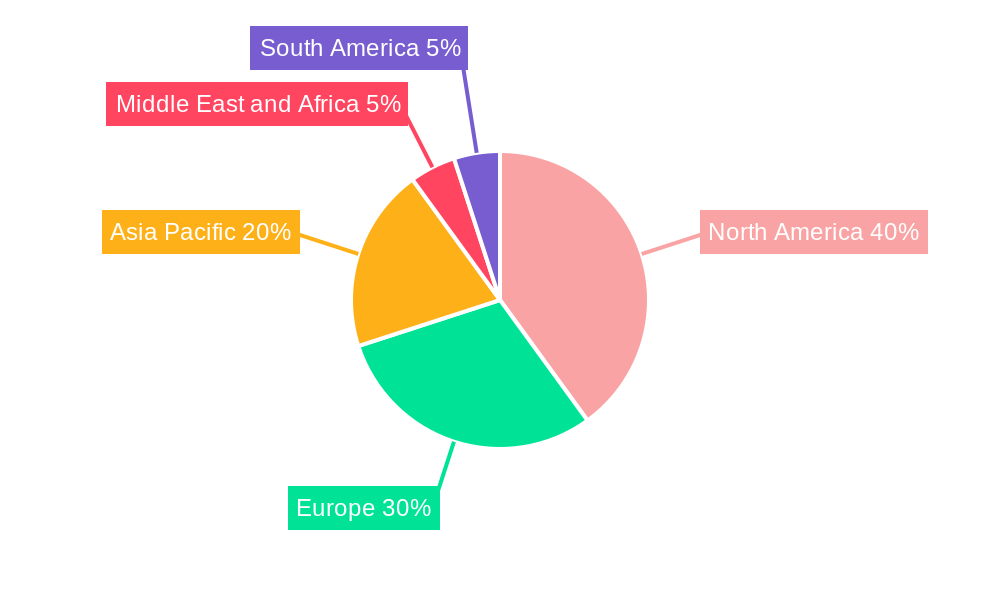
North America currently dominates the prosthetic heart valve market, followed by Europe and Asia-Pacific. This dominance is attributable to higher healthcare spending, advanced healthcare infrastructure, and a larger patient pool in these regions. However, emerging economies in Asia-Pacific show significant growth potential due to rising healthcare expenditure and increasing awareness of cardiovascular diseases.
Leading Segments:
- Transcatheter Heart Valve (TAVR): Fastest-growing segment driven by minimally invasive procedures, reduced recovery time, and improved patient outcomes. Market share is expected to increase to xx% by 2033.
- Aortic Valve: The largest segment due to the higher prevalence of aortic stenosis compared to mitral valve disease. Market share in 2024: xx%.
- Bioprosthetic Heart Valve: Higher market share compared to mechanical valves due to the absence of lifelong anticoagulation requirements. Market share in 2024: xx%
Key Drivers:
- High prevalence of cardiovascular diseases.
- Technological advancements leading to improved valve designs.
- Increasing adoption of minimally invasive procedures (TAVR).
- Favorable regulatory environment.
- Rising healthcare expenditure.
Prosthetic Heart Valve Industry Product Landscape
The prosthetic heart valve market offers a diverse range of products, including mechanical and bioprosthetic valves, designed for various positions within the heart (aortic, mitral, etc.). Recent innovations have focused on improving valve durability, reducing thrombogenicity (blood clot formation), and enhancing patient outcomes. Transcatheter valves are gaining prominence due to their minimally invasive nature. Unique selling propositions include improved hemodynamics, reduced trauma, and shorter recovery times. Technological advancements incorporate advanced biomaterials and innovative designs to minimize complications and improve longevity.
Key Drivers, Barriers & Challenges in Prosthetic Heart Valve Industry
Key Drivers:
- Aging global population and rising prevalence of cardiovascular diseases.
- Technological advancements leading to less invasive procedures.
- Government initiatives supporting healthcare infrastructure development.
Key Barriers & Challenges:
- High cost of procedures limiting access in developing countries.
- Stringent regulatory pathways for approval and market entry.
- Potential for complications and adverse events, leading to higher healthcare costs.
- Competition from established players with strong market presence.
Emerging Opportunities in Prosthetic Heart Valve Industry
- Expansion into untapped markets in developing countries.
- Development of patient-specific valves with improved biocompatibility.
- Integration of smart technology and data analytics for remote patient monitoring.
- Focus on reducing the cost of procedures to enhance accessibility.
Growth Accelerators in the Prosthetic Heart Valve Industry
Technological breakthroughs in biomaterials and minimally invasive procedures will be significant growth catalysts. Strategic partnerships between device manufacturers and healthcare providers can improve accessibility and patient outcomes. Expansion into emerging markets through strategic alliances will unlock substantial growth potential.
Key Players Shaping the Prosthetic Heart Valve Industry Market
- Edwards Lifesciences Corporation
- Foldax Inc
- Jenavalve Technology Inc
- Cryolife Inc
- Lepu Medical Technology Co Ltd
- Medtronic PLC
- Abbott Laboratories (St Jude Medical Inc)
- Symetis SA
- Colibri Heart Valve LLC
- Boston Scientific Corporation
- TTK Healthcare Limited
Notable Milestones in Prosthetic Heart Valve Industry Sector
- March 2022: Edwards Lifesciences received FDA approval for the MITRIS RESILIA valve, a tissue valve replacement for the mitral position. This significantly expands treatment options for mitral valve disease.
- January 2022: JenaValve Technology, Inc. secured an exclusive technology licensing agreement with Peijia Medical Limited for its Trilogy TAVR systems in Greater China. This strategic move expands JenaValve's market reach in a significant region.
In-Depth Prosthetic Heart Valve Industry Market Outlook
The prosthetic heart valve market exhibits strong growth potential driven by technological advancements and the increasing prevalence of cardiovascular diseases. Strategic partnerships, technological innovation, and expansion into emerging markets will be crucial for sustained growth. The market is poised for continued expansion, with opportunities for new entrants and established players alike. The future will see an increasing focus on personalized medicine, improved biomaterials, and minimally invasive procedures.
Prosthetic Heart Valve Industry Segmentation
-
1. Type of Valve
- 1.1. Mechanical Heart Valve
- 1.2. Bioprosthetic Heart Valve
- 1.3. Transcatheter Heart Valve
-
2. Position
- 2.1. Mitral Valve
- 2.2. Aortic Valve
- 2.3. Other Positions
Prosthetic Heart Valve Industry Segmentation By Geography
-
1. North America
- 1.1. United States
- 1.2. Canada
- 1.3. Mexico
-
2. Europe
- 2.1. Germany
- 2.2. United Kingdom
- 2.3. France
- 2.4. Italy
- 2.5. Spain
- 2.6. Rest of Europe
-
3. Asia Pacific
- 3.1. China
- 3.2. Japan
- 3.3. India
- 3.4. Australia
- 3.5. South Korea
- 3.6. Rest of Asia Pacific
-
4. Middle East and Africa
- 4.1. GCC
- 4.2. South Africa
- 4.3. Rest of Middle East and Africa
-
5. South America
- 5.1. Brazil
- 5.2. Argentina
- 5.3. Rest of South America
Prosthetic Heart Valve Industry REPORT HIGHLIGHTS
| Aspects | Details |
|---|---|
| Study Period | 2019-2033 |
| Base Year | 2024 |
| Estimated Year | 2025 |
| Forecast Period | 2025-2033 |
| Historical Period | 2019-2024 |
| Growth Rate | CAGR of 11.80% from 2019-2033 |
| Segmentation |
|
Table of Contents
- 1. Introduction
- 1.1. Research Scope
- 1.2. Market Segmentation
- 1.3. Research Methodology
- 1.4. Definitions and Assumptions
- 2. Executive Summary
- 2.1. Introduction
- 3. Market Dynamics
- 3.1. Introduction
- 3.2. Market Drivers
- 3.2.1. Increasing Prevalence of Heart Valve Disease; Rising Regulatory Approvals for New and Advanced Prosthetic Heart Valve
- 3.3. Market Restrains
- 3.3.1. High Cost of Transcatheter Aortic Valve Replacement (TAVR) Procedures; Availability of Alternative Methods for Treating Heart Valve Diseases (HVD)
- 3.4. Market Trends
- 3.4.1. Transcatheter Heart Valve Segment is Expected to Register Robust Growth During the Forecast Period
- 4. Market Factor Analysis
- 4.1. Porters Five Forces
- 4.2. Supply/Value Chain
- 4.3. PESTEL analysis
- 4.4. Market Entropy
- 4.5. Patent/Trademark Analysis
- 5. Global Prosthetic Heart Valve Industry Analysis, Insights and Forecast, 2019-2031
- 5.1. Market Analysis, Insights and Forecast - by Type of Valve
- 5.1.1. Mechanical Heart Valve
- 5.1.2. Bioprosthetic Heart Valve
- 5.1.3. Transcatheter Heart Valve
- 5.2. Market Analysis, Insights and Forecast - by Position
- 5.2.1. Mitral Valve
- 5.2.2. Aortic Valve
- 5.2.3. Other Positions
- 5.3. Market Analysis, Insights and Forecast - by Region
- 5.3.1. North America
- 5.3.2. Europe
- 5.3.3. Asia Pacific
- 5.3.4. Middle East and Africa
- 5.3.5. South America
- 5.1. Market Analysis, Insights and Forecast - by Type of Valve
- 6. North America Prosthetic Heart Valve Industry Analysis, Insights and Forecast, 2019-2031
- 6.1. Market Analysis, Insights and Forecast - by Type of Valve
- 6.1.1. Mechanical Heart Valve
- 6.1.2. Bioprosthetic Heart Valve
- 6.1.3. Transcatheter Heart Valve
- 6.2. Market Analysis, Insights and Forecast - by Position
- 6.2.1. Mitral Valve
- 6.2.2. Aortic Valve
- 6.2.3. Other Positions
- 6.1. Market Analysis, Insights and Forecast - by Type of Valve
- 7. Europe Prosthetic Heart Valve Industry Analysis, Insights and Forecast, 2019-2031
- 7.1. Market Analysis, Insights and Forecast - by Type of Valve
- 7.1.1. Mechanical Heart Valve
- 7.1.2. Bioprosthetic Heart Valve
- 7.1.3. Transcatheter Heart Valve
- 7.2. Market Analysis, Insights and Forecast - by Position
- 7.2.1. Mitral Valve
- 7.2.2. Aortic Valve
- 7.2.3. Other Positions
- 7.1. Market Analysis, Insights and Forecast - by Type of Valve
- 8. Asia Pacific Prosthetic Heart Valve Industry Analysis, Insights and Forecast, 2019-2031
- 8.1. Market Analysis, Insights and Forecast - by Type of Valve
- 8.1.1. Mechanical Heart Valve
- 8.1.2. Bioprosthetic Heart Valve
- 8.1.3. Transcatheter Heart Valve
- 8.2. Market Analysis, Insights and Forecast - by Position
- 8.2.1. Mitral Valve
- 8.2.2. Aortic Valve
- 8.2.3. Other Positions
- 8.1. Market Analysis, Insights and Forecast - by Type of Valve
- 9. Middle East and Africa Prosthetic Heart Valve Industry Analysis, Insights and Forecast, 2019-2031
- 9.1. Market Analysis, Insights and Forecast - by Type of Valve
- 9.1.1. Mechanical Heart Valve
- 9.1.2. Bioprosthetic Heart Valve
- 9.1.3. Transcatheter Heart Valve
- 9.2. Market Analysis, Insights and Forecast - by Position
- 9.2.1. Mitral Valve
- 9.2.2. Aortic Valve
- 9.2.3. Other Positions
- 9.1. Market Analysis, Insights and Forecast - by Type of Valve
- 10. South America Prosthetic Heart Valve Industry Analysis, Insights and Forecast, 2019-2031
- 10.1. Market Analysis, Insights and Forecast - by Type of Valve
- 10.1.1. Mechanical Heart Valve
- 10.1.2. Bioprosthetic Heart Valve
- 10.1.3. Transcatheter Heart Valve
- 10.2. Market Analysis, Insights and Forecast - by Position
- 10.2.1. Mitral Valve
- 10.2.2. Aortic Valve
- 10.2.3. Other Positions
- 10.1. Market Analysis, Insights and Forecast - by Type of Valve
- 11. North America Prosthetic Heart Valve Industry Analysis, Insights and Forecast, 2019-2031
- 11.1. Market Analysis, Insights and Forecast - By Country/Sub-region
- 11.1.1. undefined
- 12. Europe Prosthetic Heart Valve Industry Analysis, Insights and Forecast, 2019-2031
- 12.1. Market Analysis, Insights and Forecast - By Country/Sub-region
- 12.1.1. undefined
- 13. Asia Pacific Prosthetic Heart Valve Industry Analysis, Insights and Forecast, 2019-2031
- 13.1. Market Analysis, Insights and Forecast - By Country/Sub-region
- 13.1.1. undefined
- 14. Middle East and Africa Prosthetic Heart Valve Industry Analysis, Insights and Forecast, 2019-2031
- 14.1. Market Analysis, Insights and Forecast - By Country/Sub-region
- 14.1.1. undefined
- 15. South America Prosthetic Heart Valve Industry Analysis, Insights and Forecast, 2019-2031
- 15.1. Market Analysis, Insights and Forecast - By Country/Sub-region
- 15.1.1. undefined
- 16. Competitive Analysis
- 16.1. Global Market Share Analysis 2024
- 16.2. Company Profiles
- 16.2.1 Edwards Lifesciences Corporation
- 16.2.1.1. Overview
- 16.2.1.2. Products
- 16.2.1.3. SWOT Analysis
- 16.2.1.4. Recent Developments
- 16.2.1.5. Financials (Based on Availability)
- 16.2.2 Foldax Inc
- 16.2.2.1. Overview
- 16.2.2.2. Products
- 16.2.2.3. SWOT Analysis
- 16.2.2.4. Recent Developments
- 16.2.2.5. Financials (Based on Availability)
- 16.2.3 Jenavalve Technology Inc
- 16.2.3.1. Overview
- 16.2.3.2. Products
- 16.2.3.3. SWOT Analysis
- 16.2.3.4. Recent Developments
- 16.2.3.5. Financials (Based on Availability)
- 16.2.4 Cryolife Inc
- 16.2.4.1. Overview
- 16.2.4.2. Products
- 16.2.4.3. SWOT Analysis
- 16.2.4.4. Recent Developments
- 16.2.4.5. Financials (Based on Availability)
- 16.2.5 Lepu Medical Technology Co Ltd
- 16.2.5.1. Overview
- 16.2.5.2. Products
- 16.2.5.3. SWOT Analysis
- 16.2.5.4. Recent Developments
- 16.2.5.5. Financials (Based on Availability)
- 16.2.6 Medtronic PLC
- 16.2.6.1. Overview
- 16.2.6.2. Products
- 16.2.6.3. SWOT Analysis
- 16.2.6.4. Recent Developments
- 16.2.6.5. Financials (Based on Availability)
- 16.2.7 Abbott Laboratories (St Jude Medical Inc )
- 16.2.7.1. Overview
- 16.2.7.2. Products
- 16.2.7.3. SWOT Analysis
- 16.2.7.4. Recent Developments
- 16.2.7.5. Financials (Based on Availability)
- 16.2.8 Symetis SA
- 16.2.8.1. Overview
- 16.2.8.2. Products
- 16.2.8.3. SWOT Analysis
- 16.2.8.4. Recent Developments
- 16.2.8.5. Financials (Based on Availability)
- 16.2.9 Colibri Heart Valve LLC
- 16.2.9.1. Overview
- 16.2.9.2. Products
- 16.2.9.3. SWOT Analysis
- 16.2.9.4. Recent Developments
- 16.2.9.5. Financials (Based on Availability)
- 16.2.10 Boston Scientific Corporation
- 16.2.10.1. Overview
- 16.2.10.2. Products
- 16.2.10.3. SWOT Analysis
- 16.2.10.4. Recent Developments
- 16.2.10.5. Financials (Based on Availability)
- 16.2.11 TTK Healthcare Limited
- 16.2.11.1. Overview
- 16.2.11.2. Products
- 16.2.11.3. SWOT Analysis
- 16.2.11.4. Recent Developments
- 16.2.11.5. Financials (Based on Availability)
- 16.2.1 Edwards Lifesciences Corporation
List of Figures
- Figure 1: Global Prosthetic Heart Valve Industry Revenue Breakdown (Million, %) by Region 2024 & 2032
- Figure 2: Global Prosthetic Heart Valve Industry Volume Breakdown (K Unit, %) by Region 2024 & 2032
- Figure 3: North America Prosthetic Heart Valve Industry Revenue (Million), by Country 2024 & 2032
- Figure 4: North America Prosthetic Heart Valve Industry Volume (K Unit), by Country 2024 & 2032
- Figure 5: North America Prosthetic Heart Valve Industry Revenue Share (%), by Country 2024 & 2032
- Figure 6: North America Prosthetic Heart Valve Industry Volume Share (%), by Country 2024 & 2032
- Figure 7: Europe Prosthetic Heart Valve Industry Revenue (Million), by Country 2024 & 2032
- Figure 8: Europe Prosthetic Heart Valve Industry Volume (K Unit), by Country 2024 & 2032
- Figure 9: Europe Prosthetic Heart Valve Industry Revenue Share (%), by Country 2024 & 2032
- Figure 10: Europe Prosthetic Heart Valve Industry Volume Share (%), by Country 2024 & 2032
- Figure 11: Asia Pacific Prosthetic Heart Valve Industry Revenue (Million), by Country 2024 & 2032
- Figure 12: Asia Pacific Prosthetic Heart Valve Industry Volume (K Unit), by Country 2024 & 2032
- Figure 13: Asia Pacific Prosthetic Heart Valve Industry Revenue Share (%), by Country 2024 & 2032
- Figure 14: Asia Pacific Prosthetic Heart Valve Industry Volume Share (%), by Country 2024 & 2032
- Figure 15: Middle East and Africa Prosthetic Heart Valve Industry Revenue (Million), by Country 2024 & 2032
- Figure 16: Middle East and Africa Prosthetic Heart Valve Industry Volume (K Unit), by Country 2024 & 2032
- Figure 17: Middle East and Africa Prosthetic Heart Valve Industry Revenue Share (%), by Country 2024 & 2032
- Figure 18: Middle East and Africa Prosthetic Heart Valve Industry Volume Share (%), by Country 2024 & 2032
- Figure 19: South America Prosthetic Heart Valve Industry Revenue (Million), by Country 2024 & 2032
- Figure 20: South America Prosthetic Heart Valve Industry Volume (K Unit), by Country 2024 & 2032
- Figure 21: South America Prosthetic Heart Valve Industry Revenue Share (%), by Country 2024 & 2032
- Figure 22: South America Prosthetic Heart Valve Industry Volume Share (%), by Country 2024 & 2032
- Figure 23: North America Prosthetic Heart Valve Industry Revenue (Million), by Type of Valve 2024 & 2032
- Figure 24: North America Prosthetic Heart Valve Industry Volume (K Unit), by Type of Valve 2024 & 2032
- Figure 25: North America Prosthetic Heart Valve Industry Revenue Share (%), by Type of Valve 2024 & 2032
- Figure 26: North America Prosthetic Heart Valve Industry Volume Share (%), by Type of Valve 2024 & 2032
- Figure 27: North America Prosthetic Heart Valve Industry Revenue (Million), by Position 2024 & 2032
- Figure 28: North America Prosthetic Heart Valve Industry Volume (K Unit), by Position 2024 & 2032
- Figure 29: North America Prosthetic Heart Valve Industry Revenue Share (%), by Position 2024 & 2032
- Figure 30: North America Prosthetic Heart Valve Industry Volume Share (%), by Position 2024 & 2032
- Figure 31: North America Prosthetic Heart Valve Industry Revenue (Million), by Country 2024 & 2032
- Figure 32: North America Prosthetic Heart Valve Industry Volume (K Unit), by Country 2024 & 2032
- Figure 33: North America Prosthetic Heart Valve Industry Revenue Share (%), by Country 2024 & 2032
- Figure 34: North America Prosthetic Heart Valve Industry Volume Share (%), by Country 2024 & 2032
- Figure 35: Europe Prosthetic Heart Valve Industry Revenue (Million), by Type of Valve 2024 & 2032
- Figure 36: Europe Prosthetic Heart Valve Industry Volume (K Unit), by Type of Valve 2024 & 2032
- Figure 37: Europe Prosthetic Heart Valve Industry Revenue Share (%), by Type of Valve 2024 & 2032
- Figure 38: Europe Prosthetic Heart Valve Industry Volume Share (%), by Type of Valve 2024 & 2032
- Figure 39: Europe Prosthetic Heart Valve Industry Revenue (Million), by Position 2024 & 2032
- Figure 40: Europe Prosthetic Heart Valve Industry Volume (K Unit), by Position 2024 & 2032
- Figure 41: Europe Prosthetic Heart Valve Industry Revenue Share (%), by Position 2024 & 2032
- Figure 42: Europe Prosthetic Heart Valve Industry Volume Share (%), by Position 2024 & 2032
- Figure 43: Europe Prosthetic Heart Valve Industry Revenue (Million), by Country 2024 & 2032
- Figure 44: Europe Prosthetic Heart Valve Industry Volume (K Unit), by Country 2024 & 2032
- Figure 45: Europe Prosthetic Heart Valve Industry Revenue Share (%), by Country 2024 & 2032
- Figure 46: Europe Prosthetic Heart Valve Industry Volume Share (%), by Country 2024 & 2032
- Figure 47: Asia Pacific Prosthetic Heart Valve Industry Revenue (Million), by Type of Valve 2024 & 2032
- Figure 48: Asia Pacific Prosthetic Heart Valve Industry Volume (K Unit), by Type of Valve 2024 & 2032
- Figure 49: Asia Pacific Prosthetic Heart Valve Industry Revenue Share (%), by Type of Valve 2024 & 2032
- Figure 50: Asia Pacific Prosthetic Heart Valve Industry Volume Share (%), by Type of Valve 2024 & 2032
- Figure 51: Asia Pacific Prosthetic Heart Valve Industry Revenue (Million), by Position 2024 & 2032
- Figure 52: Asia Pacific Prosthetic Heart Valve Industry Volume (K Unit), by Position 2024 & 2032
- Figure 53: Asia Pacific Prosthetic Heart Valve Industry Revenue Share (%), by Position 2024 & 2032
- Figure 54: Asia Pacific Prosthetic Heart Valve Industry Volume Share (%), by Position 2024 & 2032
- Figure 55: Asia Pacific Prosthetic Heart Valve Industry Revenue (Million), by Country 2024 & 2032
- Figure 56: Asia Pacific Prosthetic Heart Valve Industry Volume (K Unit), by Country 2024 & 2032
- Figure 57: Asia Pacific Prosthetic Heart Valve Industry Revenue Share (%), by Country 2024 & 2032
- Figure 58: Asia Pacific Prosthetic Heart Valve Industry Volume Share (%), by Country 2024 & 2032
- Figure 59: Middle East and Africa Prosthetic Heart Valve Industry Revenue (Million), by Type of Valve 2024 & 2032
- Figure 60: Middle East and Africa Prosthetic Heart Valve Industry Volume (K Unit), by Type of Valve 2024 & 2032
- Figure 61: Middle East and Africa Prosthetic Heart Valve Industry Revenue Share (%), by Type of Valve 2024 & 2032
- Figure 62: Middle East and Africa Prosthetic Heart Valve Industry Volume Share (%), by Type of Valve 2024 & 2032
- Figure 63: Middle East and Africa Prosthetic Heart Valve Industry Revenue (Million), by Position 2024 & 2032
- Figure 64: Middle East and Africa Prosthetic Heart Valve Industry Volume (K Unit), by Position 2024 & 2032
- Figure 65: Middle East and Africa Prosthetic Heart Valve Industry Revenue Share (%), by Position 2024 & 2032
- Figure 66: Middle East and Africa Prosthetic Heart Valve Industry Volume Share (%), by Position 2024 & 2032
- Figure 67: Middle East and Africa Prosthetic Heart Valve Industry Revenue (Million), by Country 2024 & 2032
- Figure 68: Middle East and Africa Prosthetic Heart Valve Industry Volume (K Unit), by Country 2024 & 2032
- Figure 69: Middle East and Africa Prosthetic Heart Valve Industry Revenue Share (%), by Country 2024 & 2032
- Figure 70: Middle East and Africa Prosthetic Heart Valve Industry Volume Share (%), by Country 2024 & 2032
- Figure 71: South America Prosthetic Heart Valve Industry Revenue (Million), by Type of Valve 2024 & 2032
- Figure 72: South America Prosthetic Heart Valve Industry Volume (K Unit), by Type of Valve 2024 & 2032
- Figure 73: South America Prosthetic Heart Valve Industry Revenue Share (%), by Type of Valve 2024 & 2032
- Figure 74: South America Prosthetic Heart Valve Industry Volume Share (%), by Type of Valve 2024 & 2032
- Figure 75: South America Prosthetic Heart Valve Industry Revenue (Million), by Position 2024 & 2032
- Figure 76: South America Prosthetic Heart Valve Industry Volume (K Unit), by Position 2024 & 2032
- Figure 77: South America Prosthetic Heart Valve Industry Revenue Share (%), by Position 2024 & 2032
- Figure 78: South America Prosthetic Heart Valve Industry Volume Share (%), by Position 2024 & 2032
- Figure 79: South America Prosthetic Heart Valve Industry Revenue (Million), by Country 2024 & 2032
- Figure 80: South America Prosthetic Heart Valve Industry Volume (K Unit), by Country 2024 & 2032
- Figure 81: South America Prosthetic Heart Valve Industry Revenue Share (%), by Country 2024 & 2032
- Figure 82: South America Prosthetic Heart Valve Industry Volume Share (%), by Country 2024 & 2032
List of Tables
- Table 1: Global Prosthetic Heart Valve Industry Revenue Million Forecast, by Region 2019 & 2032
- Table 2: Global Prosthetic Heart Valve Industry Volume K Unit Forecast, by Region 2019 & 2032
- Table 3: Global Prosthetic Heart Valve Industry Revenue Million Forecast, by Type of Valve 2019 & 2032
- Table 4: Global Prosthetic Heart Valve Industry Volume K Unit Forecast, by Type of Valve 2019 & 2032
- Table 5: Global Prosthetic Heart Valve Industry Revenue Million Forecast, by Position 2019 & 2032
- Table 6: Global Prosthetic Heart Valve Industry Volume K Unit Forecast, by Position 2019 & 2032
- Table 7: Global Prosthetic Heart Valve Industry Revenue Million Forecast, by Region 2019 & 2032
- Table 8: Global Prosthetic Heart Valve Industry Volume K Unit Forecast, by Region 2019 & 2032
- Table 9: Global Prosthetic Heart Valve Industry Revenue Million Forecast, by Country 2019 & 2032
- Table 10: Global Prosthetic Heart Valve Industry Volume K Unit Forecast, by Country 2019 & 2032
- Table 11: Global Prosthetic Heart Valve Industry Revenue Million Forecast, by Country 2019 & 2032
- Table 12: Global Prosthetic Heart Valve Industry Volume K Unit Forecast, by Country 2019 & 2032
- Table 13: Global Prosthetic Heart Valve Industry Revenue Million Forecast, by Country 2019 & 2032
- Table 14: Global Prosthetic Heart Valve Industry Volume K Unit Forecast, by Country 2019 & 2032
- Table 15: Global Prosthetic Heart Valve Industry Revenue Million Forecast, by Country 2019 & 2032
- Table 16: Global Prosthetic Heart Valve Industry Volume K Unit Forecast, by Country 2019 & 2032
- Table 17: Global Prosthetic Heart Valve Industry Revenue Million Forecast, by Country 2019 & 2032
- Table 18: Global Prosthetic Heart Valve Industry Volume K Unit Forecast, by Country 2019 & 2032
- Table 19: Global Prosthetic Heart Valve Industry Revenue Million Forecast, by Type of Valve 2019 & 2032
- Table 20: Global Prosthetic Heart Valve Industry Volume K Unit Forecast, by Type of Valve 2019 & 2032
- Table 21: Global Prosthetic Heart Valve Industry Revenue Million Forecast, by Position 2019 & 2032
- Table 22: Global Prosthetic Heart Valve Industry Volume K Unit Forecast, by Position 2019 & 2032
- Table 23: Global Prosthetic Heart Valve Industry Revenue Million Forecast, by Country 2019 & 2032
- Table 24: Global Prosthetic Heart Valve Industry Volume K Unit Forecast, by Country 2019 & 2032
- Table 25: United States Prosthetic Heart Valve Industry Revenue (Million) Forecast, by Application 2019 & 2032
- Table 26: United States Prosthetic Heart Valve Industry Volume (K Unit) Forecast, by Application 2019 & 2032
- Table 27: Canada Prosthetic Heart Valve Industry Revenue (Million) Forecast, by Application 2019 & 2032
- Table 28: Canada Prosthetic Heart Valve Industry Volume (K Unit) Forecast, by Application 2019 & 2032
- Table 29: Mexico Prosthetic Heart Valve Industry Revenue (Million) Forecast, by Application 2019 & 2032
- Table 30: Mexico Prosthetic Heart Valve Industry Volume (K Unit) Forecast, by Application 2019 & 2032
- Table 31: Global Prosthetic Heart Valve Industry Revenue Million Forecast, by Type of Valve 2019 & 2032
- Table 32: Global Prosthetic Heart Valve Industry Volume K Unit Forecast, by Type of Valve 2019 & 2032
- Table 33: Global Prosthetic Heart Valve Industry Revenue Million Forecast, by Position 2019 & 2032
- Table 34: Global Prosthetic Heart Valve Industry Volume K Unit Forecast, by Position 2019 & 2032
- Table 35: Global Prosthetic Heart Valve Industry Revenue Million Forecast, by Country 2019 & 2032
- Table 36: Global Prosthetic Heart Valve Industry Volume K Unit Forecast, by Country 2019 & 2032
- Table 37: Germany Prosthetic Heart Valve Industry Revenue (Million) Forecast, by Application 2019 & 2032
- Table 38: Germany Prosthetic Heart Valve Industry Volume (K Unit) Forecast, by Application 2019 & 2032
- Table 39: United Kingdom Prosthetic Heart Valve Industry Revenue (Million) Forecast, by Application 2019 & 2032
- Table 40: United Kingdom Prosthetic Heart Valve Industry Volume (K Unit) Forecast, by Application 2019 & 2032
- Table 41: France Prosthetic Heart Valve Industry Revenue (Million) Forecast, by Application 2019 & 2032
- Table 42: France Prosthetic Heart Valve Industry Volume (K Unit) Forecast, by Application 2019 & 2032
- Table 43: Italy Prosthetic Heart Valve Industry Revenue (Million) Forecast, by Application 2019 & 2032
- Table 44: Italy Prosthetic Heart Valve Industry Volume (K Unit) Forecast, by Application 2019 & 2032
- Table 45: Spain Prosthetic Heart Valve Industry Revenue (Million) Forecast, by Application 2019 & 2032
- Table 46: Spain Prosthetic Heart Valve Industry Volume (K Unit) Forecast, by Application 2019 & 2032
- Table 47: Rest of Europe Prosthetic Heart Valve Industry Revenue (Million) Forecast, by Application 2019 & 2032
- Table 48: Rest of Europe Prosthetic Heart Valve Industry Volume (K Unit) Forecast, by Application 2019 & 2032
- Table 49: Global Prosthetic Heart Valve Industry Revenue Million Forecast, by Type of Valve 2019 & 2032
- Table 50: Global Prosthetic Heart Valve Industry Volume K Unit Forecast, by Type of Valve 2019 & 2032
- Table 51: Global Prosthetic Heart Valve Industry Revenue Million Forecast, by Position 2019 & 2032
- Table 52: Global Prosthetic Heart Valve Industry Volume K Unit Forecast, by Position 2019 & 2032
- Table 53: Global Prosthetic Heart Valve Industry Revenue Million Forecast, by Country 2019 & 2032
- Table 54: Global Prosthetic Heart Valve Industry Volume K Unit Forecast, by Country 2019 & 2032
- Table 55: China Prosthetic Heart Valve Industry Revenue (Million) Forecast, by Application 2019 & 2032
- Table 56: China Prosthetic Heart Valve Industry Volume (K Unit) Forecast, by Application 2019 & 2032
- Table 57: Japan Prosthetic Heart Valve Industry Revenue (Million) Forecast, by Application 2019 & 2032
- Table 58: Japan Prosthetic Heart Valve Industry Volume (K Unit) Forecast, by Application 2019 & 2032
- Table 59: India Prosthetic Heart Valve Industry Revenue (Million) Forecast, by Application 2019 & 2032
- Table 60: India Prosthetic Heart Valve Industry Volume (K Unit) Forecast, by Application 2019 & 2032
- Table 61: Australia Prosthetic Heart Valve Industry Revenue (Million) Forecast, by Application 2019 & 2032
- Table 62: Australia Prosthetic Heart Valve Industry Volume (K Unit) Forecast, by Application 2019 & 2032
- Table 63: South Korea Prosthetic Heart Valve Industry Revenue (Million) Forecast, by Application 2019 & 2032
- Table 64: South Korea Prosthetic Heart Valve Industry Volume (K Unit) Forecast, by Application 2019 & 2032
- Table 65: Rest of Asia Pacific Prosthetic Heart Valve Industry Revenue (Million) Forecast, by Application 2019 & 2032
- Table 66: Rest of Asia Pacific Prosthetic Heart Valve Industry Volume (K Unit) Forecast, by Application 2019 & 2032
- Table 67: Global Prosthetic Heart Valve Industry Revenue Million Forecast, by Type of Valve 2019 & 2032
- Table 68: Global Prosthetic Heart Valve Industry Volume K Unit Forecast, by Type of Valve 2019 & 2032
- Table 69: Global Prosthetic Heart Valve Industry Revenue Million Forecast, by Position 2019 & 2032
- Table 70: Global Prosthetic Heart Valve Industry Volume K Unit Forecast, by Position 2019 & 2032
- Table 71: Global Prosthetic Heart Valve Industry Revenue Million Forecast, by Country 2019 & 2032
- Table 72: Global Prosthetic Heart Valve Industry Volume K Unit Forecast, by Country 2019 & 2032
- Table 73: GCC Prosthetic Heart Valve Industry Revenue (Million) Forecast, by Application 2019 & 2032
- Table 74: GCC Prosthetic Heart Valve Industry Volume (K Unit) Forecast, by Application 2019 & 2032
- Table 75: South Africa Prosthetic Heart Valve Industry Revenue (Million) Forecast, by Application 2019 & 2032
- Table 76: South Africa Prosthetic Heart Valve Industry Volume (K Unit) Forecast, by Application 2019 & 2032
- Table 77: Rest of Middle East and Africa Prosthetic Heart Valve Industry Revenue (Million) Forecast, by Application 2019 & 2032
- Table 78: Rest of Middle East and Africa Prosthetic Heart Valve Industry Volume (K Unit) Forecast, by Application 2019 & 2032
- Table 79: Global Prosthetic Heart Valve Industry Revenue Million Forecast, by Type of Valve 2019 & 2032
- Table 80: Global Prosthetic Heart Valve Industry Volume K Unit Forecast, by Type of Valve 2019 & 2032
- Table 81: Global Prosthetic Heart Valve Industry Revenue Million Forecast, by Position 2019 & 2032
- Table 82: Global Prosthetic Heart Valve Industry Volume K Unit Forecast, by Position 2019 & 2032
- Table 83: Global Prosthetic Heart Valve Industry Revenue Million Forecast, by Country 2019 & 2032
- Table 84: Global Prosthetic Heart Valve Industry Volume K Unit Forecast, by Country 2019 & 2032
- Table 85: Brazil Prosthetic Heart Valve Industry Revenue (Million) Forecast, by Application 2019 & 2032
- Table 86: Brazil Prosthetic Heart Valve Industry Volume (K Unit) Forecast, by Application 2019 & 2032
- Table 87: Argentina Prosthetic Heart Valve Industry Revenue (Million) Forecast, by Application 2019 & 2032
- Table 88: Argentina Prosthetic Heart Valve Industry Volume (K Unit) Forecast, by Application 2019 & 2032
- Table 89: Rest of South America Prosthetic Heart Valve Industry Revenue (Million) Forecast, by Application 2019 & 2032
- Table 90: Rest of South America Prosthetic Heart Valve Industry Volume (K Unit) Forecast, by Application 2019 & 2032
Frequently Asked Questions
1. What is the projected Compound Annual Growth Rate (CAGR) of the Prosthetic Heart Valve Industry?
The projected CAGR is approximately 11.80%.
2. Which companies are prominent players in the Prosthetic Heart Valve Industry?
Key companies in the market include Edwards Lifesciences Corporation, Foldax Inc, Jenavalve Technology Inc, Cryolife Inc, Lepu Medical Technology Co Ltd, Medtronic PLC, Abbott Laboratories (St Jude Medical Inc ), Symetis SA, Colibri Heart Valve LLC, Boston Scientific Corporation, TTK Healthcare Limited.
3. What are the main segments of the Prosthetic Heart Valve Industry?
The market segments include Type of Valve, Position.
4. Can you provide details about the market size?
The market size is estimated to be USD 11.94 Million as of 2022.
5. What are some drivers contributing to market growth?
Increasing Prevalence of Heart Valve Disease; Rising Regulatory Approvals for New and Advanced Prosthetic Heart Valve.
6. What are the notable trends driving market growth?
Transcatheter Heart Valve Segment is Expected to Register Robust Growth During the Forecast Period.
7. Are there any restraints impacting market growth?
High Cost of Transcatheter Aortic Valve Replacement (TAVR) Procedures; Availability of Alternative Methods for Treating Heart Valve Diseases (HVD).
8. Can you provide examples of recent developments in the market?
In March 2022, Edwards Lifesciences received approval from the United States Food and Drug Administration (FDA) for the MITRIS RESILIA valve. It is a tissue valve replacement specifically designed for the heart's mitral position.
9. What pricing options are available for accessing the report?
Pricing options include single-user, multi-user, and enterprise licenses priced at USD 4750, USD 5250, and USD 8750 respectively.
10. Is the market size provided in terms of value or volume?
The market size is provided in terms of value, measured in Million and volume, measured in K Unit.
11. Are there any specific market keywords associated with the report?
Yes, the market keyword associated with the report is "Prosthetic Heart Valve Industry," which aids in identifying and referencing the specific market segment covered.
12. How do I determine which pricing option suits my needs best?
The pricing options vary based on user requirements and access needs. Individual users may opt for single-user licenses, while businesses requiring broader access may choose multi-user or enterprise licenses for cost-effective access to the report.
13. Are there any additional resources or data provided in the Prosthetic Heart Valve Industry report?
While the report offers comprehensive insights, it's advisable to review the specific contents or supplementary materials provided to ascertain if additional resources or data are available.
14. How can I stay updated on further developments or reports in the Prosthetic Heart Valve Industry?
To stay informed about further developments, trends, and reports in the Prosthetic Heart Valve Industry, consider subscribing to industry newsletters, following relevant companies and organizations, or regularly checking reputable industry news sources and publications.
Methodology
Step 1 - Identification of Relevant Samples Size from Population Database


Step 2 - Approaches for Defining Global Market Size (Value, Volume* & Price*)

Note*: In applicable scenarios
Step 3 - Data Sources
Primary Research
- Web Analytics
- Survey Reports
- Research Institute
- Latest Research Reports
- Opinion Leaders
Secondary Research
- Annual Reports
- White Paper
- Latest Press Release
- Industry Association
- Paid Database
- Investor Presentations

Step 4 - Data Triangulation
Involves using different sources of information in order to increase the validity of a study
These sources are likely to be stakeholders in a program - participants, other researchers, program staff, other community members, and so on.
Then we put all data in single framework & apply various statistical tools to find out the dynamic on the market.
During the analysis stage, feedback from the stakeholder groups would be compared to determine areas of agreement as well as areas of divergence


