
Key Insights
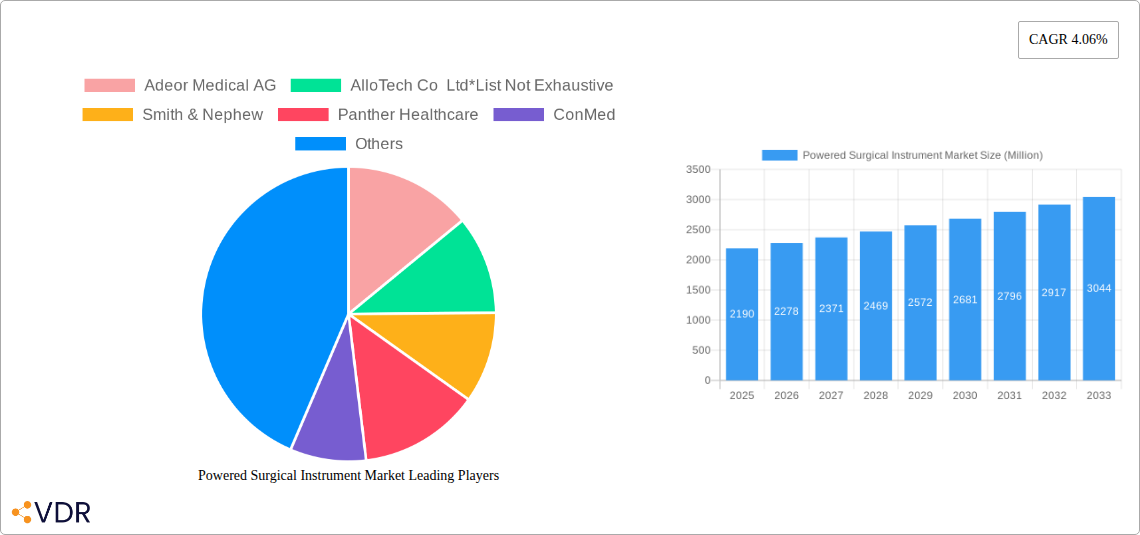
The global powered surgical instruments market, valued at $2.19 billion in 2025, is projected to experience robust growth, driven by several key factors. Technological advancements leading to minimally invasive procedures, increasing prevalence of chronic diseases requiring surgical intervention, and a rising geriatric population demanding improved surgical outcomes are significant contributors to market expansion. The demand for enhanced precision, reduced surgical time, and improved patient recovery fuels the adoption of sophisticated powered instruments across various surgical specialties. Orthopedic, neurosurgery, and cardiothoracic surgery segments are major contributors, showcasing substantial growth potential due to the increasing complexity of procedures and the growing preference for minimally invasive techniques within these specializations. The electric instruments segment holds a significant market share owing to their precision and ease of use compared to other power sources. However, the high initial investment cost associated with advanced powered surgical instruments might slightly restrain market growth in certain regions. Competition among established players like Johnson & Johnson, Medtronic, and Stryker, alongside emerging companies, is intensifying, driving innovation and fostering a dynamic market environment. Geographic expansion, particularly in emerging economies experiencing rising healthcare infrastructure development, presents lucrative opportunities for market players.
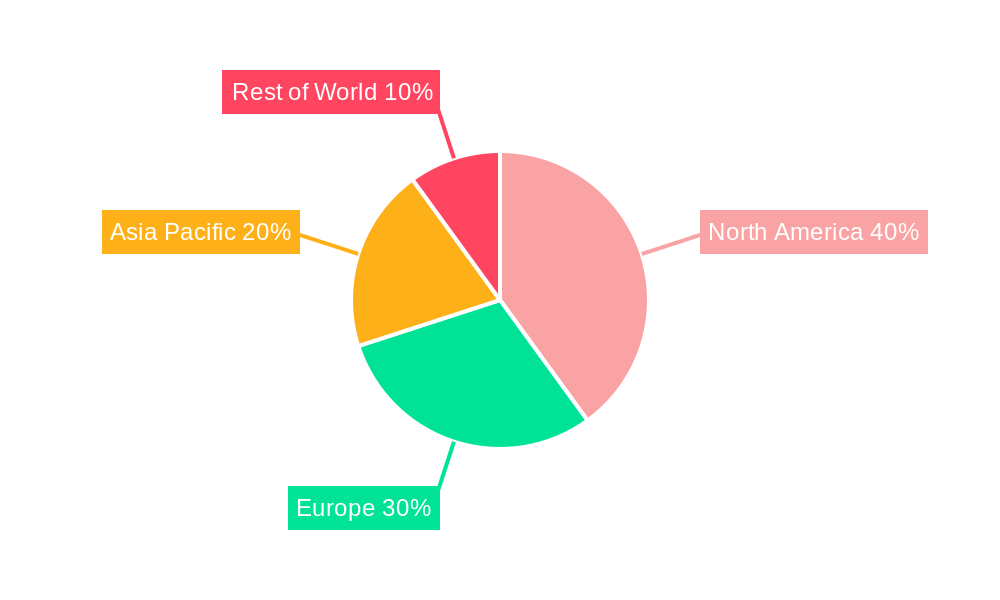
Furthermore, the market is witnessing a growing trend towards disposable instruments, driven by infection control concerns and convenience. This segment is expected to experience above-average growth, further propelling the overall market expansion. The incorporation of advanced features like haptic feedback and robotic integration in powered surgical instruments is shaping the future of surgical procedures and will contribute to further growth in coming years. Regional variations exist, with North America and Europe currently dominating the market due to advanced healthcare infrastructure and high adoption rates. However, rapidly developing economies in the Asia-Pacific region and other emerging markets present significant untapped potential, representing key growth areas in the coming years. The market's future trajectory is promising, with a sustained CAGR, indicative of a positive growth outlook over the forecast period.
Powered Surgical Instrument Market: A Comprehensive Report (2019-2033)
This in-depth report provides a comprehensive analysis of the Powered Surgical Instrument market, encompassing market dynamics, growth trends, regional dominance, product landscape, key players, and future outlook. The report covers the period from 2019 to 2033, with a focus on the estimated year 2025 and a forecast period of 2025-2033. The market is segmented by application (Orthopedic, Dental, Neurosurgery, Cardiothoracic Surgery, Other Applications), power source (Electric Instruments, Battery-powered Instruments, Pneumatic Instruments), and product type (Handpiece, Disposables, Other Disposables: Accessories). The global market size is estimated at xx Million units in 2025 and is projected to reach xx Million units by 2033.
This report is essential for industry professionals, investors, and strategists seeking a detailed understanding of this dynamic market and its future potential.
Powered Surgical Instrument Market Market Dynamics & Structure
The Powered Surgical Instrument market exhibits a moderately concentrated structure, with key players holding significant market share. Technological innovation, particularly in areas like robotic surgery and minimally invasive procedures, is a major driver. Stringent regulatory frameworks concerning device safety and efficacy impact market entry and growth. Competitive substitutes, such as manual surgical instruments, exist but are increasingly challenged by the precision and efficiency of powered instruments. The end-user demographic primarily comprises hospitals and surgical centers, with increasing adoption in ambulatory surgical centers. Mergers and acquisitions (M&A) are frequent, reflecting consolidation within the industry. In the past five years, we estimate approximately xx M&A deals involving powered surgical instrument companies, with a total value exceeding xx Million units.
- Market Concentration: Moderately concentrated, with top 5 players holding approximately xx% market share.
- Technological Innovation: Focus on miniaturization, enhanced precision, and integration with digital technologies.
- Regulatory Framework: Stringent safety and efficacy regulations by global regulatory bodies (FDA, CE marking).
- Competitive Substitutes: Manual instruments, but powered instruments offer significant advantages in precision and efficiency.
- End-User Demographics: Hospitals, surgical centers, and increasingly ambulatory surgical centers.
- M&A Trends: Significant M&A activity driven by market consolidation and technological advancements.
Powered Surgical Instrument Market Growth Trends & Insights
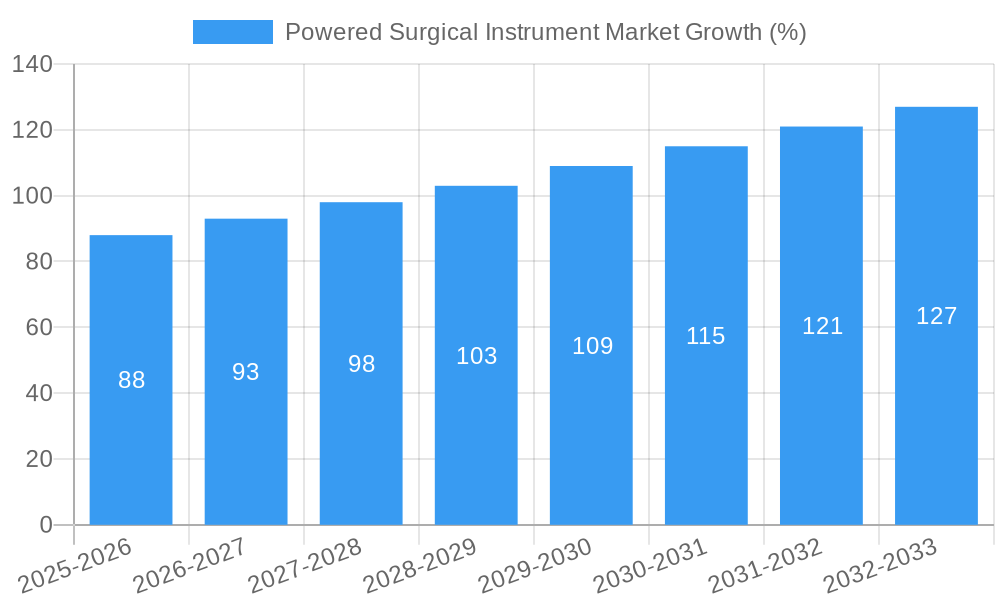
The Powered Surgical Instrument market has witnessed robust growth over the historical period (2019-2024), driven primarily by the increasing adoption of minimally invasive surgical techniques, rising prevalence of chronic diseases requiring surgery, and technological advancements in instrument design. The market experienced a CAGR of xx% during this period. The market is projected to continue its growth trajectory during the forecast period (2025-2033), with a projected CAGR of xx%. This growth is underpinned by factors such as the increasing demand for advanced surgical tools, growing geriatric population, and rising disposable income in emerging economies. Market penetration of powered surgical instruments is estimated at xx% in 2025 and is expected to increase to xx% by 2033, driven by technological advancements and increased surgeon preference.
Dominant Regions, Countries, or Segments in Powered Surgical Instrument Market
North America currently holds the largest market share, driven by high healthcare expenditure, technological advancements, and a robust regulatory framework. Europe follows as a significant market, demonstrating steady growth owing to increasing adoption of advanced surgical techniques and a growing geriatric population. The Asia-Pacific region presents considerable growth potential due to rapid economic development, increasing healthcare infrastructure, and rising demand for minimally invasive surgeries.
- By Application: Orthopedic surgery holds the largest market share, followed by Neurosurgery and Cardiothoracic surgery.
- By Power Source: Electric instruments dominate the market due to their versatility and power.
- By Product Type: Handpieces are the most widely used product type, followed by disposable components.
- Key Growth Drivers: Increasing prevalence of chronic diseases, rising adoption of minimally invasive surgeries, technological advancements, and high healthcare expenditure in developed economies.
Powered Surgical Instrument Market Product Landscape
The powered surgical instrument market encompasses a diverse range of products, from sophisticated handpieces for precise tissue manipulation to disposable components designed for enhanced hygiene and safety. Recent innovations include instruments with enhanced ergonomics, improved control systems, and integration of digital technologies for improved surgical precision and efficiency. Unique selling propositions include features such as programmable settings, real-time feedback mechanisms, and enhanced durability. Technological advancements are focusing on the integration of robotics, AI-driven tools, and improved visualization technologies for more precise, less invasive procedures.
Key Drivers, Barriers & Challenges in Powered Surgical Instrument Market
Key Drivers: The increasing prevalence of chronic diseases requiring surgical intervention, the growing preference for minimally invasive surgical procedures, and continuous technological advancements contribute to the market's growth. Favorable regulatory environments in key markets also play a significant role.
Key Barriers & Challenges: High initial investment costs associated with advanced powered surgical instruments and stringent regulatory pathways for device approvals present challenges. Competition among established players and the potential for supply chain disruptions also impact market growth. We estimate that regulatory hurdles delay market entry by an average of xx months, impacting overall sales by an estimated xx Million units annually.
Emerging Opportunities in Powered Surgical Instrument Market
Emerging opportunities include the development of innovative powered instruments for specialized surgical procedures, expansion into untapped markets in developing countries, and the integration of AI and machine learning for enhanced surgical precision. Moreover, growing interest in personalized medicine and the development of instruments tailored to specific patient needs present significant growth opportunities.
Growth Accelerators in the Powered Surgical Instrument Market Industry
Strategic partnerships between instrument manufacturers and technology providers to integrate AI and robotic technologies are driving long-term growth. Expansion into emerging markets and the development of cost-effective instruments for these regions are crucial for sustained market expansion. Furthermore, continuous innovation in instrument design and functionality are key to maintaining a competitive advantage.
Key Players Shaping the Powered Surgical Instrument Market Market
- Adeor Medical AG
- AlloTech Co Ltd
- Smith & Nephew
- Panther Healthcare
- ConMed
- MicroAire Surgical Instruments
- B Braun Melsungen AG
- Medtronic PLC
- Desoutter Medical Ltd
- Johnson & Johnson
- Stryker Corporation
- Zimmer Biomet
Notable Milestones in Powered Surgical Instrument Market Sector
- September 2022: Teleflex Incorporated acquired Standard Bariatrics, expanding its presence in powered stapling technology for bariatric surgery.
- June 2022: Ethicon launched the ECHELON 3000 Stapler, a digitally enabled device improving surgical precision.
- September 2021: Panther Healthcare launched the Smart Powered Stapler platform, offering intelligent control over tissue manipulation in various surgical procedures.
In-Depth Powered Surgical Instrument Market Market Outlook
The Powered Surgical Instrument market is poised for continued growth, driven by technological advancements, expanding applications, and increasing adoption in emerging markets. Strategic acquisitions and partnerships will shape the competitive landscape, with a focus on innovation and differentiation. The market's future potential hinges on the successful development and commercialization of cutting-edge instruments and the expansion into new therapeutic areas. The market is expected to witness significant growth, driven by the factors outlined earlier, leading to substantial opportunities for market participants.
Powered Surgical Instrument Market Segmentation
-
1. Power Source
- 1.1. Electric Instruments
- 1.2. Battery-powered Instruments
- 1.3. Pneumatic Instruments
-
2. Product Type
-
2.1. Instruments
- 2.1.1. Handpiece
- 2.1.2. Drill System
- 2.1.3. Saw Systems
- 2.1.4. Reamer Systems
- 2.1.5. Staplers
- 2.1.6. Shavers
- 2.1.7. Other In
- 2.2. Accessories
-
2.1. Instruments
-
3. Application
- 3.1. Orthopedic
- 3.2. Dental
- 3.3. Neurosurgery
- 3.4. Cardiothoracic Surgery
- 3.5. Other Ap
Powered Surgical Instrument Market Segmentation By Geography
-
1. North America
- 1.1. United States
- 1.2. Canada
- 1.3. Mexico
-
2. Europe
- 2.1. Germany
- 2.2. United Kingdom
- 2.3. France
- 2.4. Italy
- 2.5. Spain
- 2.6. Rest of Europe
-
3. Asia Pacific
- 3.1. China
- 3.2. Japan
- 3.3. India
- 3.4. Australia
- 3.5. South Korea
- 3.6. Rest of Asia Pacific
-
4. Middle East and Africa
- 4.1. GCC
- 4.2. South Africa
- 4.3. Rest of Middle East and Africa
-
5. South America
- 5.1. Brazil
- 5.2. Argentina
- 5.3. Rest of South America
Powered Surgical Instrument Market REPORT HIGHLIGHTS
| Aspects | Details |
|---|---|
| Study Period | 2019-2033 |
| Base Year | 2024 |
| Estimated Year | 2025 |
| Forecast Period | 2025-2033 |
| Historical Period | 2019-2024 |
| Growth Rate | CAGR of 4.06% from 2019-2033 |
| Segmentation |
|
Table of Contents
- 1. Introduction
- 1.1. Research Scope
- 1.2. Market Segmentation
- 1.3. Research Methodology
- 1.4. Definitions and Assumptions
- 2. Executive Summary
- 2.1. Introduction
- 3. Market Dynamics
- 3.1. Introduction
- 3.2. Market Drivers
- 3.2.1. Increasing Number of Surgical Procedures; Increasing Geriatric Population and Rising Lifestyle Disease Burden; Technological Innovations
- 3.3. Market Restrains
- 3.3.1. Reimbursement Challenges; Inadequate Skilled Professionals; Lack of Sterilization Procedure
- 3.4. Market Trends
- 3.4.1. The Orthopedic Surgery Segment is Expected to Have a Notable Growth Rate
- 4. Market Factor Analysis
- 4.1. Porters Five Forces
- 4.2. Supply/Value Chain
- 4.3. PESTEL analysis
- 4.4. Market Entropy
- 4.5. Patent/Trademark Analysis
- 5. Global Powered Surgical Instrument Market Analysis, Insights and Forecast, 2019-2031
- 5.1. Market Analysis, Insights and Forecast - by Power Source
- 5.1.1. Electric Instruments
- 5.1.2. Battery-powered Instruments
- 5.1.3. Pneumatic Instruments
- 5.2. Market Analysis, Insights and Forecast - by Product Type
- 5.2.1. Instruments
- 5.2.1.1. Handpiece
- 5.2.1.2. Drill System
- 5.2.1.3. Saw Systems
- 5.2.1.4. Reamer Systems
- 5.2.1.5. Staplers
- 5.2.1.6. Shavers
- 5.2.1.7. Other In
- 5.2.2. Accessories
- 5.2.1. Instruments
- 5.3. Market Analysis, Insights and Forecast - by Application
- 5.3.1. Orthopedic
- 5.3.2. Dental
- 5.3.3. Neurosurgery
- 5.3.4. Cardiothoracic Surgery
- 5.3.5. Other Ap
- 5.4. Market Analysis, Insights and Forecast - by Region
- 5.4.1. North America
- 5.4.2. Europe
- 5.4.3. Asia Pacific
- 5.4.4. Middle East and Africa
- 5.4.5. South America
- 5.1. Market Analysis, Insights and Forecast - by Power Source
- 6. North America Powered Surgical Instrument Market Analysis, Insights and Forecast, 2019-2031
- 6.1. Market Analysis, Insights and Forecast - by Power Source
- 6.1.1. Electric Instruments
- 6.1.2. Battery-powered Instruments
- 6.1.3. Pneumatic Instruments
- 6.2. Market Analysis, Insights and Forecast - by Product Type
- 6.2.1. Instruments
- 6.2.1.1. Handpiece
- 6.2.1.2. Drill System
- 6.2.1.3. Saw Systems
- 6.2.1.4. Reamer Systems
- 6.2.1.5. Staplers
- 6.2.1.6. Shavers
- 6.2.1.7. Other In
- 6.2.2. Accessories
- 6.2.1. Instruments
- 6.3. Market Analysis, Insights and Forecast - by Application
- 6.3.1. Orthopedic
- 6.3.2. Dental
- 6.3.3. Neurosurgery
- 6.3.4. Cardiothoracic Surgery
- 6.3.5. Other Ap
- 6.1. Market Analysis, Insights and Forecast - by Power Source
- 7. Europe Powered Surgical Instrument Market Analysis, Insights and Forecast, 2019-2031
- 7.1. Market Analysis, Insights and Forecast - by Power Source
- 7.1.1. Electric Instruments
- 7.1.2. Battery-powered Instruments
- 7.1.3. Pneumatic Instruments
- 7.2. Market Analysis, Insights and Forecast - by Product Type
- 7.2.1. Instruments
- 7.2.1.1. Handpiece
- 7.2.1.2. Drill System
- 7.2.1.3. Saw Systems
- 7.2.1.4. Reamer Systems
- 7.2.1.5. Staplers
- 7.2.1.6. Shavers
- 7.2.1.7. Other In
- 7.2.2. Accessories
- 7.2.1. Instruments
- 7.3. Market Analysis, Insights and Forecast - by Application
- 7.3.1. Orthopedic
- 7.3.2. Dental
- 7.3.3. Neurosurgery
- 7.3.4. Cardiothoracic Surgery
- 7.3.5. Other Ap
- 7.1. Market Analysis, Insights and Forecast - by Power Source
- 8. Asia Pacific Powered Surgical Instrument Market Analysis, Insights and Forecast, 2019-2031
- 8.1. Market Analysis, Insights and Forecast - by Power Source
- 8.1.1. Electric Instruments
- 8.1.2. Battery-powered Instruments
- 8.1.3. Pneumatic Instruments
- 8.2. Market Analysis, Insights and Forecast - by Product Type
- 8.2.1. Instruments
- 8.2.1.1. Handpiece
- 8.2.1.2. Drill System
- 8.2.1.3. Saw Systems
- 8.2.1.4. Reamer Systems
- 8.2.1.5. Staplers
- 8.2.1.6. Shavers
- 8.2.1.7. Other In
- 8.2.2. Accessories
- 8.2.1. Instruments
- 8.3. Market Analysis, Insights and Forecast - by Application
- 8.3.1. Orthopedic
- 8.3.2. Dental
- 8.3.3. Neurosurgery
- 8.3.4. Cardiothoracic Surgery
- 8.3.5. Other Ap
- 8.1. Market Analysis, Insights and Forecast - by Power Source
- 9. Middle East and Africa Powered Surgical Instrument Market Analysis, Insights and Forecast, 2019-2031
- 9.1. Market Analysis, Insights and Forecast - by Power Source
- 9.1.1. Electric Instruments
- 9.1.2. Battery-powered Instruments
- 9.1.3. Pneumatic Instruments
- 9.2. Market Analysis, Insights and Forecast - by Product Type
- 9.2.1. Instruments
- 9.2.1.1. Handpiece
- 9.2.1.2. Drill System
- 9.2.1.3. Saw Systems
- 9.2.1.4. Reamer Systems
- 9.2.1.5. Staplers
- 9.2.1.6. Shavers
- 9.2.1.7. Other In
- 9.2.2. Accessories
- 9.2.1. Instruments
- 9.3. Market Analysis, Insights and Forecast - by Application
- 9.3.1. Orthopedic
- 9.3.2. Dental
- 9.3.3. Neurosurgery
- 9.3.4. Cardiothoracic Surgery
- 9.3.5. Other Ap
- 9.1. Market Analysis, Insights and Forecast - by Power Source
- 10. South America Powered Surgical Instrument Market Analysis, Insights and Forecast, 2019-2031
- 10.1. Market Analysis, Insights and Forecast - by Power Source
- 10.1.1. Electric Instruments
- 10.1.2. Battery-powered Instruments
- 10.1.3. Pneumatic Instruments
- 10.2. Market Analysis, Insights and Forecast - by Product Type
- 10.2.1. Instruments
- 10.2.1.1. Handpiece
- 10.2.1.2. Drill System
- 10.2.1.3. Saw Systems
- 10.2.1.4. Reamer Systems
- 10.2.1.5. Staplers
- 10.2.1.6. Shavers
- 10.2.1.7. Other In
- 10.2.2. Accessories
- 10.2.1. Instruments
- 10.3. Market Analysis, Insights and Forecast - by Application
- 10.3.1. Orthopedic
- 10.3.2. Dental
- 10.3.3. Neurosurgery
- 10.3.4. Cardiothoracic Surgery
- 10.3.5. Other Ap
- 10.1. Market Analysis, Insights and Forecast - by Power Source
- 11. North America Powered Surgical Instrument Market Analysis, Insights and Forecast, 2019-2031
- 11.1. Market Analysis, Insights and Forecast - By Country/Sub-region
- 11.1.1 United States
- 11.1.2 Canada
- 11.1.3 Mexico
- 12. Europe Powered Surgical Instrument Market Analysis, Insights and Forecast, 2019-2031
- 12.1. Market Analysis, Insights and Forecast - By Country/Sub-region
- 12.1.1 Germany
- 12.1.2 United Kingdom
- 12.1.3 France
- 12.1.4 Italy
- 12.1.5 Spain
- 12.1.6 Rest of Europe
- 13. Asia Pacific Powered Surgical Instrument Market Analysis, Insights and Forecast, 2019-2031
- 13.1. Market Analysis, Insights and Forecast - By Country/Sub-region
- 13.1.1 China
- 13.1.2 Japan
- 13.1.3 India
- 13.1.4 Australia
- 13.1.5 South Korea
- 13.1.6 Rest of Asia Pacific
- 14. Middle East and Africa Powered Surgical Instrument Market Analysis, Insights and Forecast, 2019-2031
- 14.1. Market Analysis, Insights and Forecast - By Country/Sub-region
- 14.1.1 GCC
- 14.1.2 South Africa
- 14.1.3 Rest of Middle East and Africa
- 15. South America Powered Surgical Instrument Market Analysis, Insights and Forecast, 2019-2031
- 15.1. Market Analysis, Insights and Forecast - By Country/Sub-region
- 15.1.1 Brazil
- 15.1.2 Argentina
- 15.1.3 Rest of South America
- 16. Competitive Analysis
- 16.1. Global Market Share Analysis 2024
- 16.2. Company Profiles
- 16.2.1 Adeor Medical AG
- 16.2.1.1. Overview
- 16.2.1.2. Products
- 16.2.1.3. SWOT Analysis
- 16.2.1.4. Recent Developments
- 16.2.1.5. Financials (Based on Availability)
- 16.2.2 AlloTech Co Ltd*List Not Exhaustive
- 16.2.2.1. Overview
- 16.2.2.2. Products
- 16.2.2.3. SWOT Analysis
- 16.2.2.4. Recent Developments
- 16.2.2.5. Financials (Based on Availability)
- 16.2.3 Smith & Nephew
- 16.2.3.1. Overview
- 16.2.3.2. Products
- 16.2.3.3. SWOT Analysis
- 16.2.3.4. Recent Developments
- 16.2.3.5. Financials (Based on Availability)
- 16.2.4 Panther Healthcare
- 16.2.4.1. Overview
- 16.2.4.2. Products
- 16.2.4.3. SWOT Analysis
- 16.2.4.4. Recent Developments
- 16.2.4.5. Financials (Based on Availability)
- 16.2.5 ConMed
- 16.2.5.1. Overview
- 16.2.5.2. Products
- 16.2.5.3. SWOT Analysis
- 16.2.5.4. Recent Developments
- 16.2.5.5. Financials (Based on Availability)
- 16.2.6 MicroAire Surgical Instruments
- 16.2.6.1. Overview
- 16.2.6.2. Products
- 16.2.6.3. SWOT Analysis
- 16.2.6.4. Recent Developments
- 16.2.6.5. Financials (Based on Availability)
- 16.2.7 B Braun Melsungen Ag
- 16.2.7.1. Overview
- 16.2.7.2. Products
- 16.2.7.3. SWOT Analysis
- 16.2.7.4. Recent Developments
- 16.2.7.5. Financials (Based on Availability)
- 16.2.8 Medtronic PLC
- 16.2.8.1. Overview
- 16.2.8.2. Products
- 16.2.8.3. SWOT Analysis
- 16.2.8.4. Recent Developments
- 16.2.8.5. Financials (Based on Availability)
- 16.2.9 Desoutter Medical Ltd
- 16.2.9.1. Overview
- 16.2.9.2. Products
- 16.2.9.3. SWOT Analysis
- 16.2.9.4. Recent Developments
- 16.2.9.5. Financials (Based on Availability)
- 16.2.10 Johnson & Johnson
- 16.2.10.1. Overview
- 16.2.10.2. Products
- 16.2.10.3. SWOT Analysis
- 16.2.10.4. Recent Developments
- 16.2.10.5. Financials (Based on Availability)
- 16.2.11 Stryker Corporation
- 16.2.11.1. Overview
- 16.2.11.2. Products
- 16.2.11.3. SWOT Analysis
- 16.2.11.4. Recent Developments
- 16.2.11.5. Financials (Based on Availability)
- 16.2.12 Zimmer Biomet
- 16.2.12.1. Overview
- 16.2.12.2. Products
- 16.2.12.3. SWOT Analysis
- 16.2.12.4. Recent Developments
- 16.2.12.5. Financials (Based on Availability)
- 16.2.1 Adeor Medical AG
List of Figures
- Figure 1: Global Powered Surgical Instrument Market Revenue Breakdown (Million, %) by Region 2024 & 2032
- Figure 2: North America Powered Surgical Instrument Market Revenue (Million), by Country 2024 & 2032
- Figure 3: North America Powered Surgical Instrument Market Revenue Share (%), by Country 2024 & 2032
- Figure 4: Europe Powered Surgical Instrument Market Revenue (Million), by Country 2024 & 2032
- Figure 5: Europe Powered Surgical Instrument Market Revenue Share (%), by Country 2024 & 2032
- Figure 6: Asia Pacific Powered Surgical Instrument Market Revenue (Million), by Country 2024 & 2032
- Figure 7: Asia Pacific Powered Surgical Instrument Market Revenue Share (%), by Country 2024 & 2032
- Figure 8: Middle East and Africa Powered Surgical Instrument Market Revenue (Million), by Country 2024 & 2032
- Figure 9: Middle East and Africa Powered Surgical Instrument Market Revenue Share (%), by Country 2024 & 2032
- Figure 10: South America Powered Surgical Instrument Market Revenue (Million), by Country 2024 & 2032
- Figure 11: South America Powered Surgical Instrument Market Revenue Share (%), by Country 2024 & 2032
- Figure 12: North America Powered Surgical Instrument Market Revenue (Million), by Power Source 2024 & 2032
- Figure 13: North America Powered Surgical Instrument Market Revenue Share (%), by Power Source 2024 & 2032
- Figure 14: North America Powered Surgical Instrument Market Revenue (Million), by Product Type 2024 & 2032
- Figure 15: North America Powered Surgical Instrument Market Revenue Share (%), by Product Type 2024 & 2032
- Figure 16: North America Powered Surgical Instrument Market Revenue (Million), by Application 2024 & 2032
- Figure 17: North America Powered Surgical Instrument Market Revenue Share (%), by Application 2024 & 2032
- Figure 18: North America Powered Surgical Instrument Market Revenue (Million), by Country 2024 & 2032
- Figure 19: North America Powered Surgical Instrument Market Revenue Share (%), by Country 2024 & 2032
- Figure 20: Europe Powered Surgical Instrument Market Revenue (Million), by Power Source 2024 & 2032
- Figure 21: Europe Powered Surgical Instrument Market Revenue Share (%), by Power Source 2024 & 2032
- Figure 22: Europe Powered Surgical Instrument Market Revenue (Million), by Product Type 2024 & 2032
- Figure 23: Europe Powered Surgical Instrument Market Revenue Share (%), by Product Type 2024 & 2032
- Figure 24: Europe Powered Surgical Instrument Market Revenue (Million), by Application 2024 & 2032
- Figure 25: Europe Powered Surgical Instrument Market Revenue Share (%), by Application 2024 & 2032
- Figure 26: Europe Powered Surgical Instrument Market Revenue (Million), by Country 2024 & 2032
- Figure 27: Europe Powered Surgical Instrument Market Revenue Share (%), by Country 2024 & 2032
- Figure 28: Asia Pacific Powered Surgical Instrument Market Revenue (Million), by Power Source 2024 & 2032
- Figure 29: Asia Pacific Powered Surgical Instrument Market Revenue Share (%), by Power Source 2024 & 2032
- Figure 30: Asia Pacific Powered Surgical Instrument Market Revenue (Million), by Product Type 2024 & 2032
- Figure 31: Asia Pacific Powered Surgical Instrument Market Revenue Share (%), by Product Type 2024 & 2032
- Figure 32: Asia Pacific Powered Surgical Instrument Market Revenue (Million), by Application 2024 & 2032
- Figure 33: Asia Pacific Powered Surgical Instrument Market Revenue Share (%), by Application 2024 & 2032
- Figure 34: Asia Pacific Powered Surgical Instrument Market Revenue (Million), by Country 2024 & 2032
- Figure 35: Asia Pacific Powered Surgical Instrument Market Revenue Share (%), by Country 2024 & 2032
- Figure 36: Middle East and Africa Powered Surgical Instrument Market Revenue (Million), by Power Source 2024 & 2032
- Figure 37: Middle East and Africa Powered Surgical Instrument Market Revenue Share (%), by Power Source 2024 & 2032
- Figure 38: Middle East and Africa Powered Surgical Instrument Market Revenue (Million), by Product Type 2024 & 2032
- Figure 39: Middle East and Africa Powered Surgical Instrument Market Revenue Share (%), by Product Type 2024 & 2032
- Figure 40: Middle East and Africa Powered Surgical Instrument Market Revenue (Million), by Application 2024 & 2032
- Figure 41: Middle East and Africa Powered Surgical Instrument Market Revenue Share (%), by Application 2024 & 2032
- Figure 42: Middle East and Africa Powered Surgical Instrument Market Revenue (Million), by Country 2024 & 2032
- Figure 43: Middle East and Africa Powered Surgical Instrument Market Revenue Share (%), by Country 2024 & 2032
- Figure 44: South America Powered Surgical Instrument Market Revenue (Million), by Power Source 2024 & 2032
- Figure 45: South America Powered Surgical Instrument Market Revenue Share (%), by Power Source 2024 & 2032
- Figure 46: South America Powered Surgical Instrument Market Revenue (Million), by Product Type 2024 & 2032
- Figure 47: South America Powered Surgical Instrument Market Revenue Share (%), by Product Type 2024 & 2032
- Figure 48: South America Powered Surgical Instrument Market Revenue (Million), by Application 2024 & 2032
- Figure 49: South America Powered Surgical Instrument Market Revenue Share (%), by Application 2024 & 2032
- Figure 50: South America Powered Surgical Instrument Market Revenue (Million), by Country 2024 & 2032
- Figure 51: South America Powered Surgical Instrument Market Revenue Share (%), by Country 2024 & 2032
List of Tables
- Table 1: Global Powered Surgical Instrument Market Revenue Million Forecast, by Region 2019 & 2032
- Table 2: Global Powered Surgical Instrument Market Revenue Million Forecast, by Power Source 2019 & 2032
- Table 3: Global Powered Surgical Instrument Market Revenue Million Forecast, by Product Type 2019 & 2032
- Table 4: Global Powered Surgical Instrument Market Revenue Million Forecast, by Application 2019 & 2032
- Table 5: Global Powered Surgical Instrument Market Revenue Million Forecast, by Region 2019 & 2032
- Table 6: Global Powered Surgical Instrument Market Revenue Million Forecast, by Country 2019 & 2032
- Table 7: United States Powered Surgical Instrument Market Revenue (Million) Forecast, by Application 2019 & 2032
- Table 8: Canada Powered Surgical Instrument Market Revenue (Million) Forecast, by Application 2019 & 2032
- Table 9: Mexico Powered Surgical Instrument Market Revenue (Million) Forecast, by Application 2019 & 2032
- Table 10: Global Powered Surgical Instrument Market Revenue Million Forecast, by Country 2019 & 2032
- Table 11: Germany Powered Surgical Instrument Market Revenue (Million) Forecast, by Application 2019 & 2032
- Table 12: United Kingdom Powered Surgical Instrument Market Revenue (Million) Forecast, by Application 2019 & 2032
- Table 13: France Powered Surgical Instrument Market Revenue (Million) Forecast, by Application 2019 & 2032
- Table 14: Italy Powered Surgical Instrument Market Revenue (Million) Forecast, by Application 2019 & 2032
- Table 15: Spain Powered Surgical Instrument Market Revenue (Million) Forecast, by Application 2019 & 2032
- Table 16: Rest of Europe Powered Surgical Instrument Market Revenue (Million) Forecast, by Application 2019 & 2032
- Table 17: Global Powered Surgical Instrument Market Revenue Million Forecast, by Country 2019 & 2032
- Table 18: China Powered Surgical Instrument Market Revenue (Million) Forecast, by Application 2019 & 2032
- Table 19: Japan Powered Surgical Instrument Market Revenue (Million) Forecast, by Application 2019 & 2032
- Table 20: India Powered Surgical Instrument Market Revenue (Million) Forecast, by Application 2019 & 2032
- Table 21: Australia Powered Surgical Instrument Market Revenue (Million) Forecast, by Application 2019 & 2032
- Table 22: South Korea Powered Surgical Instrument Market Revenue (Million) Forecast, by Application 2019 & 2032
- Table 23: Rest of Asia Pacific Powered Surgical Instrument Market Revenue (Million) Forecast, by Application 2019 & 2032
- Table 24: Global Powered Surgical Instrument Market Revenue Million Forecast, by Country 2019 & 2032
- Table 25: GCC Powered Surgical Instrument Market Revenue (Million) Forecast, by Application 2019 & 2032
- Table 26: South Africa Powered Surgical Instrument Market Revenue (Million) Forecast, by Application 2019 & 2032
- Table 27: Rest of Middle East and Africa Powered Surgical Instrument Market Revenue (Million) Forecast, by Application 2019 & 2032
- Table 28: Global Powered Surgical Instrument Market Revenue Million Forecast, by Country 2019 & 2032
- Table 29: Brazil Powered Surgical Instrument Market Revenue (Million) Forecast, by Application 2019 & 2032
- Table 30: Argentina Powered Surgical Instrument Market Revenue (Million) Forecast, by Application 2019 & 2032
- Table 31: Rest of South America Powered Surgical Instrument Market Revenue (Million) Forecast, by Application 2019 & 2032
- Table 32: Global Powered Surgical Instrument Market Revenue Million Forecast, by Power Source 2019 & 2032
- Table 33: Global Powered Surgical Instrument Market Revenue Million Forecast, by Product Type 2019 & 2032
- Table 34: Global Powered Surgical Instrument Market Revenue Million Forecast, by Application 2019 & 2032
- Table 35: Global Powered Surgical Instrument Market Revenue Million Forecast, by Country 2019 & 2032
- Table 36: United States Powered Surgical Instrument Market Revenue (Million) Forecast, by Application 2019 & 2032
- Table 37: Canada Powered Surgical Instrument Market Revenue (Million) Forecast, by Application 2019 & 2032
- Table 38: Mexico Powered Surgical Instrument Market Revenue (Million) Forecast, by Application 2019 & 2032
- Table 39: Global Powered Surgical Instrument Market Revenue Million Forecast, by Power Source 2019 & 2032
- Table 40: Global Powered Surgical Instrument Market Revenue Million Forecast, by Product Type 2019 & 2032
- Table 41: Global Powered Surgical Instrument Market Revenue Million Forecast, by Application 2019 & 2032
- Table 42: Global Powered Surgical Instrument Market Revenue Million Forecast, by Country 2019 & 2032
- Table 43: Germany Powered Surgical Instrument Market Revenue (Million) Forecast, by Application 2019 & 2032
- Table 44: United Kingdom Powered Surgical Instrument Market Revenue (Million) Forecast, by Application 2019 & 2032
- Table 45: France Powered Surgical Instrument Market Revenue (Million) Forecast, by Application 2019 & 2032
- Table 46: Italy Powered Surgical Instrument Market Revenue (Million) Forecast, by Application 2019 & 2032
- Table 47: Spain Powered Surgical Instrument Market Revenue (Million) Forecast, by Application 2019 & 2032
- Table 48: Rest of Europe Powered Surgical Instrument Market Revenue (Million) Forecast, by Application 2019 & 2032
- Table 49: Global Powered Surgical Instrument Market Revenue Million Forecast, by Power Source 2019 & 2032
- Table 50: Global Powered Surgical Instrument Market Revenue Million Forecast, by Product Type 2019 & 2032
- Table 51: Global Powered Surgical Instrument Market Revenue Million Forecast, by Application 2019 & 2032
- Table 52: Global Powered Surgical Instrument Market Revenue Million Forecast, by Country 2019 & 2032
- Table 53: China Powered Surgical Instrument Market Revenue (Million) Forecast, by Application 2019 & 2032
- Table 54: Japan Powered Surgical Instrument Market Revenue (Million) Forecast, by Application 2019 & 2032
- Table 55: India Powered Surgical Instrument Market Revenue (Million) Forecast, by Application 2019 & 2032
- Table 56: Australia Powered Surgical Instrument Market Revenue (Million) Forecast, by Application 2019 & 2032
- Table 57: South Korea Powered Surgical Instrument Market Revenue (Million) Forecast, by Application 2019 & 2032
- Table 58: Rest of Asia Pacific Powered Surgical Instrument Market Revenue (Million) Forecast, by Application 2019 & 2032
- Table 59: Global Powered Surgical Instrument Market Revenue Million Forecast, by Power Source 2019 & 2032
- Table 60: Global Powered Surgical Instrument Market Revenue Million Forecast, by Product Type 2019 & 2032
- Table 61: Global Powered Surgical Instrument Market Revenue Million Forecast, by Application 2019 & 2032
- Table 62: Global Powered Surgical Instrument Market Revenue Million Forecast, by Country 2019 & 2032
- Table 63: GCC Powered Surgical Instrument Market Revenue (Million) Forecast, by Application 2019 & 2032
- Table 64: South Africa Powered Surgical Instrument Market Revenue (Million) Forecast, by Application 2019 & 2032
- Table 65: Rest of Middle East and Africa Powered Surgical Instrument Market Revenue (Million) Forecast, by Application 2019 & 2032
- Table 66: Global Powered Surgical Instrument Market Revenue Million Forecast, by Power Source 2019 & 2032
- Table 67: Global Powered Surgical Instrument Market Revenue Million Forecast, by Product Type 2019 & 2032
- Table 68: Global Powered Surgical Instrument Market Revenue Million Forecast, by Application 2019 & 2032
- Table 69: Global Powered Surgical Instrument Market Revenue Million Forecast, by Country 2019 & 2032
- Table 70: Brazil Powered Surgical Instrument Market Revenue (Million) Forecast, by Application 2019 & 2032
- Table 71: Argentina Powered Surgical Instrument Market Revenue (Million) Forecast, by Application 2019 & 2032
- Table 72: Rest of South America Powered Surgical Instrument Market Revenue (Million) Forecast, by Application 2019 & 2032
Frequently Asked Questions
1. What is the projected Compound Annual Growth Rate (CAGR) of the Powered Surgical Instrument Market?
The projected CAGR is approximately 4.06%.
2. Which companies are prominent players in the Powered Surgical Instrument Market?
Key companies in the market include Adeor Medical AG, AlloTech Co Ltd*List Not Exhaustive, Smith & Nephew, Panther Healthcare, ConMed, MicroAire Surgical Instruments, B Braun Melsungen Ag, Medtronic PLC, Desoutter Medical Ltd, Johnson & Johnson, Stryker Corporation, Zimmer Biomet.
3. What are the main segments of the Powered Surgical Instrument Market?
The market segments include Power Source, Product Type, Application.
4. Can you provide details about the market size?
The market size is estimated to be USD 2.19 Million as of 2022.
5. What are some drivers contributing to market growth?
Increasing Number of Surgical Procedures; Increasing Geriatric Population and Rising Lifestyle Disease Burden; Technological Innovations.
6. What are the notable trends driving market growth?
The Orthopedic Surgery Segment is Expected to Have a Notable Growth Rate.
7. Are there any restraints impacting market growth?
Reimbursement Challenges; Inadequate Skilled Professionals; Lack of Sterilization Procedure.
8. Can you provide examples of recent developments in the market?
September 2022: Teleflex Incorporated announced that it completed the previously announced acquisition of Standard Bariatrics, Inc., which has commercialized an innovative powered stapling technology for bariatric surgery.
9. What pricing options are available for accessing the report?
Pricing options include single-user, multi-user, and enterprise licenses priced at USD 4750, USD 5250, and USD 8750 respectively.
10. Is the market size provided in terms of value or volume?
The market size is provided in terms of value, measured in Million.
11. Are there any specific market keywords associated with the report?
Yes, the market keyword associated with the report is "Powered Surgical Instrument Market," which aids in identifying and referencing the specific market segment covered.
12. How do I determine which pricing option suits my needs best?
The pricing options vary based on user requirements and access needs. Individual users may opt for single-user licenses, while businesses requiring broader access may choose multi-user or enterprise licenses for cost-effective access to the report.
13. Are there any additional resources or data provided in the Powered Surgical Instrument Market report?
While the report offers comprehensive insights, it's advisable to review the specific contents or supplementary materials provided to ascertain if additional resources or data are available.
14. How can I stay updated on further developments or reports in the Powered Surgical Instrument Market?
To stay informed about further developments, trends, and reports in the Powered Surgical Instrument Market, consider subscribing to industry newsletters, following relevant companies and organizations, or regularly checking reputable industry news sources and publications.
Methodology
Step 1 - Identification of Relevant Samples Size from Population Database


Step 2 - Approaches for Defining Global Market Size (Value, Volume* & Price*)

Note*: In applicable scenarios
Step 3 - Data Sources
Primary Research
- Web Analytics
- Survey Reports
- Research Institute
- Latest Research Reports
- Opinion Leaders
Secondary Research
- Annual Reports
- White Paper
- Latest Press Release
- Industry Association
- Paid Database
- Investor Presentations

Step 4 - Data Triangulation
Involves using different sources of information in order to increase the validity of a study
These sources are likely to be stakeholders in a program - participants, other researchers, program staff, other community members, and so on.
Then we put all data in single framework & apply various statistical tools to find out the dynamic on the market.
During the analysis stage, feedback from the stakeholder groups would be compared to determine areas of agreement as well as areas of divergence


