
Key Insights
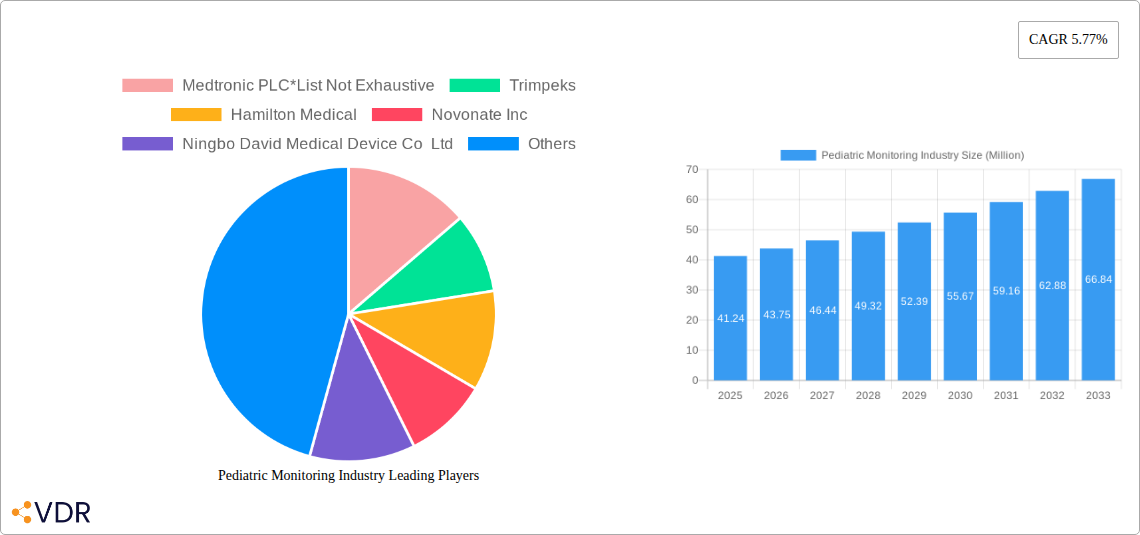
The pediatric monitoring market, valued at $41.24 million in 2025, is projected to experience robust growth, driven by several key factors. Increasing prevalence of premature births and low birth weight infants necessitates advanced monitoring technologies to ensure optimal healthcare outcomes. Technological advancements, such as the development of smaller, more portable, and wireless monitoring devices, enhance patient comfort and streamline workflow in healthcare settings. Furthermore, rising healthcare expenditure and improved healthcare infrastructure, particularly in developing economies, contribute significantly to market expansion. The increasing adoption of telemedicine and remote patient monitoring solutions is also expected to fuel market growth, providing continuous monitoring capabilities even outside of hospital environments. Stringent regulatory frameworks for medical devices and the high cost associated with sophisticated monitoring equipment are likely to pose challenges to market growth in certain regions.
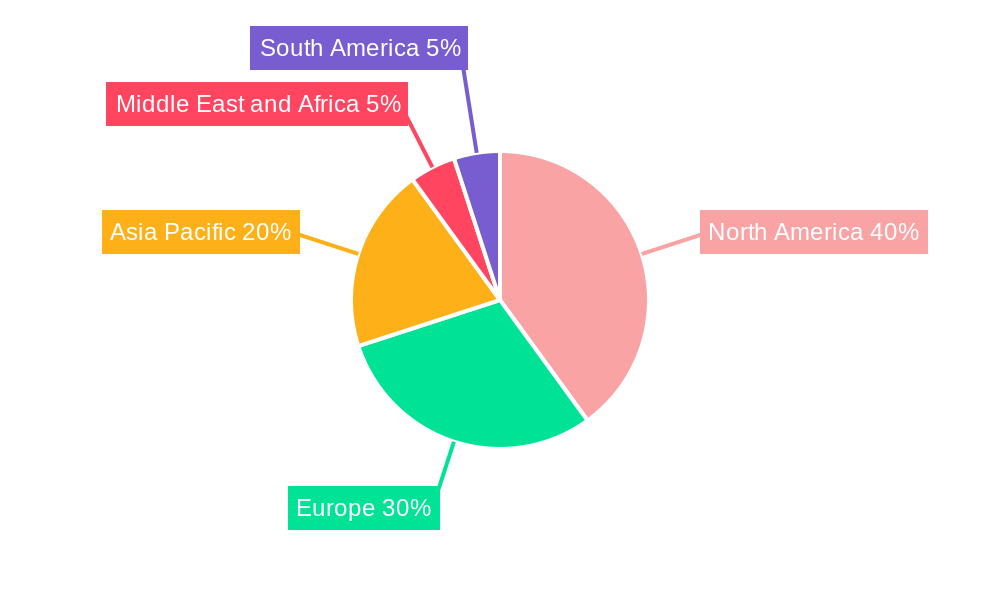
Market segmentation reveals a diverse landscape. Within product categories, neonatal ICU devices are likely to hold a dominant share, given the specialized monitoring needs of this vulnerable population. Cardiology and anesthesia & respiratory care devices are also significant segments. Hospitals are the primary end-users, accounting for a substantial market share due to their extensive infrastructure and patient volume. However, the increasing preference for outpatient and home-based care is likely to expand the market share of pediatric clinics and other end-users in the coming years. Geographically, North America and Europe currently dominate the market due to advanced healthcare infrastructure and high adoption rates. However, Asia-Pacific is anticipated to witness the fastest growth in the coming years, fueled by rising disposable incomes, improving healthcare facilities, and a large pediatric population. Competition is intense, with established players like Medtronic and Abbott alongside emerging companies like Novonate and Phoenix Medical Systems vying for market share through innovation and strategic partnerships.
Pediatric Monitoring Industry Market Report: 2019-2033
This comprehensive report provides a detailed analysis of the Pediatric Monitoring industry, encompassing market dynamics, growth trends, competitive landscape, and future outlook. The report covers the parent market (medical device industry) and the child market (pediatric healthcare), offering invaluable insights for industry professionals, investors, and stakeholders. The study period spans from 2019 to 2033, with 2025 as the base and estimated year.
Pediatric Monitoring Industry Market Dynamics & Structure
The pediatric monitoring market is characterized by moderate concentration, with key players such as Medtronic PLC, GE Healthcare, and Abbott holding significant market share. However, the market also features several smaller, specialized companies, fostering innovation and competition. Technological advancements, particularly in remote monitoring and AI-driven diagnostics, are key drivers. Stringent regulatory frameworks, particularly concerning safety and efficacy, pose challenges but also ensure high-quality standards. The market experiences continuous innovation, with new devices and technologies constantly emerging. Substitutes include traditional methods of observation, but these are progressively being replaced by advanced monitoring systems due to improved accuracy and efficiency. The end-user demographic is primarily hospitals and pediatric clinics, with growth potential in diagnostic laboratories and home-based care settings. M&A activity is moderate; xx major deals were recorded between 2019-2024, primarily focused on expanding product portfolios and geographic reach.
- Market Concentration: Moderately concentrated, with top 5 players holding approximately xx% market share.
- Technological Innovation: Driven by AI, remote monitoring, and miniaturization.
- Regulatory Framework: Stringent FDA and other regional regulations.
- Competitive Substitutes: Traditional observation methods, gradually being replaced.
- End-User Demographics: Hospitals (xx Million units), Pediatric Clinics (xx Million units), Diagnostic Laboratories (xx Million units), Others (xx Million units).
- M&A Trends: xx major deals between 2019-2024, focusing on expansion.
Pediatric Monitoring Industry Growth Trends & Insights
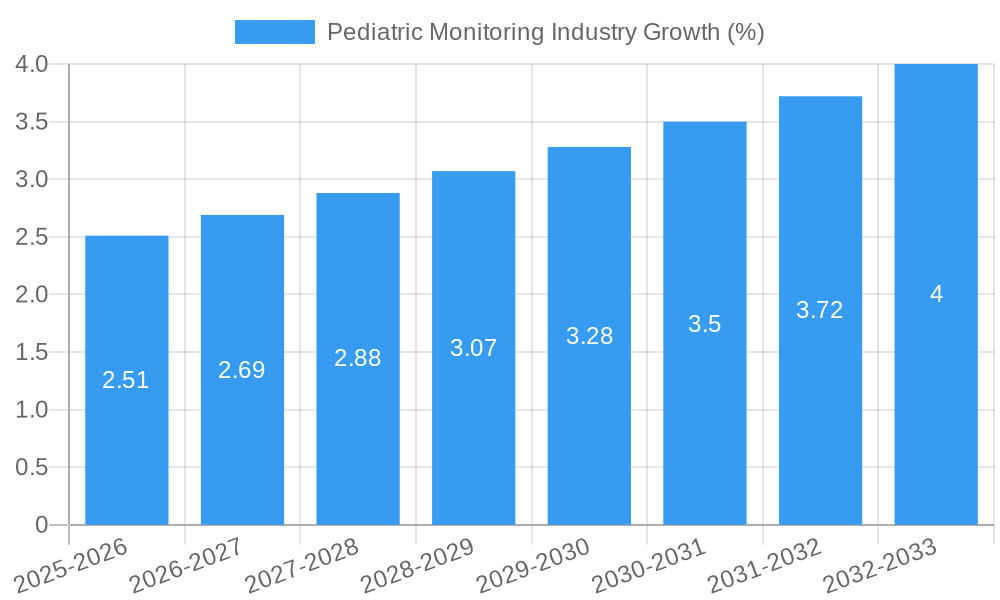
The pediatric monitoring market exhibits robust growth, driven by increasing prevalence of chronic diseases in children, technological advancements enabling earlier diagnosis and better patient outcomes, rising healthcare expenditure, and growing awareness of the importance of continuous patient monitoring. The market size, valued at xx Million units in 2025, is projected to reach xx Million units by 2033, exhibiting a CAGR of xx% during the forecast period. This growth is fueled by the increasing adoption of advanced monitoring technologies in hospitals and clinics, as well as the emergence of home-based monitoring solutions. Technological disruptions, such as the integration of AI and IoT, are accelerating market growth and changing consumer behavior by enabling remote monitoring and proactive care. The market penetration rate is expected to increase from xx% in 2025 to xx% in 2033.
Dominant Regions, Countries, or Segments in Pediatric Monitoring Industry
North America currently dominates the pediatric monitoring market, driven by high healthcare expenditure, robust regulatory frameworks supporting innovation, and advanced healthcare infrastructure. Within product segments, Neonatal ICU Devices and Cardiology Devices represent the largest shares, reflecting the high prevalence of associated conditions in pediatric populations. Hospitals are the primary end-users, due to their capacity for advanced care. However, the fastest growth is anticipated in the Asia-Pacific region due to rising disposable incomes, increased healthcare spending and improving healthcare infrastructure.
- Key Drivers (North America): Advanced healthcare infrastructure, high healthcare expenditure, robust regulatory frameworks.
- Key Drivers (Asia-Pacific): Rising disposable income, increased healthcare spending, improving healthcare infrastructure.
- Dominant Product Segment: Neonatal ICU Devices (xx Million units) and Cardiology Devices (xx Million units).
- Dominant End-User Segment: Hospitals (xx Million units).
Pediatric Monitoring Industry Product Landscape
The pediatric monitoring product landscape is characterized by a diverse range of devices, including advanced non-invasive monitoring systems, wearable sensors, and integrated platforms providing real-time data and alerts. These devices offer unique selling propositions such as smaller size, improved accuracy, wireless connectivity, and ease of use. Continuous technological advancements focus on enhanced data analytics, improved patient comfort, and greater integration with Electronic Health Records (EHR) systems. Specific examples include miniaturized ECG monitors, wearable respiratory rate sensors, and advanced EEG systems designed specifically for pediatric use.
Key Drivers, Barriers & Challenges in Pediatric Monitoring Industry
Key Drivers:
- Increasing prevalence of chronic diseases in children.
- Technological advancements leading to earlier diagnosis and improved outcomes.
- Rising healthcare expenditure globally.
- Growing awareness about continuous monitoring benefits.
Key Challenges:
- High cost of advanced monitoring systems, limiting accessibility.
- Stringent regulatory hurdles, prolonging product development cycles.
- Data security and privacy concerns related to remote monitoring.
- Competition from established players and new entrants.
Emerging Opportunities in Pediatric Monitoring Industry
- Growth of home-based monitoring solutions.
- Integration of AI and machine learning for predictive analytics.
- Expansion into emerging markets.
- Development of specialized monitoring devices for specific pediatric conditions.
Growth Accelerators in the Pediatric Monitoring Industry
Technological breakthroughs, such as improved sensor technology and AI-driven diagnostics, are significant growth accelerators. Strategic partnerships between device manufacturers, healthcare providers, and technology companies are also driving market expansion. Government initiatives promoting telemedicine and remote patient monitoring are further propelling market growth.
Key Players Shaping the Pediatric Monitoring Industry Market
- Medtronic PLC
- Trimpeks
- Hamilton Medical
- Novonate Inc
- Ningbo David Medical Device Co Ltd
- GE Healthcare
- Atom Medical Corporation
- Elektro-Mag
- Fritz Stephan GmbH
- Abbott
- Phoenix Medical Systems Pvt Ltd
- TSE MEDICAL
Notable Milestones in Pediatric Monitoring Industry Sector
- February 2022: Masimo receives FDA clearance for its SedLine monitoring and SedLine pediatric EEG sensor. This significantly expands the availability of advanced brain monitoring solutions for pediatric patients.
- January 2022: Good Parents raises USD 16 million in Series A funding. This highlights the increasing investment in remote pediatric patient monitoring platforms, expanding market reach and accessibility.
In-Depth Pediatric Monitoring Industry Market Outlook
The pediatric monitoring market is poised for significant growth, driven by continuous technological innovation, increasing adoption of remote monitoring solutions, and rising healthcare expenditure. Strategic partnerships and expansion into emerging markets will further fuel market growth. The market presents significant opportunities for companies offering innovative, cost-effective, and user-friendly solutions. The integration of AI and machine learning will play a crucial role in enhancing the accuracy and efficiency of pediatric monitoring systems in the coming years.
Pediatric Monitoring Industry Segmentation
-
1. Product
- 1.1. IVD Devices
- 1.2. Cardiology Devices
- 1.3. Anesthesia & Respiratory Care Devices
- 1.4. Neonatal ICU Devices
- 1.5. Monitoring Devices
- 1.6. Others
-
2. End-User
- 2.1. Hospitals
- 2.2. Diagnostic Laboratories
- 2.3. Pediatric Clinics
- 2.4. Others
Pediatric Monitoring Industry Segmentation By Geography
-
1. North America
- 1.1. United States
- 1.2. Canada
- 1.3. Mexico
-
2. Europe
- 2.1. Germany
- 2.2. United Kingdom
- 2.3. France
- 2.4. Italy
- 2.5. Spain
- 2.6. Rest of Europe
-
3. Asia Pacific
- 3.1. China
- 3.2. Japan
- 3.3. India
- 3.4. Australia
- 3.5. South Korea
- 3.6. Rest of Asia Pacific
-
4. Middle East and Africa
- 4.1. GCC
- 4.2. South Africa
- 4.3. Rest of Middle East and Africa
-
5. South America
- 5.1. Brazil
- 5.2. Argentina
- 5.3. Rest of South America
Pediatric Monitoring Industry REPORT HIGHLIGHTS
| Aspects | Details |
|---|---|
| Study Period | 2019-2033 |
| Base Year | 2024 |
| Estimated Year | 2025 |
| Forecast Period | 2025-2033 |
| Historical Period | 2019-2024 |
| Growth Rate | CAGR of 5.77% from 2019-2033 |
| Segmentation |
|
Table of Contents
- 1. Introduction
- 1.1. Research Scope
- 1.2. Market Segmentation
- 1.3. Research Methodology
- 1.4. Definitions and Assumptions
- 2. Executive Summary
- 2.1. Introduction
- 3. Market Dynamics
- 3.1. Introduction
- 3.2. Market Drivers
- 3.2.1. Increasing Prevalence of Infectious Diseases among the Pediatric Population; Development of Health Care Infrastructure for Pediatric Health Issues
- 3.3. Market Restrains
- 3.3.1. Challenges to Pediatric Device Development and Low Addressable Market
- 3.4. Market Trends
- 3.4.1. Neonatal ICU Devices Segment is Expected to Show Significant Growth Over the Forecast Period
- 4. Market Factor Analysis
- 4.1. Porters Five Forces
- 4.2. Supply/Value Chain
- 4.3. PESTEL analysis
- 4.4. Market Entropy
- 4.5. Patent/Trademark Analysis
- 5. Global Pediatric Monitoring Industry Analysis, Insights and Forecast, 2019-2031
- 5.1. Market Analysis, Insights and Forecast - by Product
- 5.1.1. IVD Devices
- 5.1.2. Cardiology Devices
- 5.1.3. Anesthesia & Respiratory Care Devices
- 5.1.4. Neonatal ICU Devices
- 5.1.5. Monitoring Devices
- 5.1.6. Others
- 5.2. Market Analysis, Insights and Forecast - by End-User
- 5.2.1. Hospitals
- 5.2.2. Diagnostic Laboratories
- 5.2.3. Pediatric Clinics
- 5.2.4. Others
- 5.3. Market Analysis, Insights and Forecast - by Region
- 5.3.1. North America
- 5.3.2. Europe
- 5.3.3. Asia Pacific
- 5.3.4. Middle East and Africa
- 5.3.5. South America
- 5.1. Market Analysis, Insights and Forecast - by Product
- 6. North America Pediatric Monitoring Industry Analysis, Insights and Forecast, 2019-2031
- 6.1. Market Analysis, Insights and Forecast - by Product
- 6.1.1. IVD Devices
- 6.1.2. Cardiology Devices
- 6.1.3. Anesthesia & Respiratory Care Devices
- 6.1.4. Neonatal ICU Devices
- 6.1.5. Monitoring Devices
- 6.1.6. Others
- 6.2. Market Analysis, Insights and Forecast - by End-User
- 6.2.1. Hospitals
- 6.2.2. Diagnostic Laboratories
- 6.2.3. Pediatric Clinics
- 6.2.4. Others
- 6.1. Market Analysis, Insights and Forecast - by Product
- 7. Europe Pediatric Monitoring Industry Analysis, Insights and Forecast, 2019-2031
- 7.1. Market Analysis, Insights and Forecast - by Product
- 7.1.1. IVD Devices
- 7.1.2. Cardiology Devices
- 7.1.3. Anesthesia & Respiratory Care Devices
- 7.1.4. Neonatal ICU Devices
- 7.1.5. Monitoring Devices
- 7.1.6. Others
- 7.2. Market Analysis, Insights and Forecast - by End-User
- 7.2.1. Hospitals
- 7.2.2. Diagnostic Laboratories
- 7.2.3. Pediatric Clinics
- 7.2.4. Others
- 7.1. Market Analysis, Insights and Forecast - by Product
- 8. Asia Pacific Pediatric Monitoring Industry Analysis, Insights and Forecast, 2019-2031
- 8.1. Market Analysis, Insights and Forecast - by Product
- 8.1.1. IVD Devices
- 8.1.2. Cardiology Devices
- 8.1.3. Anesthesia & Respiratory Care Devices
- 8.1.4. Neonatal ICU Devices
- 8.1.5. Monitoring Devices
- 8.1.6. Others
- 8.2. Market Analysis, Insights and Forecast - by End-User
- 8.2.1. Hospitals
- 8.2.2. Diagnostic Laboratories
- 8.2.3. Pediatric Clinics
- 8.2.4. Others
- 8.1. Market Analysis, Insights and Forecast - by Product
- 9. Middle East and Africa Pediatric Monitoring Industry Analysis, Insights and Forecast, 2019-2031
- 9.1. Market Analysis, Insights and Forecast - by Product
- 9.1.1. IVD Devices
- 9.1.2. Cardiology Devices
- 9.1.3. Anesthesia & Respiratory Care Devices
- 9.1.4. Neonatal ICU Devices
- 9.1.5. Monitoring Devices
- 9.1.6. Others
- 9.2. Market Analysis, Insights and Forecast - by End-User
- 9.2.1. Hospitals
- 9.2.2. Diagnostic Laboratories
- 9.2.3. Pediatric Clinics
- 9.2.4. Others
- 9.1. Market Analysis, Insights and Forecast - by Product
- 10. South America Pediatric Monitoring Industry Analysis, Insights and Forecast, 2019-2031
- 10.1. Market Analysis, Insights and Forecast - by Product
- 10.1.1. IVD Devices
- 10.1.2. Cardiology Devices
- 10.1.3. Anesthesia & Respiratory Care Devices
- 10.1.4. Neonatal ICU Devices
- 10.1.5. Monitoring Devices
- 10.1.6. Others
- 10.2. Market Analysis, Insights and Forecast - by End-User
- 10.2.1. Hospitals
- 10.2.2. Diagnostic Laboratories
- 10.2.3. Pediatric Clinics
- 10.2.4. Others
- 10.1. Market Analysis, Insights and Forecast - by Product
- 11. North America Pediatric Monitoring Industry Analysis, Insights and Forecast, 2019-2031
- 11.1. Market Analysis, Insights and Forecast - By Country/Sub-region
- 11.1.1 United States
- 11.1.2 Canada
- 11.1.3 Mexico
- 12. Europe Pediatric Monitoring Industry Analysis, Insights and Forecast, 2019-2031
- 12.1. Market Analysis, Insights and Forecast - By Country/Sub-region
- 12.1.1 Germany
- 12.1.2 United Kingdom
- 12.1.3 France
- 12.1.4 Italy
- 12.1.5 Spain
- 12.1.6 Rest of Europe
- 13. Asia Pacific Pediatric Monitoring Industry Analysis, Insights and Forecast, 2019-2031
- 13.1. Market Analysis, Insights and Forecast - By Country/Sub-region
- 13.1.1 China
- 13.1.2 Japan
- 13.1.3 India
- 13.1.4 Australia
- 13.1.5 South Korea
- 13.1.6 Rest of Asia Pacific
- 14. Middle East and Africa Pediatric Monitoring Industry Analysis, Insights and Forecast, 2019-2031
- 14.1. Market Analysis, Insights and Forecast - By Country/Sub-region
- 14.1.1 GCC
- 14.1.2 South Africa
- 14.1.3 Rest of Middle East and Africa
- 15. South America Pediatric Monitoring Industry Analysis, Insights and Forecast, 2019-2031
- 15.1. Market Analysis, Insights and Forecast - By Country/Sub-region
- 15.1.1 Brazil
- 15.1.2 Argentina
- 15.1.3 Rest of South America
- 16. Competitive Analysis
- 16.1. Global Market Share Analysis 2024
- 16.2. Company Profiles
- 16.2.1 Medtronic PLC*List Not Exhaustive
- 16.2.1.1. Overview
- 16.2.1.2. Products
- 16.2.1.3. SWOT Analysis
- 16.2.1.4. Recent Developments
- 16.2.1.5. Financials (Based on Availability)
- 16.2.2 Trimpeks
- 16.2.2.1. Overview
- 16.2.2.2. Products
- 16.2.2.3. SWOT Analysis
- 16.2.2.4. Recent Developments
- 16.2.2.5. Financials (Based on Availability)
- 16.2.3 Hamilton Medical
- 16.2.3.1. Overview
- 16.2.3.2. Products
- 16.2.3.3. SWOT Analysis
- 16.2.3.4. Recent Developments
- 16.2.3.5. Financials (Based on Availability)
- 16.2.4 Novonate Inc
- 16.2.4.1. Overview
- 16.2.4.2. Products
- 16.2.4.3. SWOT Analysis
- 16.2.4.4. Recent Developments
- 16.2.4.5. Financials (Based on Availability)
- 16.2.5 Ningbo David Medical Device Co Ltd
- 16.2.5.1. Overview
- 16.2.5.2. Products
- 16.2.5.3. SWOT Analysis
- 16.2.5.4. Recent Developments
- 16.2.5.5. Financials (Based on Availability)
- 16.2.6 GE Healthcare
- 16.2.6.1. Overview
- 16.2.6.2. Products
- 16.2.6.3. SWOT Analysis
- 16.2.6.4. Recent Developments
- 16.2.6.5. Financials (Based on Availability)
- 16.2.7 Atom Medical Corporation
- 16.2.7.1. Overview
- 16.2.7.2. Products
- 16.2.7.3. SWOT Analysis
- 16.2.7.4. Recent Developments
- 16.2.7.5. Financials (Based on Availability)
- 16.2.8 Elektro-Mag
- 16.2.8.1. Overview
- 16.2.8.2. Products
- 16.2.8.3. SWOT Analysis
- 16.2.8.4. Recent Developments
- 16.2.8.5. Financials (Based on Availability)
- 16.2.9 Fritz Stephan GmbH
- 16.2.9.1. Overview
- 16.2.9.2. Products
- 16.2.9.3. SWOT Analysis
- 16.2.9.4. Recent Developments
- 16.2.9.5. Financials (Based on Availability)
- 16.2.10 Abbott
- 16.2.10.1. Overview
- 16.2.10.2. Products
- 16.2.10.3. SWOT Analysis
- 16.2.10.4. Recent Developments
- 16.2.10.5. Financials (Based on Availability)
- 16.2.11 Phoenix Medical Systems Pvt Ltd
- 16.2.11.1. Overview
- 16.2.11.2. Products
- 16.2.11.3. SWOT Analysis
- 16.2.11.4. Recent Developments
- 16.2.11.5. Financials (Based on Availability)
- 16.2.12 TSE MEDICAL
- 16.2.12.1. Overview
- 16.2.12.2. Products
- 16.2.12.3. SWOT Analysis
- 16.2.12.4. Recent Developments
- 16.2.12.5. Financials (Based on Availability)
- 16.2.1 Medtronic PLC*List Not Exhaustive
List of Figures
- Figure 1: Global Pediatric Monitoring Industry Revenue Breakdown (Million, %) by Region 2024 & 2032
- Figure 2: North America Pediatric Monitoring Industry Revenue (Million), by Country 2024 & 2032
- Figure 3: North America Pediatric Monitoring Industry Revenue Share (%), by Country 2024 & 2032
- Figure 4: Europe Pediatric Monitoring Industry Revenue (Million), by Country 2024 & 2032
- Figure 5: Europe Pediatric Monitoring Industry Revenue Share (%), by Country 2024 & 2032
- Figure 6: Asia Pacific Pediatric Monitoring Industry Revenue (Million), by Country 2024 & 2032
- Figure 7: Asia Pacific Pediatric Monitoring Industry Revenue Share (%), by Country 2024 & 2032
- Figure 8: Middle East and Africa Pediatric Monitoring Industry Revenue (Million), by Country 2024 & 2032
- Figure 9: Middle East and Africa Pediatric Monitoring Industry Revenue Share (%), by Country 2024 & 2032
- Figure 10: South America Pediatric Monitoring Industry Revenue (Million), by Country 2024 & 2032
- Figure 11: South America Pediatric Monitoring Industry Revenue Share (%), by Country 2024 & 2032
- Figure 12: North America Pediatric Monitoring Industry Revenue (Million), by Product 2024 & 2032
- Figure 13: North America Pediatric Monitoring Industry Revenue Share (%), by Product 2024 & 2032
- Figure 14: North America Pediatric Monitoring Industry Revenue (Million), by End-User 2024 & 2032
- Figure 15: North America Pediatric Monitoring Industry Revenue Share (%), by End-User 2024 & 2032
- Figure 16: North America Pediatric Monitoring Industry Revenue (Million), by Country 2024 & 2032
- Figure 17: North America Pediatric Monitoring Industry Revenue Share (%), by Country 2024 & 2032
- Figure 18: Europe Pediatric Monitoring Industry Revenue (Million), by Product 2024 & 2032
- Figure 19: Europe Pediatric Monitoring Industry Revenue Share (%), by Product 2024 & 2032
- Figure 20: Europe Pediatric Monitoring Industry Revenue (Million), by End-User 2024 & 2032
- Figure 21: Europe Pediatric Monitoring Industry Revenue Share (%), by End-User 2024 & 2032
- Figure 22: Europe Pediatric Monitoring Industry Revenue (Million), by Country 2024 & 2032
- Figure 23: Europe Pediatric Monitoring Industry Revenue Share (%), by Country 2024 & 2032
- Figure 24: Asia Pacific Pediatric Monitoring Industry Revenue (Million), by Product 2024 & 2032
- Figure 25: Asia Pacific Pediatric Monitoring Industry Revenue Share (%), by Product 2024 & 2032
- Figure 26: Asia Pacific Pediatric Monitoring Industry Revenue (Million), by End-User 2024 & 2032
- Figure 27: Asia Pacific Pediatric Monitoring Industry Revenue Share (%), by End-User 2024 & 2032
- Figure 28: Asia Pacific Pediatric Monitoring Industry Revenue (Million), by Country 2024 & 2032
- Figure 29: Asia Pacific Pediatric Monitoring Industry Revenue Share (%), by Country 2024 & 2032
- Figure 30: Middle East and Africa Pediatric Monitoring Industry Revenue (Million), by Product 2024 & 2032
- Figure 31: Middle East and Africa Pediatric Monitoring Industry Revenue Share (%), by Product 2024 & 2032
- Figure 32: Middle East and Africa Pediatric Monitoring Industry Revenue (Million), by End-User 2024 & 2032
- Figure 33: Middle East and Africa Pediatric Monitoring Industry Revenue Share (%), by End-User 2024 & 2032
- Figure 34: Middle East and Africa Pediatric Monitoring Industry Revenue (Million), by Country 2024 & 2032
- Figure 35: Middle East and Africa Pediatric Monitoring Industry Revenue Share (%), by Country 2024 & 2032
- Figure 36: South America Pediatric Monitoring Industry Revenue (Million), by Product 2024 & 2032
- Figure 37: South America Pediatric Monitoring Industry Revenue Share (%), by Product 2024 & 2032
- Figure 38: South America Pediatric Monitoring Industry Revenue (Million), by End-User 2024 & 2032
- Figure 39: South America Pediatric Monitoring Industry Revenue Share (%), by End-User 2024 & 2032
- Figure 40: South America Pediatric Monitoring Industry Revenue (Million), by Country 2024 & 2032
- Figure 41: South America Pediatric Monitoring Industry Revenue Share (%), by Country 2024 & 2032
List of Tables
- Table 1: Global Pediatric Monitoring Industry Revenue Million Forecast, by Region 2019 & 2032
- Table 2: Global Pediatric Monitoring Industry Revenue Million Forecast, by Product 2019 & 2032
- Table 3: Global Pediatric Monitoring Industry Revenue Million Forecast, by End-User 2019 & 2032
- Table 4: Global Pediatric Monitoring Industry Revenue Million Forecast, by Region 2019 & 2032
- Table 5: Global Pediatric Monitoring Industry Revenue Million Forecast, by Country 2019 & 2032
- Table 6: United States Pediatric Monitoring Industry Revenue (Million) Forecast, by Application 2019 & 2032
- Table 7: Canada Pediatric Monitoring Industry Revenue (Million) Forecast, by Application 2019 & 2032
- Table 8: Mexico Pediatric Monitoring Industry Revenue (Million) Forecast, by Application 2019 & 2032
- Table 9: Global Pediatric Monitoring Industry Revenue Million Forecast, by Country 2019 & 2032
- Table 10: Germany Pediatric Monitoring Industry Revenue (Million) Forecast, by Application 2019 & 2032
- Table 11: United Kingdom Pediatric Monitoring Industry Revenue (Million) Forecast, by Application 2019 & 2032
- Table 12: France Pediatric Monitoring Industry Revenue (Million) Forecast, by Application 2019 & 2032
- Table 13: Italy Pediatric Monitoring Industry Revenue (Million) Forecast, by Application 2019 & 2032
- Table 14: Spain Pediatric Monitoring Industry Revenue (Million) Forecast, by Application 2019 & 2032
- Table 15: Rest of Europe Pediatric Monitoring Industry Revenue (Million) Forecast, by Application 2019 & 2032
- Table 16: Global Pediatric Monitoring Industry Revenue Million Forecast, by Country 2019 & 2032
- Table 17: China Pediatric Monitoring Industry Revenue (Million) Forecast, by Application 2019 & 2032
- Table 18: Japan Pediatric Monitoring Industry Revenue (Million) Forecast, by Application 2019 & 2032
- Table 19: India Pediatric Monitoring Industry Revenue (Million) Forecast, by Application 2019 & 2032
- Table 20: Australia Pediatric Monitoring Industry Revenue (Million) Forecast, by Application 2019 & 2032
- Table 21: South Korea Pediatric Monitoring Industry Revenue (Million) Forecast, by Application 2019 & 2032
- Table 22: Rest of Asia Pacific Pediatric Monitoring Industry Revenue (Million) Forecast, by Application 2019 & 2032
- Table 23: Global Pediatric Monitoring Industry Revenue Million Forecast, by Country 2019 & 2032
- Table 24: GCC Pediatric Monitoring Industry Revenue (Million) Forecast, by Application 2019 & 2032
- Table 25: South Africa Pediatric Monitoring Industry Revenue (Million) Forecast, by Application 2019 & 2032
- Table 26: Rest of Middle East and Africa Pediatric Monitoring Industry Revenue (Million) Forecast, by Application 2019 & 2032
- Table 27: Global Pediatric Monitoring Industry Revenue Million Forecast, by Country 2019 & 2032
- Table 28: Brazil Pediatric Monitoring Industry Revenue (Million) Forecast, by Application 2019 & 2032
- Table 29: Argentina Pediatric Monitoring Industry Revenue (Million) Forecast, by Application 2019 & 2032
- Table 30: Rest of South America Pediatric Monitoring Industry Revenue (Million) Forecast, by Application 2019 & 2032
- Table 31: Global Pediatric Monitoring Industry Revenue Million Forecast, by Product 2019 & 2032
- Table 32: Global Pediatric Monitoring Industry Revenue Million Forecast, by End-User 2019 & 2032
- Table 33: Global Pediatric Monitoring Industry Revenue Million Forecast, by Country 2019 & 2032
- Table 34: United States Pediatric Monitoring Industry Revenue (Million) Forecast, by Application 2019 & 2032
- Table 35: Canada Pediatric Monitoring Industry Revenue (Million) Forecast, by Application 2019 & 2032
- Table 36: Mexico Pediatric Monitoring Industry Revenue (Million) Forecast, by Application 2019 & 2032
- Table 37: Global Pediatric Monitoring Industry Revenue Million Forecast, by Product 2019 & 2032
- Table 38: Global Pediatric Monitoring Industry Revenue Million Forecast, by End-User 2019 & 2032
- Table 39: Global Pediatric Monitoring Industry Revenue Million Forecast, by Country 2019 & 2032
- Table 40: Germany Pediatric Monitoring Industry Revenue (Million) Forecast, by Application 2019 & 2032
- Table 41: United Kingdom Pediatric Monitoring Industry Revenue (Million) Forecast, by Application 2019 & 2032
- Table 42: France Pediatric Monitoring Industry Revenue (Million) Forecast, by Application 2019 & 2032
- Table 43: Italy Pediatric Monitoring Industry Revenue (Million) Forecast, by Application 2019 & 2032
- Table 44: Spain Pediatric Monitoring Industry Revenue (Million) Forecast, by Application 2019 & 2032
- Table 45: Rest of Europe Pediatric Monitoring Industry Revenue (Million) Forecast, by Application 2019 & 2032
- Table 46: Global Pediatric Monitoring Industry Revenue Million Forecast, by Product 2019 & 2032
- Table 47: Global Pediatric Monitoring Industry Revenue Million Forecast, by End-User 2019 & 2032
- Table 48: Global Pediatric Monitoring Industry Revenue Million Forecast, by Country 2019 & 2032
- Table 49: China Pediatric Monitoring Industry Revenue (Million) Forecast, by Application 2019 & 2032
- Table 50: Japan Pediatric Monitoring Industry Revenue (Million) Forecast, by Application 2019 & 2032
- Table 51: India Pediatric Monitoring Industry Revenue (Million) Forecast, by Application 2019 & 2032
- Table 52: Australia Pediatric Monitoring Industry Revenue (Million) Forecast, by Application 2019 & 2032
- Table 53: South Korea Pediatric Monitoring Industry Revenue (Million) Forecast, by Application 2019 & 2032
- Table 54: Rest of Asia Pacific Pediatric Monitoring Industry Revenue (Million) Forecast, by Application 2019 & 2032
- Table 55: Global Pediatric Monitoring Industry Revenue Million Forecast, by Product 2019 & 2032
- Table 56: Global Pediatric Monitoring Industry Revenue Million Forecast, by End-User 2019 & 2032
- Table 57: Global Pediatric Monitoring Industry Revenue Million Forecast, by Country 2019 & 2032
- Table 58: GCC Pediatric Monitoring Industry Revenue (Million) Forecast, by Application 2019 & 2032
- Table 59: South Africa Pediatric Monitoring Industry Revenue (Million) Forecast, by Application 2019 & 2032
- Table 60: Rest of Middle East and Africa Pediatric Monitoring Industry Revenue (Million) Forecast, by Application 2019 & 2032
- Table 61: Global Pediatric Monitoring Industry Revenue Million Forecast, by Product 2019 & 2032
- Table 62: Global Pediatric Monitoring Industry Revenue Million Forecast, by End-User 2019 & 2032
- Table 63: Global Pediatric Monitoring Industry Revenue Million Forecast, by Country 2019 & 2032
- Table 64: Brazil Pediatric Monitoring Industry Revenue (Million) Forecast, by Application 2019 & 2032
- Table 65: Argentina Pediatric Monitoring Industry Revenue (Million) Forecast, by Application 2019 & 2032
- Table 66: Rest of South America Pediatric Monitoring Industry Revenue (Million) Forecast, by Application 2019 & 2032
Frequently Asked Questions
1. What is the projected Compound Annual Growth Rate (CAGR) of the Pediatric Monitoring Industry?
The projected CAGR is approximately 5.77%.
2. Which companies are prominent players in the Pediatric Monitoring Industry?
Key companies in the market include Medtronic PLC*List Not Exhaustive, Trimpeks, Hamilton Medical, Novonate Inc, Ningbo David Medical Device Co Ltd, GE Healthcare, Atom Medical Corporation, Elektro-Mag, Fritz Stephan GmbH, Abbott, Phoenix Medical Systems Pvt Ltd, TSE MEDICAL.
3. What are the main segments of the Pediatric Monitoring Industry?
The market segments include Product, End-User.
4. Can you provide details about the market size?
The market size is estimated to be USD 41.24 Million as of 2022.
5. What are some drivers contributing to market growth?
Increasing Prevalence of Infectious Diseases among the Pediatric Population; Development of Health Care Infrastructure for Pediatric Health Issues.
6. What are the notable trends driving market growth?
Neonatal ICU Devices Segment is Expected to Show Significant Growth Over the Forecast Period.
7. Are there any restraints impacting market growth?
Challenges to Pediatric Device Development and Low Addressable Market.
8. Can you provide examples of recent developments in the market?
In February 2022, Masimo received United States Food and Drug Administration clearance for its SedLine monitoring and SedLine pediatric EEG sensor.
9. What pricing options are available for accessing the report?
Pricing options include single-user, multi-user, and enterprise licenses priced at USD 4750, USD 5250, and USD 8750 respectively.
10. Is the market size provided in terms of value or volume?
The market size is provided in terms of value, measured in Million.
11. Are there any specific market keywords associated with the report?
Yes, the market keyword associated with the report is "Pediatric Monitoring Industry," which aids in identifying and referencing the specific market segment covered.
12. How do I determine which pricing option suits my needs best?
The pricing options vary based on user requirements and access needs. Individual users may opt for single-user licenses, while businesses requiring broader access may choose multi-user or enterprise licenses for cost-effective access to the report.
13. Are there any additional resources or data provided in the Pediatric Monitoring Industry report?
While the report offers comprehensive insights, it's advisable to review the specific contents or supplementary materials provided to ascertain if additional resources or data are available.
14. How can I stay updated on further developments or reports in the Pediatric Monitoring Industry?
To stay informed about further developments, trends, and reports in the Pediatric Monitoring Industry, consider subscribing to industry newsletters, following relevant companies and organizations, or regularly checking reputable industry news sources and publications.
Methodology
Step 1 - Identification of Relevant Samples Size from Population Database


Step 2 - Approaches for Defining Global Market Size (Value, Volume* & Price*)

Note*: In applicable scenarios
Step 3 - Data Sources
Primary Research
- Web Analytics
- Survey Reports
- Research Institute
- Latest Research Reports
- Opinion Leaders
Secondary Research
- Annual Reports
- White Paper
- Latest Press Release
- Industry Association
- Paid Database
- Investor Presentations

Step 4 - Data Triangulation
Involves using different sources of information in order to increase the validity of a study
These sources are likely to be stakeholders in a program - participants, other researchers, program staff, other community members, and so on.
Then we put all data in single framework & apply various statistical tools to find out the dynamic on the market.
During the analysis stage, feedback from the stakeholder groups would be compared to determine areas of agreement as well as areas of divergence


