
Key Insights
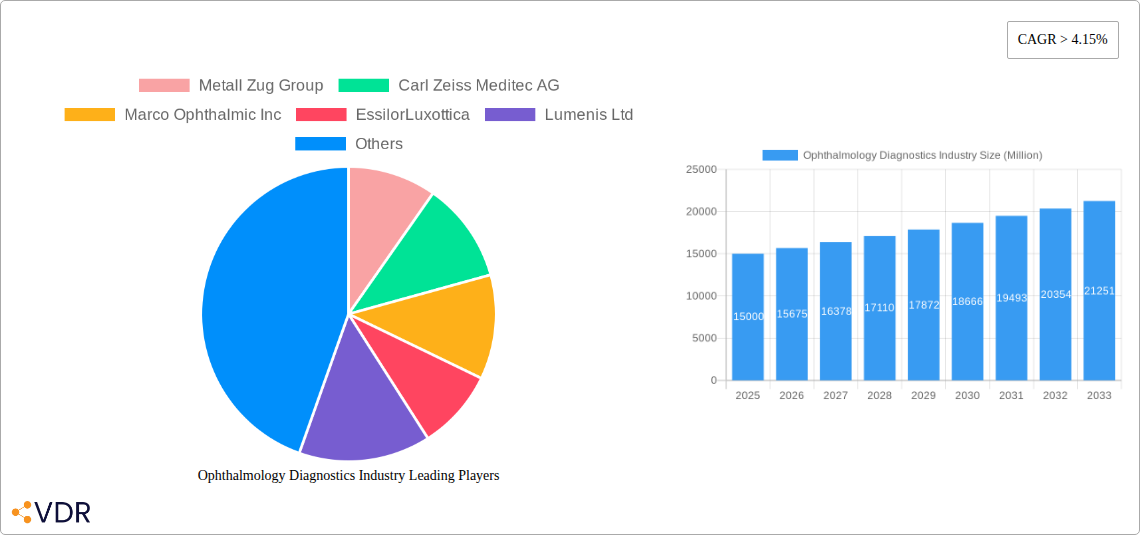
The global ophthalmology diagnostics market is experiencing robust growth, driven by a rising prevalence of age-related eye diseases like glaucoma and macular degeneration, coupled with an increasing geriatric population. Technological advancements, such as the development of advanced imaging techniques like Optical Coherence Tomography (OCT) and advancements in fundus cameras offering higher resolution and faster image acquisition, are significantly impacting market expansion. The market's segmentation reflects diverse diagnostic needs: corneal topographers for corneal mapping, fundus cameras for retinal imaging, ophthalmoscopes for basic eye examinations, OCT scanners for detailed retinal and nerve fiber layer analysis, and retinoscopes/refractors for refractive error assessment. Hospitals and specialty clinics are the primary end-users, but the market is also witnessing growth in smaller clinics and diagnostic centers, particularly in developing economies. The competitive landscape includes established players like Carl Zeiss Meditec AG, Alcon Inc., and Topcon Corporation, alongside smaller, specialized companies focusing on niche technologies. A CAGR exceeding 4.15% indicates sustained growth through 2033, propelled by factors such as increasing awareness of eye health, improved access to healthcare, and ongoing technological innovation leading to more accurate and efficient diagnostic tools.
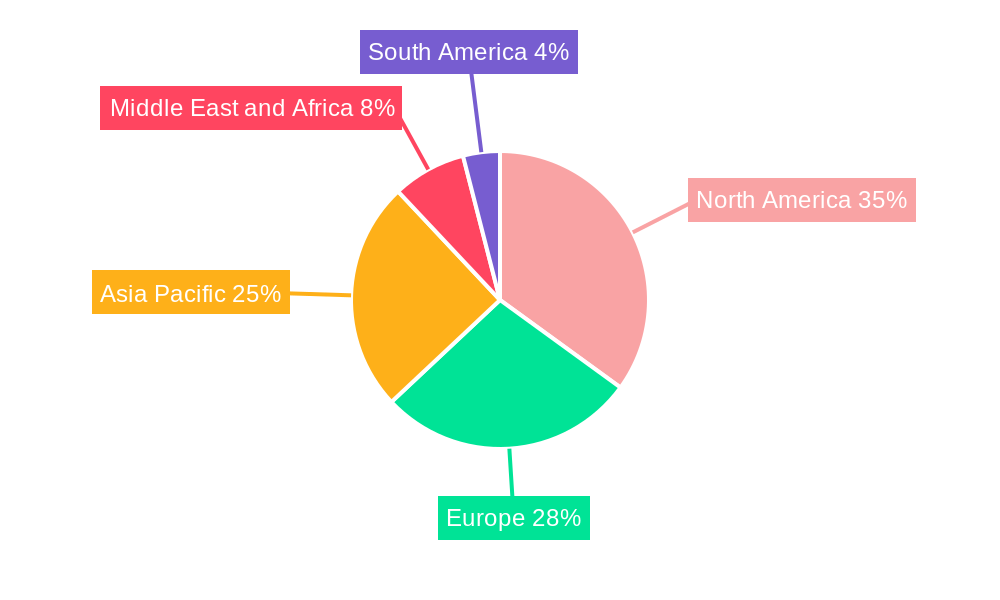
The market's regional distribution reflects varying healthcare infrastructure and economic conditions. North America and Europe currently hold significant market share due to advanced healthcare infrastructure and high adoption of advanced diagnostic technologies. However, the Asia-Pacific region exhibits considerable growth potential owing to rapid economic growth, a burgeoning middle class with increased disposable income, and rising prevalence of eye diseases. The Middle East and Africa, and South America also present opportunities, though market penetration may lag due to factors such as limited access to healthcare and lower per capita income. Future growth will likely be fueled by the introduction of AI-powered diagnostic tools, teleophthalmology solutions enabling remote diagnosis, and a continued emphasis on preventative eye care programs aimed at early disease detection. This will lead to increased demand for sophisticated and efficient ophthalmology diagnostic equipment across all market segments.
Ophthalmology Diagnostics Industry Market Report: 2019-2033
This comprehensive report provides a detailed analysis of the Ophthalmology Diagnostics industry, encompassing market dynamics, growth trends, regional segmentation, product landscape, key players, and future outlook. The report covers the period from 2019 to 2033, with a focus on the 2025-2033 forecast period. The base year for this analysis is 2025. This report is crucial for industry professionals, investors, and strategic decision-makers seeking in-depth insights into this rapidly evolving market. The total market size is projected to reach xx Million by 2033.
Ophthalmology Diagnostics Industry Market Dynamics & Structure
The ophthalmology diagnostics market is characterized by a moderately concentrated landscape, with key players like Alcon Inc, Carl Zeiss Meditec AG, and Topcon Corporation holding significant market share. Technological innovation, particularly in areas like OCT scanning and AI-powered image analysis, is a primary growth driver. Stringent regulatory frameworks governing medical device approval vary across regions, impacting market entry and expansion strategies. Competitive pressure from substitute technologies, such as advancements in telehealth and remote diagnostic tools, is increasing. The end-user demographic is expanding due to an aging global population and rising prevalence of eye diseases. M&A activity within the sector has been moderate in recent years, with approximately xx deals valued at xx Million recorded between 2019 and 2024.
- Market Concentration: Moderately concentrated, with top 5 players holding approximately xx% market share in 2025.
- Technological Innovation: AI-powered diagnostics, miniaturization of devices, and improved image quality are key drivers.
- Regulatory Frameworks: Vary significantly by region, impacting product approval timelines and market access.
- Competitive Substitutes: Telehealth and remote diagnostic tools present emerging competition.
- End-User Demographics: Aging population and increased prevalence of eye diseases are expanding the market.
- M&A Trends: Moderate activity, with xx deals recorded between 2019 and 2024, totaling approximately xx Million.
Ophthalmology Diagnostics Industry Growth Trends & Insights
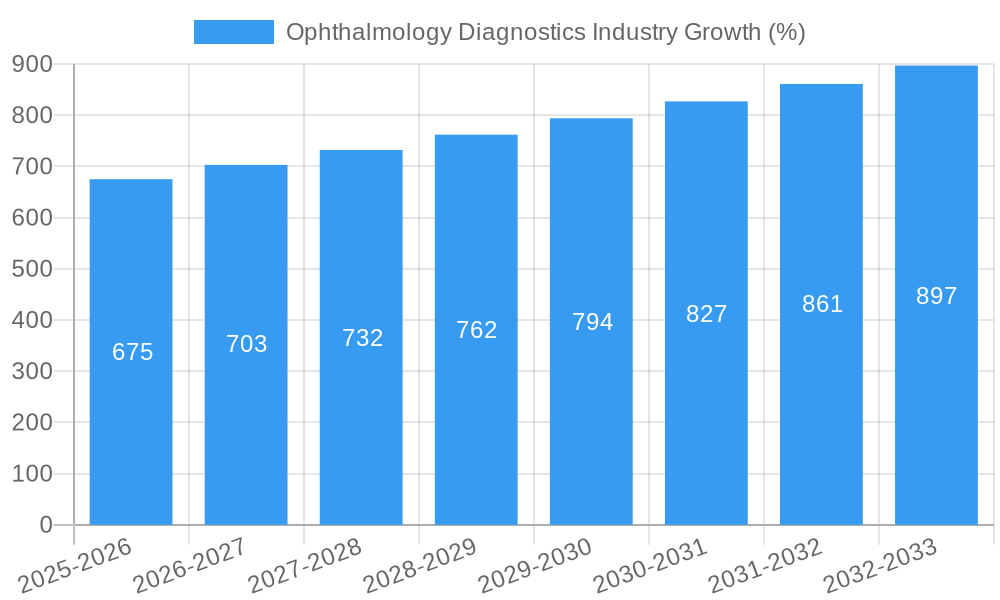
The ophthalmology diagnostics market experienced robust growth between 2019 and 2024, driven by factors such as technological advancements, increasing prevalence of eye diseases, and rising healthcare expenditure. The market size increased from xx Million in 2019 to xx Million in 2024, registering a CAGR of xx%. This growth trajectory is projected to continue, with a forecasted CAGR of xx% during 2025-2033. Adoption rates of advanced technologies like OCT scanners and corneal topographers are steadily increasing, while the market witnesses a shift towards minimally invasive procedures and personalized medicine approaches. Consumer behavior is also changing, with greater patient awareness and demand for quicker, more accurate diagnostic tools.
Dominant Regions, Countries, or Segments in Ophthalmology Diagnostics Industry
North America currently dominates the ophthalmology diagnostics market, driven by high healthcare expenditure, advanced healthcare infrastructure, and early adoption of new technologies. Within this region, the United States is the largest market, representing approximately xx% of the global market share in 2025. Europe follows as the second-largest market, demonstrating significant growth potential due to increasing government initiatives and investments in healthcare infrastructure. The Asia-Pacific region is experiencing rapid expansion, particularly in countries like China and India, driven by a large and growing population, rising disposable incomes, and improving access to healthcare.
Key Drivers:
- North America: High healthcare spending, advanced infrastructure, and early adoption of new technologies.
- Europe: Government initiatives, investments in healthcare, and rising prevalence of age-related eye diseases.
- Asia-Pacific: Large and growing population, rising disposable incomes, and improving healthcare access.
Segment Dominance:
- Product: OCT Scanners are projected to hold the largest market share in 2025 due to their high diagnostic accuracy and versatility.
- Application: Retinal evaluation and glaucoma detection are major application segments, contributing significantly to the overall market size.
- End-user: Hospitals are the largest end-users, followed by specialty clinics.
Ophthalmology Diagnostics Industry Product Landscape
The ophthalmology diagnostics product landscape is characterized by a wide range of devices, including corneal topographers, fundus cameras, ophthalmoscopes, OCT scanners, retinoscopes, and refractors. Recent innovations focus on enhancing image quality, improving portability, and integrating AI for automated analysis. OCT scanners, for example, have witnessed significant advancements in resolution and speed, allowing for faster and more accurate diagnosis. The unique selling proposition of many products lies in their non-invasive nature, high diagnostic accuracy, and ease of use.
Key Drivers, Barriers & Challenges in Ophthalmology Diagnostics Industry
Key Drivers:
- Technological advancements leading to improved diagnostic accuracy and efficiency.
- Rising prevalence of age-related eye diseases, such as glaucoma and macular degeneration.
- Increased healthcare spending and government initiatives promoting eye health.
Key Challenges:
- High cost of advanced diagnostic equipment, limiting access in low-resource settings.
- Stringent regulatory requirements for medical device approval, increasing time to market.
- Intense competition among established players and emerging technology providers. This competition is estimated to result in a price reduction of xx% by 2033.
Emerging Opportunities in Ophthalmology Diagnostics Industry
- Expansion into underserved markets, particularly in developing countries.
- Development of point-of-care diagnostic tools for remote or rural areas.
- Integration of AI and machine learning for automated diagnosis and disease prediction.
Growth Accelerators in the Ophthalmology Diagnostics Industry Industry
Technological breakthroughs, such as the development of more sensitive and accurate diagnostic tools, are key growth drivers. Strategic partnerships between technology companies and healthcare providers can accelerate market penetration and adoption of new technologies. Expansion into emerging markets with large, underserved populations represents a significant opportunity for growth.
Key Players Shaping the Ophthalmology Diagnostics Industry Market
- Metall Zug Group
- Carl Zeiss Meditec AG
- Marco Ophthalmic Inc
- EssilorLuxottica
- Lumenis Ltd
- Ziemer Ophthalmic Systems AG
- Canon
- Topcon Corporation
- NIDEK CO LTD
- Alcon Inc
- Lumibird Group
Notable Milestones in Ophthalmology Diagnostics Industry Sector
- May 2022: Toku Eyes launches ORAiCLE, an AI-powered tool assessing heart risk via retinal scans.
- July 2022: Sightsavers launches a mobile eye care van in Delhi-NCR, providing services to truckers.
In-Depth Ophthalmology Diagnostics Industry Market Outlook
The ophthalmology diagnostics market is poised for continued growth, driven by technological innovation, increasing prevalence of eye diseases, and expansion into new markets. Strategic partnerships, product diversification, and focus on personalized medicine will be crucial for success in this dynamic market. The market is projected to witness significant growth in the coming years, driven by factors such as an aging global population and rising awareness about eye health.
Ophthalmology Diagnostics Industry Segmentation
-
1. Product
- 1.1. Corneal Topographers
- 1.2. Fundus Cameras
- 1.3. Ophthalmoscopes
- 1.4. OCT Scanners
- 1.5. Retinoscopes
- 1.6. Refractors
- 1.7. Others
-
2. Application
- 2.1. Retinal Evaluation
- 2.2. Glaucoma Detection
- 2.3. Surgical Evaluation
- 2.4. Refraction Assessment
- 2.5. Others
-
3. End-user
- 3.1. Hospitals
- 3.2. Speciality Clinics
- 3.3. Others
Ophthalmology Diagnostics Industry Segmentation By Geography
-
1. North America
- 1.1. United states
- 1.2. Canada
- 1.3. Mexico
-
2. Europe
- 2.1. Germany
- 2.2. United Kingdom
- 2.3. France
- 2.4. Italy
- 2.5. Spain
- 2.6. Rest of Europe
-
3. Asia Pacific
- 3.1. China
- 3.2. Japan
- 3.3. India
- 3.4. Australia
- 3.5. South Korea
- 3.6. Rest of Asia Pacific
-
4. Middle East and Africa
- 4.1. GCC
- 4.2. South Africa
- 4.3. Rest of Middle East and Africa
-
5. South America
- 5.1. Brazil
- 5.2. Argentina
- 5.3. Rest of South America
Ophthalmology Diagnostics Industry REPORT HIGHLIGHTS
| Aspects | Details |
|---|---|
| Study Period | 2019-2033 |
| Base Year | 2024 |
| Estimated Year | 2025 |
| Forecast Period | 2025-2033 |
| Historical Period | 2019-2024 |
| Growth Rate | CAGR of > 4.15% from 2019-2033 |
| Segmentation |
|
Table of Contents
- 1. Introduction
- 1.1. Research Scope
- 1.2. Market Segmentation
- 1.3. Research Methodology
- 1.4. Definitions and Assumptions
- 2. Executive Summary
- 2.1. Introduction
- 3. Market Dynamics
- 3.1. Introduction
- 3.2. Market Drivers
- 3.2.1. Increased Global Incidence of Ophthalmic Disorders Coupled with Rise in Diabetes; Rise in Government Support to Control Visual Impairment and Rapid Advancements in the Ophthalmic Devices
- 3.3. Market Restrains
- 3.3.1. Higher Cost of the Ophthalmic Devices and Treatment; Lack of Awareness and Skilled Ophthalmologists in Emerging Nations
- 3.4. Market Trends
- 3.4.1. The Surgical Evaluation Segment is Expected to Hold a Significant Market Share in the Ophthalmic Diagnostics Market
- 4. Market Factor Analysis
- 4.1. Porters Five Forces
- 4.2. Supply/Value Chain
- 4.3. PESTEL analysis
- 4.4. Market Entropy
- 4.5. Patent/Trademark Analysis
- 5. Global Ophthalmology Diagnostics Industry Analysis, Insights and Forecast, 2019-2031
- 5.1. Market Analysis, Insights and Forecast - by Product
- 5.1.1. Corneal Topographers
- 5.1.2. Fundus Cameras
- 5.1.3. Ophthalmoscopes
- 5.1.4. OCT Scanners
- 5.1.5. Retinoscopes
- 5.1.6. Refractors
- 5.1.7. Others
- 5.2. Market Analysis, Insights and Forecast - by Application
- 5.2.1. Retinal Evaluation
- 5.2.2. Glaucoma Detection
- 5.2.3. Surgical Evaluation
- 5.2.4. Refraction Assessment
- 5.2.5. Others
- 5.3. Market Analysis, Insights and Forecast - by End-user
- 5.3.1. Hospitals
- 5.3.2. Speciality Clinics
- 5.3.3. Others
- 5.4. Market Analysis, Insights and Forecast - by Region
- 5.4.1. North America
- 5.4.2. Europe
- 5.4.3. Asia Pacific
- 5.4.4. Middle East and Africa
- 5.4.5. South America
- 5.1. Market Analysis, Insights and Forecast - by Product
- 6. North America Ophthalmology Diagnostics Industry Analysis, Insights and Forecast, 2019-2031
- 6.1. Market Analysis, Insights and Forecast - by Product
- 6.1.1. Corneal Topographers
- 6.1.2. Fundus Cameras
- 6.1.3. Ophthalmoscopes
- 6.1.4. OCT Scanners
- 6.1.5. Retinoscopes
- 6.1.6. Refractors
- 6.1.7. Others
- 6.2. Market Analysis, Insights and Forecast - by Application
- 6.2.1. Retinal Evaluation
- 6.2.2. Glaucoma Detection
- 6.2.3. Surgical Evaluation
- 6.2.4. Refraction Assessment
- 6.2.5. Others
- 6.3. Market Analysis, Insights and Forecast - by End-user
- 6.3.1. Hospitals
- 6.3.2. Speciality Clinics
- 6.3.3. Others
- 6.1. Market Analysis, Insights and Forecast - by Product
- 7. Europe Ophthalmology Diagnostics Industry Analysis, Insights and Forecast, 2019-2031
- 7.1. Market Analysis, Insights and Forecast - by Product
- 7.1.1. Corneal Topographers
- 7.1.2. Fundus Cameras
- 7.1.3. Ophthalmoscopes
- 7.1.4. OCT Scanners
- 7.1.5. Retinoscopes
- 7.1.6. Refractors
- 7.1.7. Others
- 7.2. Market Analysis, Insights and Forecast - by Application
- 7.2.1. Retinal Evaluation
- 7.2.2. Glaucoma Detection
- 7.2.3. Surgical Evaluation
- 7.2.4. Refraction Assessment
- 7.2.5. Others
- 7.3. Market Analysis, Insights and Forecast - by End-user
- 7.3.1. Hospitals
- 7.3.2. Speciality Clinics
- 7.3.3. Others
- 7.1. Market Analysis, Insights and Forecast - by Product
- 8. Asia Pacific Ophthalmology Diagnostics Industry Analysis, Insights and Forecast, 2019-2031
- 8.1. Market Analysis, Insights and Forecast - by Product
- 8.1.1. Corneal Topographers
- 8.1.2. Fundus Cameras
- 8.1.3. Ophthalmoscopes
- 8.1.4. OCT Scanners
- 8.1.5. Retinoscopes
- 8.1.6. Refractors
- 8.1.7. Others
- 8.2. Market Analysis, Insights and Forecast - by Application
- 8.2.1. Retinal Evaluation
- 8.2.2. Glaucoma Detection
- 8.2.3. Surgical Evaluation
- 8.2.4. Refraction Assessment
- 8.2.5. Others
- 8.3. Market Analysis, Insights and Forecast - by End-user
- 8.3.1. Hospitals
- 8.3.2. Speciality Clinics
- 8.3.3. Others
- 8.1. Market Analysis, Insights and Forecast - by Product
- 9. Middle East and Africa Ophthalmology Diagnostics Industry Analysis, Insights and Forecast, 2019-2031
- 9.1. Market Analysis, Insights and Forecast - by Product
- 9.1.1. Corneal Topographers
- 9.1.2. Fundus Cameras
- 9.1.3. Ophthalmoscopes
- 9.1.4. OCT Scanners
- 9.1.5. Retinoscopes
- 9.1.6. Refractors
- 9.1.7. Others
- 9.2. Market Analysis, Insights and Forecast - by Application
- 9.2.1. Retinal Evaluation
- 9.2.2. Glaucoma Detection
- 9.2.3. Surgical Evaluation
- 9.2.4. Refraction Assessment
- 9.2.5. Others
- 9.3. Market Analysis, Insights and Forecast - by End-user
- 9.3.1. Hospitals
- 9.3.2. Speciality Clinics
- 9.3.3. Others
- 9.1. Market Analysis, Insights and Forecast - by Product
- 10. South America Ophthalmology Diagnostics Industry Analysis, Insights and Forecast, 2019-2031
- 10.1. Market Analysis, Insights and Forecast - by Product
- 10.1.1. Corneal Topographers
- 10.1.2. Fundus Cameras
- 10.1.3. Ophthalmoscopes
- 10.1.4. OCT Scanners
- 10.1.5. Retinoscopes
- 10.1.6. Refractors
- 10.1.7. Others
- 10.2. Market Analysis, Insights and Forecast - by Application
- 10.2.1. Retinal Evaluation
- 10.2.2. Glaucoma Detection
- 10.2.3. Surgical Evaluation
- 10.2.4. Refraction Assessment
- 10.2.5. Others
- 10.3. Market Analysis, Insights and Forecast - by End-user
- 10.3.1. Hospitals
- 10.3.2. Speciality Clinics
- 10.3.3. Others
- 10.1. Market Analysis, Insights and Forecast - by Product
- 11. North America Ophthalmology Diagnostics Industry Analysis, Insights and Forecast, 2019-2031
- 11.1. Market Analysis, Insights and Forecast - By Country/Sub-region
- 11.1.1. undefined
- 12. Europe Ophthalmology Diagnostics Industry Analysis, Insights and Forecast, 2019-2031
- 12.1. Market Analysis, Insights and Forecast - By Country/Sub-region
- 12.1.1. undefined
- 13. Asia Pacific Ophthalmology Diagnostics Industry Analysis, Insights and Forecast, 2019-2031
- 13.1. Market Analysis, Insights and Forecast - By Country/Sub-region
- 13.1.1. undefined
- 14. Middle East and Africa Ophthalmology Diagnostics Industry Analysis, Insights and Forecast, 2019-2031
- 14.1. Market Analysis, Insights and Forecast - By Country/Sub-region
- 14.1.1. undefined
- 15. South America Ophthalmology Diagnostics Industry Analysis, Insights and Forecast, 2019-2031
- 15.1. Market Analysis, Insights and Forecast - By Country/Sub-region
- 15.1.1. undefined
- 16. Competitive Analysis
- 16.1. Global Market Share Analysis 2024
- 16.2. Company Profiles
- 16.2.1 Metall Zug Group
- 16.2.1.1. Overview
- 16.2.1.2. Products
- 16.2.1.3. SWOT Analysis
- 16.2.1.4. Recent Developments
- 16.2.1.5. Financials (Based on Availability)
- 16.2.2 Carl Zeiss Meditec AG
- 16.2.2.1. Overview
- 16.2.2.2. Products
- 16.2.2.3. SWOT Analysis
- 16.2.2.4. Recent Developments
- 16.2.2.5. Financials (Based on Availability)
- 16.2.3 Marco Ophthalmic Inc
- 16.2.3.1. Overview
- 16.2.3.2. Products
- 16.2.3.3. SWOT Analysis
- 16.2.3.4. Recent Developments
- 16.2.3.5. Financials (Based on Availability)
- 16.2.4 EssilorLuxottica
- 16.2.4.1. Overview
- 16.2.4.2. Products
- 16.2.4.3. SWOT Analysis
- 16.2.4.4. Recent Developments
- 16.2.4.5. Financials (Based on Availability)
- 16.2.5 Lumenis Ltd
- 16.2.5.1. Overview
- 16.2.5.2. Products
- 16.2.5.3. SWOT Analysis
- 16.2.5.4. Recent Developments
- 16.2.5.5. Financials (Based on Availability)
- 16.2.6 Ziemer Ophthalmic Systems AG
- 16.2.6.1. Overview
- 16.2.6.2. Products
- 16.2.6.3. SWOT Analysis
- 16.2.6.4. Recent Developments
- 16.2.6.5. Financials (Based on Availability)
- 16.2.7 Canon
- 16.2.7.1. Overview
- 16.2.7.2. Products
- 16.2.7.3. SWOT Analysis
- 16.2.7.4. Recent Developments
- 16.2.7.5. Financials (Based on Availability)
- 16.2.8 Topcon Corporation
- 16.2.8.1. Overview
- 16.2.8.2. Products
- 16.2.8.3. SWOT Analysis
- 16.2.8.4. Recent Developments
- 16.2.8.5. Financials (Based on Availability)
- 16.2.9 NIDEK CO LTD
- 16.2.9.1. Overview
- 16.2.9.2. Products
- 16.2.9.3. SWOT Analysis
- 16.2.9.4. Recent Developments
- 16.2.9.5. Financials (Based on Availability)
- 16.2.10 Alcon Inc
- 16.2.10.1. Overview
- 16.2.10.2. Products
- 16.2.10.3. SWOT Analysis
- 16.2.10.4. Recent Developments
- 16.2.10.5. Financials (Based on Availability)
- 16.2.11 Lumibird Group
- 16.2.11.1. Overview
- 16.2.11.2. Products
- 16.2.11.3. SWOT Analysis
- 16.2.11.4. Recent Developments
- 16.2.11.5. Financials (Based on Availability)
- 16.2.1 Metall Zug Group
List of Figures
- Figure 1: Global Ophthalmology Diagnostics Industry Revenue Breakdown (Million, %) by Region 2024 & 2032
- Figure 2: Global Ophthalmology Diagnostics Industry Volume Breakdown (K Unit, %) by Region 2024 & 2032
- Figure 3: North America Ophthalmology Diagnostics Industry Revenue (Million), by Country 2024 & 2032
- Figure 4: North America Ophthalmology Diagnostics Industry Volume (K Unit), by Country 2024 & 2032
- Figure 5: North America Ophthalmology Diagnostics Industry Revenue Share (%), by Country 2024 & 2032
- Figure 6: North America Ophthalmology Diagnostics Industry Volume Share (%), by Country 2024 & 2032
- Figure 7: Europe Ophthalmology Diagnostics Industry Revenue (Million), by Country 2024 & 2032
- Figure 8: Europe Ophthalmology Diagnostics Industry Volume (K Unit), by Country 2024 & 2032
- Figure 9: Europe Ophthalmology Diagnostics Industry Revenue Share (%), by Country 2024 & 2032
- Figure 10: Europe Ophthalmology Diagnostics Industry Volume Share (%), by Country 2024 & 2032
- Figure 11: Asia Pacific Ophthalmology Diagnostics Industry Revenue (Million), by Country 2024 & 2032
- Figure 12: Asia Pacific Ophthalmology Diagnostics Industry Volume (K Unit), by Country 2024 & 2032
- Figure 13: Asia Pacific Ophthalmology Diagnostics Industry Revenue Share (%), by Country 2024 & 2032
- Figure 14: Asia Pacific Ophthalmology Diagnostics Industry Volume Share (%), by Country 2024 & 2032
- Figure 15: Middle East and Africa Ophthalmology Diagnostics Industry Revenue (Million), by Country 2024 & 2032
- Figure 16: Middle East and Africa Ophthalmology Diagnostics Industry Volume (K Unit), by Country 2024 & 2032
- Figure 17: Middle East and Africa Ophthalmology Diagnostics Industry Revenue Share (%), by Country 2024 & 2032
- Figure 18: Middle East and Africa Ophthalmology Diagnostics Industry Volume Share (%), by Country 2024 & 2032
- Figure 19: South America Ophthalmology Diagnostics Industry Revenue (Million), by Country 2024 & 2032
- Figure 20: South America Ophthalmology Diagnostics Industry Volume (K Unit), by Country 2024 & 2032
- Figure 21: South America Ophthalmology Diagnostics Industry Revenue Share (%), by Country 2024 & 2032
- Figure 22: South America Ophthalmology Diagnostics Industry Volume Share (%), by Country 2024 & 2032
- Figure 23: North America Ophthalmology Diagnostics Industry Revenue (Million), by Product 2024 & 2032
- Figure 24: North America Ophthalmology Diagnostics Industry Volume (K Unit), by Product 2024 & 2032
- Figure 25: North America Ophthalmology Diagnostics Industry Revenue Share (%), by Product 2024 & 2032
- Figure 26: North America Ophthalmology Diagnostics Industry Volume Share (%), by Product 2024 & 2032
- Figure 27: North America Ophthalmology Diagnostics Industry Revenue (Million), by Application 2024 & 2032
- Figure 28: North America Ophthalmology Diagnostics Industry Volume (K Unit), by Application 2024 & 2032
- Figure 29: North America Ophthalmology Diagnostics Industry Revenue Share (%), by Application 2024 & 2032
- Figure 30: North America Ophthalmology Diagnostics Industry Volume Share (%), by Application 2024 & 2032
- Figure 31: North America Ophthalmology Diagnostics Industry Revenue (Million), by End-user 2024 & 2032
- Figure 32: North America Ophthalmology Diagnostics Industry Volume (K Unit), by End-user 2024 & 2032
- Figure 33: North America Ophthalmology Diagnostics Industry Revenue Share (%), by End-user 2024 & 2032
- Figure 34: North America Ophthalmology Diagnostics Industry Volume Share (%), by End-user 2024 & 2032
- Figure 35: North America Ophthalmology Diagnostics Industry Revenue (Million), by Country 2024 & 2032
- Figure 36: North America Ophthalmology Diagnostics Industry Volume (K Unit), by Country 2024 & 2032
- Figure 37: North America Ophthalmology Diagnostics Industry Revenue Share (%), by Country 2024 & 2032
- Figure 38: North America Ophthalmology Diagnostics Industry Volume Share (%), by Country 2024 & 2032
- Figure 39: Europe Ophthalmology Diagnostics Industry Revenue (Million), by Product 2024 & 2032
- Figure 40: Europe Ophthalmology Diagnostics Industry Volume (K Unit), by Product 2024 & 2032
- Figure 41: Europe Ophthalmology Diagnostics Industry Revenue Share (%), by Product 2024 & 2032
- Figure 42: Europe Ophthalmology Diagnostics Industry Volume Share (%), by Product 2024 & 2032
- Figure 43: Europe Ophthalmology Diagnostics Industry Revenue (Million), by Application 2024 & 2032
- Figure 44: Europe Ophthalmology Diagnostics Industry Volume (K Unit), by Application 2024 & 2032
- Figure 45: Europe Ophthalmology Diagnostics Industry Revenue Share (%), by Application 2024 & 2032
- Figure 46: Europe Ophthalmology Diagnostics Industry Volume Share (%), by Application 2024 & 2032
- Figure 47: Europe Ophthalmology Diagnostics Industry Revenue (Million), by End-user 2024 & 2032
- Figure 48: Europe Ophthalmology Diagnostics Industry Volume (K Unit), by End-user 2024 & 2032
- Figure 49: Europe Ophthalmology Diagnostics Industry Revenue Share (%), by End-user 2024 & 2032
- Figure 50: Europe Ophthalmology Diagnostics Industry Volume Share (%), by End-user 2024 & 2032
- Figure 51: Europe Ophthalmology Diagnostics Industry Revenue (Million), by Country 2024 & 2032
- Figure 52: Europe Ophthalmology Diagnostics Industry Volume (K Unit), by Country 2024 & 2032
- Figure 53: Europe Ophthalmology Diagnostics Industry Revenue Share (%), by Country 2024 & 2032
- Figure 54: Europe Ophthalmology Diagnostics Industry Volume Share (%), by Country 2024 & 2032
- Figure 55: Asia Pacific Ophthalmology Diagnostics Industry Revenue (Million), by Product 2024 & 2032
- Figure 56: Asia Pacific Ophthalmology Diagnostics Industry Volume (K Unit), by Product 2024 & 2032
- Figure 57: Asia Pacific Ophthalmology Diagnostics Industry Revenue Share (%), by Product 2024 & 2032
- Figure 58: Asia Pacific Ophthalmology Diagnostics Industry Volume Share (%), by Product 2024 & 2032
- Figure 59: Asia Pacific Ophthalmology Diagnostics Industry Revenue (Million), by Application 2024 & 2032
- Figure 60: Asia Pacific Ophthalmology Diagnostics Industry Volume (K Unit), by Application 2024 & 2032
- Figure 61: Asia Pacific Ophthalmology Diagnostics Industry Revenue Share (%), by Application 2024 & 2032
- Figure 62: Asia Pacific Ophthalmology Diagnostics Industry Volume Share (%), by Application 2024 & 2032
- Figure 63: Asia Pacific Ophthalmology Diagnostics Industry Revenue (Million), by End-user 2024 & 2032
- Figure 64: Asia Pacific Ophthalmology Diagnostics Industry Volume (K Unit), by End-user 2024 & 2032
- Figure 65: Asia Pacific Ophthalmology Diagnostics Industry Revenue Share (%), by End-user 2024 & 2032
- Figure 66: Asia Pacific Ophthalmology Diagnostics Industry Volume Share (%), by End-user 2024 & 2032
- Figure 67: Asia Pacific Ophthalmology Diagnostics Industry Revenue (Million), by Country 2024 & 2032
- Figure 68: Asia Pacific Ophthalmology Diagnostics Industry Volume (K Unit), by Country 2024 & 2032
- Figure 69: Asia Pacific Ophthalmology Diagnostics Industry Revenue Share (%), by Country 2024 & 2032
- Figure 70: Asia Pacific Ophthalmology Diagnostics Industry Volume Share (%), by Country 2024 & 2032
- Figure 71: Middle East and Africa Ophthalmology Diagnostics Industry Revenue (Million), by Product 2024 & 2032
- Figure 72: Middle East and Africa Ophthalmology Diagnostics Industry Volume (K Unit), by Product 2024 & 2032
- Figure 73: Middle East and Africa Ophthalmology Diagnostics Industry Revenue Share (%), by Product 2024 & 2032
- Figure 74: Middle East and Africa Ophthalmology Diagnostics Industry Volume Share (%), by Product 2024 & 2032
- Figure 75: Middle East and Africa Ophthalmology Diagnostics Industry Revenue (Million), by Application 2024 & 2032
- Figure 76: Middle East and Africa Ophthalmology Diagnostics Industry Volume (K Unit), by Application 2024 & 2032
- Figure 77: Middle East and Africa Ophthalmology Diagnostics Industry Revenue Share (%), by Application 2024 & 2032
- Figure 78: Middle East and Africa Ophthalmology Diagnostics Industry Volume Share (%), by Application 2024 & 2032
- Figure 79: Middle East and Africa Ophthalmology Diagnostics Industry Revenue (Million), by End-user 2024 & 2032
- Figure 80: Middle East and Africa Ophthalmology Diagnostics Industry Volume (K Unit), by End-user 2024 & 2032
- Figure 81: Middle East and Africa Ophthalmology Diagnostics Industry Revenue Share (%), by End-user 2024 & 2032
- Figure 82: Middle East and Africa Ophthalmology Diagnostics Industry Volume Share (%), by End-user 2024 & 2032
- Figure 83: Middle East and Africa Ophthalmology Diagnostics Industry Revenue (Million), by Country 2024 & 2032
- Figure 84: Middle East and Africa Ophthalmology Diagnostics Industry Volume (K Unit), by Country 2024 & 2032
- Figure 85: Middle East and Africa Ophthalmology Diagnostics Industry Revenue Share (%), by Country 2024 & 2032
- Figure 86: Middle East and Africa Ophthalmology Diagnostics Industry Volume Share (%), by Country 2024 & 2032
- Figure 87: South America Ophthalmology Diagnostics Industry Revenue (Million), by Product 2024 & 2032
- Figure 88: South America Ophthalmology Diagnostics Industry Volume (K Unit), by Product 2024 & 2032
- Figure 89: South America Ophthalmology Diagnostics Industry Revenue Share (%), by Product 2024 & 2032
- Figure 90: South America Ophthalmology Diagnostics Industry Volume Share (%), by Product 2024 & 2032
- Figure 91: South America Ophthalmology Diagnostics Industry Revenue (Million), by Application 2024 & 2032
- Figure 92: South America Ophthalmology Diagnostics Industry Volume (K Unit), by Application 2024 & 2032
- Figure 93: South America Ophthalmology Diagnostics Industry Revenue Share (%), by Application 2024 & 2032
- Figure 94: South America Ophthalmology Diagnostics Industry Volume Share (%), by Application 2024 & 2032
- Figure 95: South America Ophthalmology Diagnostics Industry Revenue (Million), by End-user 2024 & 2032
- Figure 96: South America Ophthalmology Diagnostics Industry Volume (K Unit), by End-user 2024 & 2032
- Figure 97: South America Ophthalmology Diagnostics Industry Revenue Share (%), by End-user 2024 & 2032
- Figure 98: South America Ophthalmology Diagnostics Industry Volume Share (%), by End-user 2024 & 2032
- Figure 99: South America Ophthalmology Diagnostics Industry Revenue (Million), by Country 2024 & 2032
- Figure 100: South America Ophthalmology Diagnostics Industry Volume (K Unit), by Country 2024 & 2032
- Figure 101: South America Ophthalmology Diagnostics Industry Revenue Share (%), by Country 2024 & 2032
- Figure 102: South America Ophthalmology Diagnostics Industry Volume Share (%), by Country 2024 & 2032
List of Tables
- Table 1: Global Ophthalmology Diagnostics Industry Revenue Million Forecast, by Region 2019 & 2032
- Table 2: Global Ophthalmology Diagnostics Industry Volume K Unit Forecast, by Region 2019 & 2032
- Table 3: Global Ophthalmology Diagnostics Industry Revenue Million Forecast, by Product 2019 & 2032
- Table 4: Global Ophthalmology Diagnostics Industry Volume K Unit Forecast, by Product 2019 & 2032
- Table 5: Global Ophthalmology Diagnostics Industry Revenue Million Forecast, by Application 2019 & 2032
- Table 6: Global Ophthalmology Diagnostics Industry Volume K Unit Forecast, by Application 2019 & 2032
- Table 7: Global Ophthalmology Diagnostics Industry Revenue Million Forecast, by End-user 2019 & 2032
- Table 8: Global Ophthalmology Diagnostics Industry Volume K Unit Forecast, by End-user 2019 & 2032
- Table 9: Global Ophthalmology Diagnostics Industry Revenue Million Forecast, by Region 2019 & 2032
- Table 10: Global Ophthalmology Diagnostics Industry Volume K Unit Forecast, by Region 2019 & 2032
- Table 11: Global Ophthalmology Diagnostics Industry Revenue Million Forecast, by Country 2019 & 2032
- Table 12: Global Ophthalmology Diagnostics Industry Volume K Unit Forecast, by Country 2019 & 2032
- Table 13: Global Ophthalmology Diagnostics Industry Revenue Million Forecast, by Country 2019 & 2032
- Table 14: Global Ophthalmology Diagnostics Industry Volume K Unit Forecast, by Country 2019 & 2032
- Table 15: Global Ophthalmology Diagnostics Industry Revenue Million Forecast, by Country 2019 & 2032
- Table 16: Global Ophthalmology Diagnostics Industry Volume K Unit Forecast, by Country 2019 & 2032
- Table 17: Global Ophthalmology Diagnostics Industry Revenue Million Forecast, by Country 2019 & 2032
- Table 18: Global Ophthalmology Diagnostics Industry Volume K Unit Forecast, by Country 2019 & 2032
- Table 19: Global Ophthalmology Diagnostics Industry Revenue Million Forecast, by Country 2019 & 2032
- Table 20: Global Ophthalmology Diagnostics Industry Volume K Unit Forecast, by Country 2019 & 2032
- Table 21: Global Ophthalmology Diagnostics Industry Revenue Million Forecast, by Product 2019 & 2032
- Table 22: Global Ophthalmology Diagnostics Industry Volume K Unit Forecast, by Product 2019 & 2032
- Table 23: Global Ophthalmology Diagnostics Industry Revenue Million Forecast, by Application 2019 & 2032
- Table 24: Global Ophthalmology Diagnostics Industry Volume K Unit Forecast, by Application 2019 & 2032
- Table 25: Global Ophthalmology Diagnostics Industry Revenue Million Forecast, by End-user 2019 & 2032
- Table 26: Global Ophthalmology Diagnostics Industry Volume K Unit Forecast, by End-user 2019 & 2032
- Table 27: Global Ophthalmology Diagnostics Industry Revenue Million Forecast, by Country 2019 & 2032
- Table 28: Global Ophthalmology Diagnostics Industry Volume K Unit Forecast, by Country 2019 & 2032
- Table 29: United states Ophthalmology Diagnostics Industry Revenue (Million) Forecast, by Application 2019 & 2032
- Table 30: United states Ophthalmology Diagnostics Industry Volume (K Unit) Forecast, by Application 2019 & 2032
- Table 31: Canada Ophthalmology Diagnostics Industry Revenue (Million) Forecast, by Application 2019 & 2032
- Table 32: Canada Ophthalmology Diagnostics Industry Volume (K Unit) Forecast, by Application 2019 & 2032
- Table 33: Mexico Ophthalmology Diagnostics Industry Revenue (Million) Forecast, by Application 2019 & 2032
- Table 34: Mexico Ophthalmology Diagnostics Industry Volume (K Unit) Forecast, by Application 2019 & 2032
- Table 35: Global Ophthalmology Diagnostics Industry Revenue Million Forecast, by Product 2019 & 2032
- Table 36: Global Ophthalmology Diagnostics Industry Volume K Unit Forecast, by Product 2019 & 2032
- Table 37: Global Ophthalmology Diagnostics Industry Revenue Million Forecast, by Application 2019 & 2032
- Table 38: Global Ophthalmology Diagnostics Industry Volume K Unit Forecast, by Application 2019 & 2032
- Table 39: Global Ophthalmology Diagnostics Industry Revenue Million Forecast, by End-user 2019 & 2032
- Table 40: Global Ophthalmology Diagnostics Industry Volume K Unit Forecast, by End-user 2019 & 2032
- Table 41: Global Ophthalmology Diagnostics Industry Revenue Million Forecast, by Country 2019 & 2032
- Table 42: Global Ophthalmology Diagnostics Industry Volume K Unit Forecast, by Country 2019 & 2032
- Table 43: Germany Ophthalmology Diagnostics Industry Revenue (Million) Forecast, by Application 2019 & 2032
- Table 44: Germany Ophthalmology Diagnostics Industry Volume (K Unit) Forecast, by Application 2019 & 2032
- Table 45: United Kingdom Ophthalmology Diagnostics Industry Revenue (Million) Forecast, by Application 2019 & 2032
- Table 46: United Kingdom Ophthalmology Diagnostics Industry Volume (K Unit) Forecast, by Application 2019 & 2032
- Table 47: France Ophthalmology Diagnostics Industry Revenue (Million) Forecast, by Application 2019 & 2032
- Table 48: France Ophthalmology Diagnostics Industry Volume (K Unit) Forecast, by Application 2019 & 2032
- Table 49: Italy Ophthalmology Diagnostics Industry Revenue (Million) Forecast, by Application 2019 & 2032
- Table 50: Italy Ophthalmology Diagnostics Industry Volume (K Unit) Forecast, by Application 2019 & 2032
- Table 51: Spain Ophthalmology Diagnostics Industry Revenue (Million) Forecast, by Application 2019 & 2032
- Table 52: Spain Ophthalmology Diagnostics Industry Volume (K Unit) Forecast, by Application 2019 & 2032
- Table 53: Rest of Europe Ophthalmology Diagnostics Industry Revenue (Million) Forecast, by Application 2019 & 2032
- Table 54: Rest of Europe Ophthalmology Diagnostics Industry Volume (K Unit) Forecast, by Application 2019 & 2032
- Table 55: Global Ophthalmology Diagnostics Industry Revenue Million Forecast, by Product 2019 & 2032
- Table 56: Global Ophthalmology Diagnostics Industry Volume K Unit Forecast, by Product 2019 & 2032
- Table 57: Global Ophthalmology Diagnostics Industry Revenue Million Forecast, by Application 2019 & 2032
- Table 58: Global Ophthalmology Diagnostics Industry Volume K Unit Forecast, by Application 2019 & 2032
- Table 59: Global Ophthalmology Diagnostics Industry Revenue Million Forecast, by End-user 2019 & 2032
- Table 60: Global Ophthalmology Diagnostics Industry Volume K Unit Forecast, by End-user 2019 & 2032
- Table 61: Global Ophthalmology Diagnostics Industry Revenue Million Forecast, by Country 2019 & 2032
- Table 62: Global Ophthalmology Diagnostics Industry Volume K Unit Forecast, by Country 2019 & 2032
- Table 63: China Ophthalmology Diagnostics Industry Revenue (Million) Forecast, by Application 2019 & 2032
- Table 64: China Ophthalmology Diagnostics Industry Volume (K Unit) Forecast, by Application 2019 & 2032
- Table 65: Japan Ophthalmology Diagnostics Industry Revenue (Million) Forecast, by Application 2019 & 2032
- Table 66: Japan Ophthalmology Diagnostics Industry Volume (K Unit) Forecast, by Application 2019 & 2032
- Table 67: India Ophthalmology Diagnostics Industry Revenue (Million) Forecast, by Application 2019 & 2032
- Table 68: India Ophthalmology Diagnostics Industry Volume (K Unit) Forecast, by Application 2019 & 2032
- Table 69: Australia Ophthalmology Diagnostics Industry Revenue (Million) Forecast, by Application 2019 & 2032
- Table 70: Australia Ophthalmology Diagnostics Industry Volume (K Unit) Forecast, by Application 2019 & 2032
- Table 71: South Korea Ophthalmology Diagnostics Industry Revenue (Million) Forecast, by Application 2019 & 2032
- Table 72: South Korea Ophthalmology Diagnostics Industry Volume (K Unit) Forecast, by Application 2019 & 2032
- Table 73: Rest of Asia Pacific Ophthalmology Diagnostics Industry Revenue (Million) Forecast, by Application 2019 & 2032
- Table 74: Rest of Asia Pacific Ophthalmology Diagnostics Industry Volume (K Unit) Forecast, by Application 2019 & 2032
- Table 75: Global Ophthalmology Diagnostics Industry Revenue Million Forecast, by Product 2019 & 2032
- Table 76: Global Ophthalmology Diagnostics Industry Volume K Unit Forecast, by Product 2019 & 2032
- Table 77: Global Ophthalmology Diagnostics Industry Revenue Million Forecast, by Application 2019 & 2032
- Table 78: Global Ophthalmology Diagnostics Industry Volume K Unit Forecast, by Application 2019 & 2032
- Table 79: Global Ophthalmology Diagnostics Industry Revenue Million Forecast, by End-user 2019 & 2032
- Table 80: Global Ophthalmology Diagnostics Industry Volume K Unit Forecast, by End-user 2019 & 2032
- Table 81: Global Ophthalmology Diagnostics Industry Revenue Million Forecast, by Country 2019 & 2032
- Table 82: Global Ophthalmology Diagnostics Industry Volume K Unit Forecast, by Country 2019 & 2032
- Table 83: GCC Ophthalmology Diagnostics Industry Revenue (Million) Forecast, by Application 2019 & 2032
- Table 84: GCC Ophthalmology Diagnostics Industry Volume (K Unit) Forecast, by Application 2019 & 2032
- Table 85: South Africa Ophthalmology Diagnostics Industry Revenue (Million) Forecast, by Application 2019 & 2032
- Table 86: South Africa Ophthalmology Diagnostics Industry Volume (K Unit) Forecast, by Application 2019 & 2032
- Table 87: Rest of Middle East and Africa Ophthalmology Diagnostics Industry Revenue (Million) Forecast, by Application 2019 & 2032
- Table 88: Rest of Middle East and Africa Ophthalmology Diagnostics Industry Volume (K Unit) Forecast, by Application 2019 & 2032
- Table 89: Global Ophthalmology Diagnostics Industry Revenue Million Forecast, by Product 2019 & 2032
- Table 90: Global Ophthalmology Diagnostics Industry Volume K Unit Forecast, by Product 2019 & 2032
- Table 91: Global Ophthalmology Diagnostics Industry Revenue Million Forecast, by Application 2019 & 2032
- Table 92: Global Ophthalmology Diagnostics Industry Volume K Unit Forecast, by Application 2019 & 2032
- Table 93: Global Ophthalmology Diagnostics Industry Revenue Million Forecast, by End-user 2019 & 2032
- Table 94: Global Ophthalmology Diagnostics Industry Volume K Unit Forecast, by End-user 2019 & 2032
- Table 95: Global Ophthalmology Diagnostics Industry Revenue Million Forecast, by Country 2019 & 2032
- Table 96: Global Ophthalmology Diagnostics Industry Volume K Unit Forecast, by Country 2019 & 2032
- Table 97: Brazil Ophthalmology Diagnostics Industry Revenue (Million) Forecast, by Application 2019 & 2032
- Table 98: Brazil Ophthalmology Diagnostics Industry Volume (K Unit) Forecast, by Application 2019 & 2032
- Table 99: Argentina Ophthalmology Diagnostics Industry Revenue (Million) Forecast, by Application 2019 & 2032
- Table 100: Argentina Ophthalmology Diagnostics Industry Volume (K Unit) Forecast, by Application 2019 & 2032
- Table 101: Rest of South America Ophthalmology Diagnostics Industry Revenue (Million) Forecast, by Application 2019 & 2032
- Table 102: Rest of South America Ophthalmology Diagnostics Industry Volume (K Unit) Forecast, by Application 2019 & 2032
Frequently Asked Questions
1. What is the projected Compound Annual Growth Rate (CAGR) of the Ophthalmology Diagnostics Industry?
The projected CAGR is approximately > 4.15%.
2. Which companies are prominent players in the Ophthalmology Diagnostics Industry?
Key companies in the market include Metall Zug Group, Carl Zeiss Meditec AG, Marco Ophthalmic Inc, EssilorLuxottica, Lumenis Ltd, Ziemer Ophthalmic Systems AG, Canon, Topcon Corporation, NIDEK CO LTD, Alcon Inc, Lumibird Group.
3. What are the main segments of the Ophthalmology Diagnostics Industry?
The market segments include Product, Application, End-user.
4. Can you provide details about the market size?
The market size is estimated to be USD XX Million as of 2022.
5. What are some drivers contributing to market growth?
Increased Global Incidence of Ophthalmic Disorders Coupled with Rise in Diabetes; Rise in Government Support to Control Visual Impairment and Rapid Advancements in the Ophthalmic Devices.
6. What are the notable trends driving market growth?
The Surgical Evaluation Segment is Expected to Hold a Significant Market Share in the Ophthalmic Diagnostics Market.
7. Are there any restraints impacting market growth?
Higher Cost of the Ophthalmic Devices and Treatment; Lack of Awareness and Skilled Ophthalmologists in Emerging Nations.
8. Can you provide examples of recent developments in the market?
July 2022- Sightsavers launched a mobile van under its National Truckers Eye Health Programme with Cholamandalam Investment and Finance Company Limited (Chola) support in Delhi-NCR. It provides eye care services to the truckers' community. The van has all the necessary tools and supplies, like an ophthalmoscope, a retinoscope, trial lenses, trial frames, a lensometer, vision charts, occluders, and a drum, for vision testing.
9. What pricing options are available for accessing the report?
Pricing options include single-user, multi-user, and enterprise licenses priced at USD 4750, USD 5250, and USD 8750 respectively.
10. Is the market size provided in terms of value or volume?
The market size is provided in terms of value, measured in Million and volume, measured in K Unit.
11. Are there any specific market keywords associated with the report?
Yes, the market keyword associated with the report is "Ophthalmology Diagnostics Industry," which aids in identifying and referencing the specific market segment covered.
12. How do I determine which pricing option suits my needs best?
The pricing options vary based on user requirements and access needs. Individual users may opt for single-user licenses, while businesses requiring broader access may choose multi-user or enterprise licenses for cost-effective access to the report.
13. Are there any additional resources or data provided in the Ophthalmology Diagnostics Industry report?
While the report offers comprehensive insights, it's advisable to review the specific contents or supplementary materials provided to ascertain if additional resources or data are available.
14. How can I stay updated on further developments or reports in the Ophthalmology Diagnostics Industry?
To stay informed about further developments, trends, and reports in the Ophthalmology Diagnostics Industry, consider subscribing to industry newsletters, following relevant companies and organizations, or regularly checking reputable industry news sources and publications.
Methodology
Step 1 - Identification of Relevant Samples Size from Population Database


Step 2 - Approaches for Defining Global Market Size (Value, Volume* & Price*)

Note*: In applicable scenarios
Step 3 - Data Sources
Primary Research
- Web Analytics
- Survey Reports
- Research Institute
- Latest Research Reports
- Opinion Leaders
Secondary Research
- Annual Reports
- White Paper
- Latest Press Release
- Industry Association
- Paid Database
- Investor Presentations

Step 4 - Data Triangulation
Involves using different sources of information in order to increase the validity of a study
These sources are likely to be stakeholders in a program - participants, other researchers, program staff, other community members, and so on.
Then we put all data in single framework & apply various statistical tools to find out the dynamic on the market.
During the analysis stage, feedback from the stakeholder groups would be compared to determine areas of agreement as well as areas of divergence


