
Key Insights
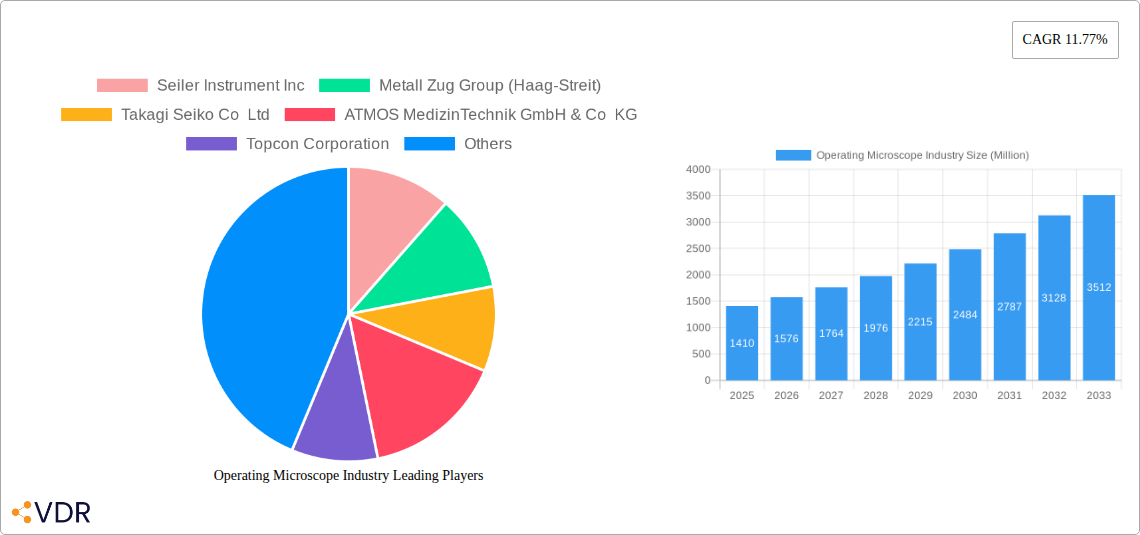
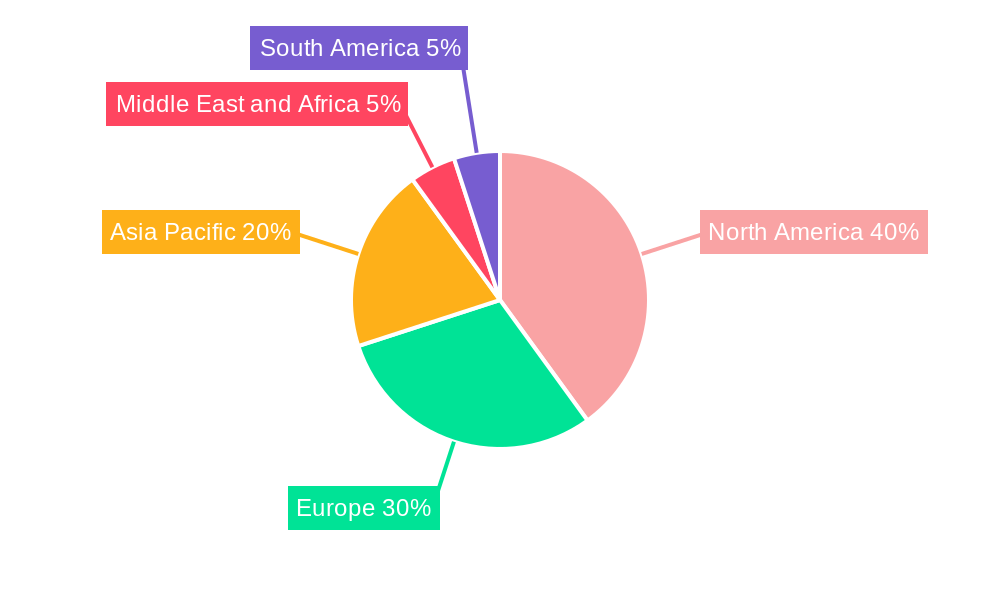
The global operating microscope market, valued at $1.41 billion in 2025, is projected to experience robust growth, exhibiting a compound annual growth rate (CAGR) of 11.77% from 2025 to 2033. This expansion is driven by several key factors. Technological advancements leading to enhanced image quality, improved ergonomics, and the integration of advanced features like 3D visualization and fluorescence imaging are significantly boosting adoption across various surgical specialties. The increasing prevalence of minimally invasive surgeries, particularly in ophthalmology, neurosurgery, and plastic surgery, fuels demand for precise and high-resolution imaging provided by operating microscopes. Furthermore, the growing geriatric population, coupled with a rise in chronic diseases requiring complex surgical interventions, contributes to market growth. The market is segmented by end-user (hospitals, ambulatory surgical centers, and other end-users) and application (dentistry, gynecology and urology, ENT, neurosurgery and spine surgery, ophthalmology, plastic and reconstructive surgery, and other applications). Hospitals represent the largest segment due to their extensive surgical procedures and investments in advanced medical technologies. Geographically, North America and Europe currently hold significant market shares, driven by high healthcare expenditure and technological adoption. However, the Asia-Pacific region is expected to witness the fastest growth owing to rising healthcare infrastructure development and increasing disposable incomes. Competitive landscape analysis reveals key players such as Seiler Instrument, Haag-Streit, Takagi Seiko, and Leica Microsystems actively engaged in product innovation and strategic partnerships to maintain their market positions.
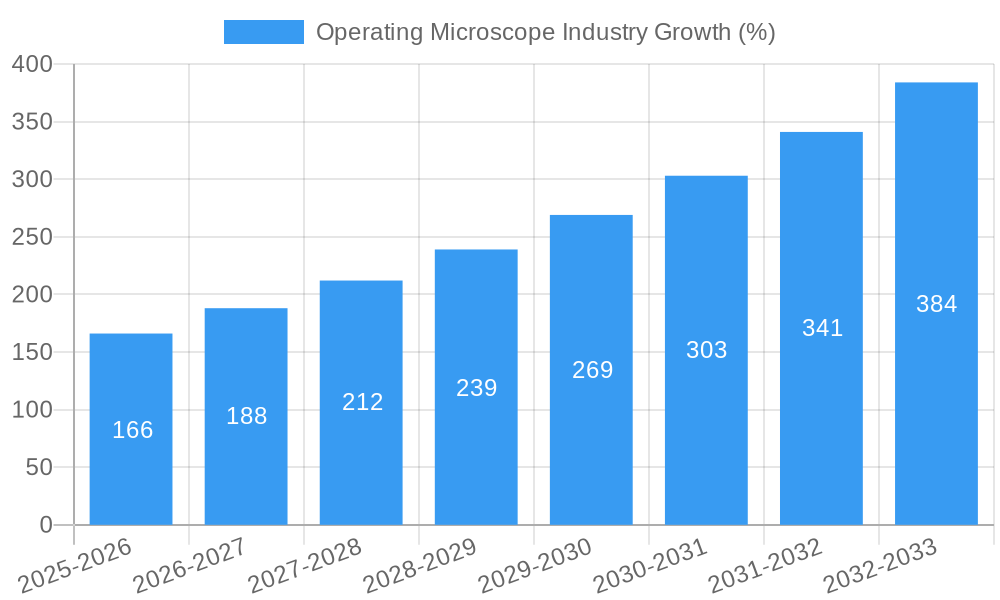
The sustained growth in the operating microscope market is expected to continue throughout the forecast period (2025-2033), driven by ongoing technological innovations and the increasing demand for minimally invasive procedures. Factors such as the rising cost of equipment and skilled personnel could pose some challenges. However, the advantages of enhanced precision, reduced invasiveness, and improved surgical outcomes are likely to outweigh these restraints. The ongoing development of integrated surgical systems, incorporating operating microscopes with other advanced technologies like robotic surgery systems and image-guided surgery platforms, offers substantial opportunities for growth. The market will likely see increasing competition, with both established players and emerging companies vying for market share through product differentiation, strategic acquisitions, and expansion into new geographical markets. The long-term outlook for the operating microscope market remains highly positive, reflecting the vital role of these devices in modern surgical practice.
Operating Microscope Industry Market Report: 2019-2033
This comprehensive report provides an in-depth analysis of the global operating microscope market, encompassing market dynamics, growth trends, regional segmentation, product landscape, key players, and future outlook. The report covers the period from 2019 to 2033, with a base year of 2025 and a forecast period of 2025-2033. This analysis will be invaluable for industry professionals, investors, and strategic decision-makers seeking to understand and capitalize on the opportunities within this dynamic sector. The market size is projected at xx Million units in 2025 and is expected to grow significantly over the forecast period.
Operating Microscope Industry Market Dynamics & Structure
The operating microscope market is characterized by a moderately concentrated landscape with several key players holding significant market share. Technological innovation, particularly in areas like image quality, integration with surgical robotics, and minimally invasive procedures, are driving substantial growth. Stringent regulatory frameworks governing medical devices influence market access and adoption. Competitive pressures from substitute technologies and the increasing demand for cost-effective solutions present challenges. End-user demographics, especially the aging global population and rise in chronic diseases, contribute to market expansion. Mergers and acquisitions (M&A) activity within the sector reflects ongoing consolidation and expansion strategies among key players.
- Market Concentration: The top 5 players account for approximately xx% of the global market share in 2025.
- Technological Innovation: Advancements in 3D imaging, fluorescence imaging, and digital image processing are key drivers.
- Regulatory Frameworks: Compliance with FDA, CE, and other regional regulations is crucial for market entry.
- Competitive Substitutes: Alternative surgical visualization techniques pose a degree of competitive pressure.
- M&A Trends: The past five years have seen xx M&A deals, indicating a trend towards consolidation.
Operating Microscope Industry Growth Trends & Insights
The operating microscope market witnessed robust growth from 2019 to 2024, driven by factors such as increasing surgical procedures, technological advancements, and rising healthcare expenditure. The market size expanded from xx Million units in 2019 to xx Million units in 2024, registering a CAGR of xx%. This growth is projected to continue, with a projected CAGR of xx% from 2025 to 2033, reaching xx Million units by 2033. Technological disruptions, such as the integration of AI and machine learning, are expected to significantly influence adoption rates and enhance surgical precision. Consumer behavior shifts, including increased demand for minimally invasive procedures, further fuel market expansion. Market penetration within developing economies remains significant untapped potential.
Dominant Regions, Countries, or Segments in Operating Microscope Industry
North America currently holds the largest market share, driven by factors such as advanced healthcare infrastructure, high adoption rates of advanced technologies, and substantial healthcare spending. Europe follows closely, showcasing strong growth potential. Within applications, ophthalmology, neurosurgery, and ENT segments contribute significantly to overall market growth. Hospitals remain the dominant end-users, owing to their established infrastructure and high surgical volumes. Ambulatory surgical centers are witnessing rapid growth as well.
- Key Regional Drivers:
- North America: High healthcare expenditure, advanced medical infrastructure.
- Europe: Growing adoption of minimally invasive surgical techniques.
- Asia-Pacific: Rising healthcare awareness and expanding healthcare infrastructure.
- Key Segment Drivers:
- Ophthalmology: Growing prevalence of age-related eye diseases.
- Neurosurgery: Increasing incidence of neurological disorders and trauma.
- Hospitals: High volume of surgical procedures.
Operating Microscope Industry Product Landscape
Operating microscopes are continuously evolving, incorporating advanced features like high-resolution imaging, integrated lighting systems, and ergonomic designs. These advancements enhance surgical precision, visualization, and surgeon comfort. Manufacturers are focusing on developing compact, portable, and cost-effective models to cater to various healthcare settings. Unique selling propositions often include superior image quality, enhanced maneuverability, and ease of integration with other surgical equipment.
Key Drivers, Barriers & Challenges in Operating Microscope Industry
Key Drivers:
- Technological advancements such as 3D imaging, AI integration, and improved ergonomics.
- Growing prevalence of chronic diseases requiring surgical intervention.
- Rising healthcare expenditure and investments in healthcare infrastructure.
Challenges:
- High initial investment costs for advanced models.
- Stringent regulatory approvals and compliance requirements.
- Intense competition among established players and emerging market entrants.
Emerging Opportunities in Operating Microscope Industry
- Expansion into untapped markets in developing economies.
- Development of specialized microscopes for specific surgical procedures.
- Integration with robotics and other advanced surgical technologies.
Growth Accelerators in the Operating Microscope Industry Industry
Technological breakthroughs, particularly in image processing and integration with AI and robotics, are poised to dramatically reshape the operating microscope landscape. Strategic partnerships between microscope manufacturers and surgical robotics companies will create highly integrated and efficient surgical solutions. Expansion into emerging markets with growing healthcare infrastructure represents significant untapped potential.
Key Players Shaping the Operating Microscope Industry Market
- Seiler Instrument Inc
- Metall Zug Group (Haag-Streit)
- Takagi Seiko Co Ltd
- ATMOS MedizinTechnik GmbH & Co KG
- Topcon Corporation
- Avante Health Solutions
- ARI Medical Technology Co Ltd
- Danaher Corporation (Leica Microsystems)
- Synaptive Medical
- Carl Zeiss AG
- Labomed Inc
- Alltion (Wuzhou) Co Ltd
- Alcon Inc
- Olympus Corporation
- Optofine Instruments Pvt Ltd
Notable Milestones in Operating Microscope Industry Sector
- March 2023: The Joseph N France General Hospital acquired a Leica M690 Surgical Operating Microscope System, signifying a trend toward adoption of advanced technology.
- January 2023: Leica Microsystems expanded its distribution network with DB Surgical, Inc., signifying market expansion strategies.
In-Depth Operating Microscope Industry Market Outlook
The operating microscope market is poised for sustained growth, driven by ongoing technological advancements, increasing surgical procedures, and rising healthcare expenditure globally. Strategic partnerships, product innovation, and market expansion initiatives will be key drivers of future market potential. The market offers substantial opportunities for both established players and new entrants, particularly within specialized applications and emerging economies.
Operating Microscope Industry Segmentation
-
1. Application
- 1.1. Dentistry
- 1.2. Gynecology and Urology
- 1.3. Ear, Nose, and Throat (ENT)
- 1.4. Neurosurgery and Spine Surgery
- 1.5. Ophthalmology
- 1.6. Plastic and Reconstructive Surgery
- 1.7. Other Applications
-
2. End User
- 2.1. Hospitals
- 2.2. Ambulatory Surgical Centers
- 2.3. Other End Users
Operating Microscope Industry Segmentation By Geography
-
1. North America
- 1.1. United States
- 1.2. Canada
- 1.3. Mexico
-
2. Europe
- 2.1. Germany
- 2.2. United Kingdom
- 2.3. France
- 2.4. Italy
- 2.5. Spain
- 2.6. Rest of Europe
-
3. Asia Pacific
- 3.1. China
- 3.2. Japan
- 3.3. India
- 3.4. Australia
- 3.5. South Korea
- 3.6. Rest of Asia Pacific
-
4. Middle East and Africa
- 4.1. GCC
- 4.2. South Africa
- 4.3. Rest of Middle East and Africa
-
5. South America
- 5.1. Brazil
- 5.2. Argentina
- 5.3. Rest of South America
Operating Microscope Industry REPORT HIGHLIGHTS
| Aspects | Details |
|---|---|
| Study Period | 2019-2033 |
| Base Year | 2024 |
| Estimated Year | 2025 |
| Forecast Period | 2025-2033 |
| Historical Period | 2019-2024 |
| Growth Rate | CAGR of 11.77% from 2019-2033 |
| Segmentation |
|
Table of Contents
- 1. Introduction
- 1.1. Research Scope
- 1.2. Market Segmentation
- 1.3. Research Methodology
- 1.4. Definitions and Assumptions
- 2. Executive Summary
- 2.1. Introduction
- 3. Market Dynamics
- 3.1. Introduction
- 3.2. Market Drivers
- 3.2.1. Increasing Adoption of Minimally Invasive Surgeries; Rising Geriatric Population and Burden of Chronic Diseases; Technological Advancements in Surgical Microscopes
- 3.3. Market Restrains
- 3.3.1. Lack of Skilled Professionals; Low Acceptance Owing to High Costs
- 3.4. Market Trends
- 3.4.1. Ophthalmology Segment is Expected to Hold a Largest Share in the Market Over the Forecast Period
- 4. Market Factor Analysis
- 4.1. Porters Five Forces
- 4.2. Supply/Value Chain
- 4.3. PESTEL analysis
- 4.4. Market Entropy
- 4.5. Patent/Trademark Analysis
- 5. Global Operating Microscope Industry Analysis, Insights and Forecast, 2019-2031
- 5.1. Market Analysis, Insights and Forecast - by Application
- 5.1.1. Dentistry
- 5.1.2. Gynecology and Urology
- 5.1.3. Ear, Nose, and Throat (ENT)
- 5.1.4. Neurosurgery and Spine Surgery
- 5.1.5. Ophthalmology
- 5.1.6. Plastic and Reconstructive Surgery
- 5.1.7. Other Applications
- 5.2. Market Analysis, Insights and Forecast - by End User
- 5.2.1. Hospitals
- 5.2.2. Ambulatory Surgical Centers
- 5.2.3. Other End Users
- 5.3. Market Analysis, Insights and Forecast - by Region
- 5.3.1. North America
- 5.3.2. Europe
- 5.3.3. Asia Pacific
- 5.3.4. Middle East and Africa
- 5.3.5. South America
- 5.1. Market Analysis, Insights and Forecast - by Application
- 6. North America Operating Microscope Industry Analysis, Insights and Forecast, 2019-2031
- 6.1. Market Analysis, Insights and Forecast - by Application
- 6.1.1. Dentistry
- 6.1.2. Gynecology and Urology
- 6.1.3. Ear, Nose, and Throat (ENT)
- 6.1.4. Neurosurgery and Spine Surgery
- 6.1.5. Ophthalmology
- 6.1.6. Plastic and Reconstructive Surgery
- 6.1.7. Other Applications
- 6.2. Market Analysis, Insights and Forecast - by End User
- 6.2.1. Hospitals
- 6.2.2. Ambulatory Surgical Centers
- 6.2.3. Other End Users
- 6.1. Market Analysis, Insights and Forecast - by Application
- 7. Europe Operating Microscope Industry Analysis, Insights and Forecast, 2019-2031
- 7.1. Market Analysis, Insights and Forecast - by Application
- 7.1.1. Dentistry
- 7.1.2. Gynecology and Urology
- 7.1.3. Ear, Nose, and Throat (ENT)
- 7.1.4. Neurosurgery and Spine Surgery
- 7.1.5. Ophthalmology
- 7.1.6. Plastic and Reconstructive Surgery
- 7.1.7. Other Applications
- 7.2. Market Analysis, Insights and Forecast - by End User
- 7.2.1. Hospitals
- 7.2.2. Ambulatory Surgical Centers
- 7.2.3. Other End Users
- 7.1. Market Analysis, Insights and Forecast - by Application
- 8. Asia Pacific Operating Microscope Industry Analysis, Insights and Forecast, 2019-2031
- 8.1. Market Analysis, Insights and Forecast - by Application
- 8.1.1. Dentistry
- 8.1.2. Gynecology and Urology
- 8.1.3. Ear, Nose, and Throat (ENT)
- 8.1.4. Neurosurgery and Spine Surgery
- 8.1.5. Ophthalmology
- 8.1.6. Plastic and Reconstructive Surgery
- 8.1.7. Other Applications
- 8.2. Market Analysis, Insights and Forecast - by End User
- 8.2.1. Hospitals
- 8.2.2. Ambulatory Surgical Centers
- 8.2.3. Other End Users
- 8.1. Market Analysis, Insights and Forecast - by Application
- 9. Middle East and Africa Operating Microscope Industry Analysis, Insights and Forecast, 2019-2031
- 9.1. Market Analysis, Insights and Forecast - by Application
- 9.1.1. Dentistry
- 9.1.2. Gynecology and Urology
- 9.1.3. Ear, Nose, and Throat (ENT)
- 9.1.4. Neurosurgery and Spine Surgery
- 9.1.5. Ophthalmology
- 9.1.6. Plastic and Reconstructive Surgery
- 9.1.7. Other Applications
- 9.2. Market Analysis, Insights and Forecast - by End User
- 9.2.1. Hospitals
- 9.2.2. Ambulatory Surgical Centers
- 9.2.3. Other End Users
- 9.1. Market Analysis, Insights and Forecast - by Application
- 10. South America Operating Microscope Industry Analysis, Insights and Forecast, 2019-2031
- 10.1. Market Analysis, Insights and Forecast - by Application
- 10.1.1. Dentistry
- 10.1.2. Gynecology and Urology
- 10.1.3. Ear, Nose, and Throat (ENT)
- 10.1.4. Neurosurgery and Spine Surgery
- 10.1.5. Ophthalmology
- 10.1.6. Plastic and Reconstructive Surgery
- 10.1.7. Other Applications
- 10.2. Market Analysis, Insights and Forecast - by End User
- 10.2.1. Hospitals
- 10.2.2. Ambulatory Surgical Centers
- 10.2.3. Other End Users
- 10.1. Market Analysis, Insights and Forecast - by Application
- 11. North America Operating Microscope Industry Analysis, Insights and Forecast, 2019-2031
- 11.1. Market Analysis, Insights and Forecast - By Country/Sub-region
- 11.1.1. undefined
- 12. Europe Operating Microscope Industry Analysis, Insights and Forecast, 2019-2031
- 12.1. Market Analysis, Insights and Forecast - By Country/Sub-region
- 12.1.1. undefined
- 13. Asia Pacific Operating Microscope Industry Analysis, Insights and Forecast, 2019-2031
- 13.1. Market Analysis, Insights and Forecast - By Country/Sub-region
- 13.1.1. undefined
- 14. Middle East and Africa Operating Microscope Industry Analysis, Insights and Forecast, 2019-2031
- 14.1. Market Analysis, Insights and Forecast - By Country/Sub-region
- 14.1.1. undefined
- 15. South America Operating Microscope Industry Analysis, Insights and Forecast, 2019-2031
- 15.1. Market Analysis, Insights and Forecast - By Country/Sub-region
- 15.1.1. undefined
- 16. Competitive Analysis
- 16.1. Global Market Share Analysis 2024
- 16.2. Company Profiles
- 16.2.1 Seiler Instrument Inc
- 16.2.1.1. Overview
- 16.2.1.2. Products
- 16.2.1.3. SWOT Analysis
- 16.2.1.4. Recent Developments
- 16.2.1.5. Financials (Based on Availability)
- 16.2.2 Metall Zug Group (Haag-Streit)
- 16.2.2.1. Overview
- 16.2.2.2. Products
- 16.2.2.3. SWOT Analysis
- 16.2.2.4. Recent Developments
- 16.2.2.5. Financials (Based on Availability)
- 16.2.3 Takagi Seiko Co Ltd
- 16.2.3.1. Overview
- 16.2.3.2. Products
- 16.2.3.3. SWOT Analysis
- 16.2.3.4. Recent Developments
- 16.2.3.5. Financials (Based on Availability)
- 16.2.4 ATMOS MedizinTechnik GmbH & Co KG
- 16.2.4.1. Overview
- 16.2.4.2. Products
- 16.2.4.3. SWOT Analysis
- 16.2.4.4. Recent Developments
- 16.2.4.5. Financials (Based on Availability)
- 16.2.5 Topcon Corporation
- 16.2.5.1. Overview
- 16.2.5.2. Products
- 16.2.5.3. SWOT Analysis
- 16.2.5.4. Recent Developments
- 16.2.5.5. Financials (Based on Availability)
- 16.2.6 Avante Health Solutions
- 16.2.6.1. Overview
- 16.2.6.2. Products
- 16.2.6.3. SWOT Analysis
- 16.2.6.4. Recent Developments
- 16.2.6.5. Financials (Based on Availability)
- 16.2.7 ARI Medical Technology Co Ltd
- 16.2.7.1. Overview
- 16.2.7.2. Products
- 16.2.7.3. SWOT Analysis
- 16.2.7.4. Recent Developments
- 16.2.7.5. Financials (Based on Availability)
- 16.2.8 Danaher Corporation (Leica Microsystems)
- 16.2.8.1. Overview
- 16.2.8.2. Products
- 16.2.8.3. SWOT Analysis
- 16.2.8.4. Recent Developments
- 16.2.8.5. Financials (Based on Availability)
- 16.2.9 Synaptive Medical
- 16.2.9.1. Overview
- 16.2.9.2. Products
- 16.2.9.3. SWOT Analysis
- 16.2.9.4. Recent Developments
- 16.2.9.5. Financials (Based on Availability)
- 16.2.10 Carl Zeiss AG
- 16.2.10.1. Overview
- 16.2.10.2. Products
- 16.2.10.3. SWOT Analysis
- 16.2.10.4. Recent Developments
- 16.2.10.5. Financials (Based on Availability)
- 16.2.11 Labomed Inc
- 16.2.11.1. Overview
- 16.2.11.2. Products
- 16.2.11.3. SWOT Analysis
- 16.2.11.4. Recent Developments
- 16.2.11.5. Financials (Based on Availability)
- 16.2.12 Alltion (Wuzhou) Co Ltd
- 16.2.12.1. Overview
- 16.2.12.2. Products
- 16.2.12.3. SWOT Analysis
- 16.2.12.4. Recent Developments
- 16.2.12.5. Financials (Based on Availability)
- 16.2.13 Alcon Inc
- 16.2.13.1. Overview
- 16.2.13.2. Products
- 16.2.13.3. SWOT Analysis
- 16.2.13.4. Recent Developments
- 16.2.13.5. Financials (Based on Availability)
- 16.2.14 Olympus Corporation
- 16.2.14.1. Overview
- 16.2.14.2. Products
- 16.2.14.3. SWOT Analysis
- 16.2.14.4. Recent Developments
- 16.2.14.5. Financials (Based on Availability)
- 16.2.15 Optofine Instruments Pvt Ltd
- 16.2.15.1. Overview
- 16.2.15.2. Products
- 16.2.15.3. SWOT Analysis
- 16.2.15.4. Recent Developments
- 16.2.15.5. Financials (Based on Availability)
- 16.2.1 Seiler Instrument Inc
List of Figures
- Figure 1: Global Operating Microscope Industry Revenue Breakdown (Million, %) by Region 2024 & 2032
- Figure 2: Global Operating Microscope Industry Volume Breakdown (K Unit, %) by Region 2024 & 2032
- Figure 3: North America Operating Microscope Industry Revenue (Million), by Country 2024 & 2032
- Figure 4: North America Operating Microscope Industry Volume (K Unit), by Country 2024 & 2032
- Figure 5: North America Operating Microscope Industry Revenue Share (%), by Country 2024 & 2032
- Figure 6: North America Operating Microscope Industry Volume Share (%), by Country 2024 & 2032
- Figure 7: Europe Operating Microscope Industry Revenue (Million), by Country 2024 & 2032
- Figure 8: Europe Operating Microscope Industry Volume (K Unit), by Country 2024 & 2032
- Figure 9: Europe Operating Microscope Industry Revenue Share (%), by Country 2024 & 2032
- Figure 10: Europe Operating Microscope Industry Volume Share (%), by Country 2024 & 2032
- Figure 11: Asia Pacific Operating Microscope Industry Revenue (Million), by Country 2024 & 2032
- Figure 12: Asia Pacific Operating Microscope Industry Volume (K Unit), by Country 2024 & 2032
- Figure 13: Asia Pacific Operating Microscope Industry Revenue Share (%), by Country 2024 & 2032
- Figure 14: Asia Pacific Operating Microscope Industry Volume Share (%), by Country 2024 & 2032
- Figure 15: Middle East and Africa Operating Microscope Industry Revenue (Million), by Country 2024 & 2032
- Figure 16: Middle East and Africa Operating Microscope Industry Volume (K Unit), by Country 2024 & 2032
- Figure 17: Middle East and Africa Operating Microscope Industry Revenue Share (%), by Country 2024 & 2032
- Figure 18: Middle East and Africa Operating Microscope Industry Volume Share (%), by Country 2024 & 2032
- Figure 19: South America Operating Microscope Industry Revenue (Million), by Country 2024 & 2032
- Figure 20: South America Operating Microscope Industry Volume (K Unit), by Country 2024 & 2032
- Figure 21: South America Operating Microscope Industry Revenue Share (%), by Country 2024 & 2032
- Figure 22: South America Operating Microscope Industry Volume Share (%), by Country 2024 & 2032
- Figure 23: North America Operating Microscope Industry Revenue (Million), by Application 2024 & 2032
- Figure 24: North America Operating Microscope Industry Volume (K Unit), by Application 2024 & 2032
- Figure 25: North America Operating Microscope Industry Revenue Share (%), by Application 2024 & 2032
- Figure 26: North America Operating Microscope Industry Volume Share (%), by Application 2024 & 2032
- Figure 27: North America Operating Microscope Industry Revenue (Million), by End User 2024 & 2032
- Figure 28: North America Operating Microscope Industry Volume (K Unit), by End User 2024 & 2032
- Figure 29: North America Operating Microscope Industry Revenue Share (%), by End User 2024 & 2032
- Figure 30: North America Operating Microscope Industry Volume Share (%), by End User 2024 & 2032
- Figure 31: North America Operating Microscope Industry Revenue (Million), by Country 2024 & 2032
- Figure 32: North America Operating Microscope Industry Volume (K Unit), by Country 2024 & 2032
- Figure 33: North America Operating Microscope Industry Revenue Share (%), by Country 2024 & 2032
- Figure 34: North America Operating Microscope Industry Volume Share (%), by Country 2024 & 2032
- Figure 35: Europe Operating Microscope Industry Revenue (Million), by Application 2024 & 2032
- Figure 36: Europe Operating Microscope Industry Volume (K Unit), by Application 2024 & 2032
- Figure 37: Europe Operating Microscope Industry Revenue Share (%), by Application 2024 & 2032
- Figure 38: Europe Operating Microscope Industry Volume Share (%), by Application 2024 & 2032
- Figure 39: Europe Operating Microscope Industry Revenue (Million), by End User 2024 & 2032
- Figure 40: Europe Operating Microscope Industry Volume (K Unit), by End User 2024 & 2032
- Figure 41: Europe Operating Microscope Industry Revenue Share (%), by End User 2024 & 2032
- Figure 42: Europe Operating Microscope Industry Volume Share (%), by End User 2024 & 2032
- Figure 43: Europe Operating Microscope Industry Revenue (Million), by Country 2024 & 2032
- Figure 44: Europe Operating Microscope Industry Volume (K Unit), by Country 2024 & 2032
- Figure 45: Europe Operating Microscope Industry Revenue Share (%), by Country 2024 & 2032
- Figure 46: Europe Operating Microscope Industry Volume Share (%), by Country 2024 & 2032
- Figure 47: Asia Pacific Operating Microscope Industry Revenue (Million), by Application 2024 & 2032
- Figure 48: Asia Pacific Operating Microscope Industry Volume (K Unit), by Application 2024 & 2032
- Figure 49: Asia Pacific Operating Microscope Industry Revenue Share (%), by Application 2024 & 2032
- Figure 50: Asia Pacific Operating Microscope Industry Volume Share (%), by Application 2024 & 2032
- Figure 51: Asia Pacific Operating Microscope Industry Revenue (Million), by End User 2024 & 2032
- Figure 52: Asia Pacific Operating Microscope Industry Volume (K Unit), by End User 2024 & 2032
- Figure 53: Asia Pacific Operating Microscope Industry Revenue Share (%), by End User 2024 & 2032
- Figure 54: Asia Pacific Operating Microscope Industry Volume Share (%), by End User 2024 & 2032
- Figure 55: Asia Pacific Operating Microscope Industry Revenue (Million), by Country 2024 & 2032
- Figure 56: Asia Pacific Operating Microscope Industry Volume (K Unit), by Country 2024 & 2032
- Figure 57: Asia Pacific Operating Microscope Industry Revenue Share (%), by Country 2024 & 2032
- Figure 58: Asia Pacific Operating Microscope Industry Volume Share (%), by Country 2024 & 2032
- Figure 59: Middle East and Africa Operating Microscope Industry Revenue (Million), by Application 2024 & 2032
- Figure 60: Middle East and Africa Operating Microscope Industry Volume (K Unit), by Application 2024 & 2032
- Figure 61: Middle East and Africa Operating Microscope Industry Revenue Share (%), by Application 2024 & 2032
- Figure 62: Middle East and Africa Operating Microscope Industry Volume Share (%), by Application 2024 & 2032
- Figure 63: Middle East and Africa Operating Microscope Industry Revenue (Million), by End User 2024 & 2032
- Figure 64: Middle East and Africa Operating Microscope Industry Volume (K Unit), by End User 2024 & 2032
- Figure 65: Middle East and Africa Operating Microscope Industry Revenue Share (%), by End User 2024 & 2032
- Figure 66: Middle East and Africa Operating Microscope Industry Volume Share (%), by End User 2024 & 2032
- Figure 67: Middle East and Africa Operating Microscope Industry Revenue (Million), by Country 2024 & 2032
- Figure 68: Middle East and Africa Operating Microscope Industry Volume (K Unit), by Country 2024 & 2032
- Figure 69: Middle East and Africa Operating Microscope Industry Revenue Share (%), by Country 2024 & 2032
- Figure 70: Middle East and Africa Operating Microscope Industry Volume Share (%), by Country 2024 & 2032
- Figure 71: South America Operating Microscope Industry Revenue (Million), by Application 2024 & 2032
- Figure 72: South America Operating Microscope Industry Volume (K Unit), by Application 2024 & 2032
- Figure 73: South America Operating Microscope Industry Revenue Share (%), by Application 2024 & 2032
- Figure 74: South America Operating Microscope Industry Volume Share (%), by Application 2024 & 2032
- Figure 75: South America Operating Microscope Industry Revenue (Million), by End User 2024 & 2032
- Figure 76: South America Operating Microscope Industry Volume (K Unit), by End User 2024 & 2032
- Figure 77: South America Operating Microscope Industry Revenue Share (%), by End User 2024 & 2032
- Figure 78: South America Operating Microscope Industry Volume Share (%), by End User 2024 & 2032
- Figure 79: South America Operating Microscope Industry Revenue (Million), by Country 2024 & 2032
- Figure 80: South America Operating Microscope Industry Volume (K Unit), by Country 2024 & 2032
- Figure 81: South America Operating Microscope Industry Revenue Share (%), by Country 2024 & 2032
- Figure 82: South America Operating Microscope Industry Volume Share (%), by Country 2024 & 2032
List of Tables
- Table 1: Global Operating Microscope Industry Revenue Million Forecast, by Region 2019 & 2032
- Table 2: Global Operating Microscope Industry Volume K Unit Forecast, by Region 2019 & 2032
- Table 3: Global Operating Microscope Industry Revenue Million Forecast, by Application 2019 & 2032
- Table 4: Global Operating Microscope Industry Volume K Unit Forecast, by Application 2019 & 2032
- Table 5: Global Operating Microscope Industry Revenue Million Forecast, by End User 2019 & 2032
- Table 6: Global Operating Microscope Industry Volume K Unit Forecast, by End User 2019 & 2032
- Table 7: Global Operating Microscope Industry Revenue Million Forecast, by Region 2019 & 2032
- Table 8: Global Operating Microscope Industry Volume K Unit Forecast, by Region 2019 & 2032
- Table 9: Global Operating Microscope Industry Revenue Million Forecast, by Country 2019 & 2032
- Table 10: Global Operating Microscope Industry Volume K Unit Forecast, by Country 2019 & 2032
- Table 11: Global Operating Microscope Industry Revenue Million Forecast, by Country 2019 & 2032
- Table 12: Global Operating Microscope Industry Volume K Unit Forecast, by Country 2019 & 2032
- Table 13: Global Operating Microscope Industry Revenue Million Forecast, by Country 2019 & 2032
- Table 14: Global Operating Microscope Industry Volume K Unit Forecast, by Country 2019 & 2032
- Table 15: Global Operating Microscope Industry Revenue Million Forecast, by Country 2019 & 2032
- Table 16: Global Operating Microscope Industry Volume K Unit Forecast, by Country 2019 & 2032
- Table 17: Global Operating Microscope Industry Revenue Million Forecast, by Country 2019 & 2032
- Table 18: Global Operating Microscope Industry Volume K Unit Forecast, by Country 2019 & 2032
- Table 19: Global Operating Microscope Industry Revenue Million Forecast, by Application 2019 & 2032
- Table 20: Global Operating Microscope Industry Volume K Unit Forecast, by Application 2019 & 2032
- Table 21: Global Operating Microscope Industry Revenue Million Forecast, by End User 2019 & 2032
- Table 22: Global Operating Microscope Industry Volume K Unit Forecast, by End User 2019 & 2032
- Table 23: Global Operating Microscope Industry Revenue Million Forecast, by Country 2019 & 2032
- Table 24: Global Operating Microscope Industry Volume K Unit Forecast, by Country 2019 & 2032
- Table 25: United States Operating Microscope Industry Revenue (Million) Forecast, by Application 2019 & 2032
- Table 26: United States Operating Microscope Industry Volume (K Unit) Forecast, by Application 2019 & 2032
- Table 27: Canada Operating Microscope Industry Revenue (Million) Forecast, by Application 2019 & 2032
- Table 28: Canada Operating Microscope Industry Volume (K Unit) Forecast, by Application 2019 & 2032
- Table 29: Mexico Operating Microscope Industry Revenue (Million) Forecast, by Application 2019 & 2032
- Table 30: Mexico Operating Microscope Industry Volume (K Unit) Forecast, by Application 2019 & 2032
- Table 31: Global Operating Microscope Industry Revenue Million Forecast, by Application 2019 & 2032
- Table 32: Global Operating Microscope Industry Volume K Unit Forecast, by Application 2019 & 2032
- Table 33: Global Operating Microscope Industry Revenue Million Forecast, by End User 2019 & 2032
- Table 34: Global Operating Microscope Industry Volume K Unit Forecast, by End User 2019 & 2032
- Table 35: Global Operating Microscope Industry Revenue Million Forecast, by Country 2019 & 2032
- Table 36: Global Operating Microscope Industry Volume K Unit Forecast, by Country 2019 & 2032
- Table 37: Germany Operating Microscope Industry Revenue (Million) Forecast, by Application 2019 & 2032
- Table 38: Germany Operating Microscope Industry Volume (K Unit) Forecast, by Application 2019 & 2032
- Table 39: United Kingdom Operating Microscope Industry Revenue (Million) Forecast, by Application 2019 & 2032
- Table 40: United Kingdom Operating Microscope Industry Volume (K Unit) Forecast, by Application 2019 & 2032
- Table 41: France Operating Microscope Industry Revenue (Million) Forecast, by Application 2019 & 2032
- Table 42: France Operating Microscope Industry Volume (K Unit) Forecast, by Application 2019 & 2032
- Table 43: Italy Operating Microscope Industry Revenue (Million) Forecast, by Application 2019 & 2032
- Table 44: Italy Operating Microscope Industry Volume (K Unit) Forecast, by Application 2019 & 2032
- Table 45: Spain Operating Microscope Industry Revenue (Million) Forecast, by Application 2019 & 2032
- Table 46: Spain Operating Microscope Industry Volume (K Unit) Forecast, by Application 2019 & 2032
- Table 47: Rest of Europe Operating Microscope Industry Revenue (Million) Forecast, by Application 2019 & 2032
- Table 48: Rest of Europe Operating Microscope Industry Volume (K Unit) Forecast, by Application 2019 & 2032
- Table 49: Global Operating Microscope Industry Revenue Million Forecast, by Application 2019 & 2032
- Table 50: Global Operating Microscope Industry Volume K Unit Forecast, by Application 2019 & 2032
- Table 51: Global Operating Microscope Industry Revenue Million Forecast, by End User 2019 & 2032
- Table 52: Global Operating Microscope Industry Volume K Unit Forecast, by End User 2019 & 2032
- Table 53: Global Operating Microscope Industry Revenue Million Forecast, by Country 2019 & 2032
- Table 54: Global Operating Microscope Industry Volume K Unit Forecast, by Country 2019 & 2032
- Table 55: China Operating Microscope Industry Revenue (Million) Forecast, by Application 2019 & 2032
- Table 56: China Operating Microscope Industry Volume (K Unit) Forecast, by Application 2019 & 2032
- Table 57: Japan Operating Microscope Industry Revenue (Million) Forecast, by Application 2019 & 2032
- Table 58: Japan Operating Microscope Industry Volume (K Unit) Forecast, by Application 2019 & 2032
- Table 59: India Operating Microscope Industry Revenue (Million) Forecast, by Application 2019 & 2032
- Table 60: India Operating Microscope Industry Volume (K Unit) Forecast, by Application 2019 & 2032
- Table 61: Australia Operating Microscope Industry Revenue (Million) Forecast, by Application 2019 & 2032
- Table 62: Australia Operating Microscope Industry Volume (K Unit) Forecast, by Application 2019 & 2032
- Table 63: South Korea Operating Microscope Industry Revenue (Million) Forecast, by Application 2019 & 2032
- Table 64: South Korea Operating Microscope Industry Volume (K Unit) Forecast, by Application 2019 & 2032
- Table 65: Rest of Asia Pacific Operating Microscope Industry Revenue (Million) Forecast, by Application 2019 & 2032
- Table 66: Rest of Asia Pacific Operating Microscope Industry Volume (K Unit) Forecast, by Application 2019 & 2032
- Table 67: Global Operating Microscope Industry Revenue Million Forecast, by Application 2019 & 2032
- Table 68: Global Operating Microscope Industry Volume K Unit Forecast, by Application 2019 & 2032
- Table 69: Global Operating Microscope Industry Revenue Million Forecast, by End User 2019 & 2032
- Table 70: Global Operating Microscope Industry Volume K Unit Forecast, by End User 2019 & 2032
- Table 71: Global Operating Microscope Industry Revenue Million Forecast, by Country 2019 & 2032
- Table 72: Global Operating Microscope Industry Volume K Unit Forecast, by Country 2019 & 2032
- Table 73: GCC Operating Microscope Industry Revenue (Million) Forecast, by Application 2019 & 2032
- Table 74: GCC Operating Microscope Industry Volume (K Unit) Forecast, by Application 2019 & 2032
- Table 75: South Africa Operating Microscope Industry Revenue (Million) Forecast, by Application 2019 & 2032
- Table 76: South Africa Operating Microscope Industry Volume (K Unit) Forecast, by Application 2019 & 2032
- Table 77: Rest of Middle East and Africa Operating Microscope Industry Revenue (Million) Forecast, by Application 2019 & 2032
- Table 78: Rest of Middle East and Africa Operating Microscope Industry Volume (K Unit) Forecast, by Application 2019 & 2032
- Table 79: Global Operating Microscope Industry Revenue Million Forecast, by Application 2019 & 2032
- Table 80: Global Operating Microscope Industry Volume K Unit Forecast, by Application 2019 & 2032
- Table 81: Global Operating Microscope Industry Revenue Million Forecast, by End User 2019 & 2032
- Table 82: Global Operating Microscope Industry Volume K Unit Forecast, by End User 2019 & 2032
- Table 83: Global Operating Microscope Industry Revenue Million Forecast, by Country 2019 & 2032
- Table 84: Global Operating Microscope Industry Volume K Unit Forecast, by Country 2019 & 2032
- Table 85: Brazil Operating Microscope Industry Revenue (Million) Forecast, by Application 2019 & 2032
- Table 86: Brazil Operating Microscope Industry Volume (K Unit) Forecast, by Application 2019 & 2032
- Table 87: Argentina Operating Microscope Industry Revenue (Million) Forecast, by Application 2019 & 2032
- Table 88: Argentina Operating Microscope Industry Volume (K Unit) Forecast, by Application 2019 & 2032
- Table 89: Rest of South America Operating Microscope Industry Revenue (Million) Forecast, by Application 2019 & 2032
- Table 90: Rest of South America Operating Microscope Industry Volume (K Unit) Forecast, by Application 2019 & 2032
Frequently Asked Questions
1. What is the projected Compound Annual Growth Rate (CAGR) of the Operating Microscope Industry?
The projected CAGR is approximately 11.77%.
2. Which companies are prominent players in the Operating Microscope Industry?
Key companies in the market include Seiler Instrument Inc, Metall Zug Group (Haag-Streit), Takagi Seiko Co Ltd, ATMOS MedizinTechnik GmbH & Co KG, Topcon Corporation, Avante Health Solutions, ARI Medical Technology Co Ltd, Danaher Corporation (Leica Microsystems), Synaptive Medical, Carl Zeiss AG, Labomed Inc, Alltion (Wuzhou) Co Ltd, Alcon Inc, Olympus Corporation, Optofine Instruments Pvt Ltd.
3. What are the main segments of the Operating Microscope Industry?
The market segments include Application, End User.
4. Can you provide details about the market size?
The market size is estimated to be USD 1.41 Million as of 2022.
5. What are some drivers contributing to market growth?
Increasing Adoption of Minimally Invasive Surgeries; Rising Geriatric Population and Burden of Chronic Diseases; Technological Advancements in Surgical Microscopes.
6. What are the notable trends driving market growth?
Ophthalmology Segment is Expected to Hold a Largest Share in the Market Over the Forecast Period.
7. Are there any restraints impacting market growth?
Lack of Skilled Professionals; Low Acceptance Owing to High Costs.
8. Can you provide examples of recent developments in the market?
March 2023: The Joseph N France General Hospital acquired a Leica M690 Surgical Operating Microscope System. This cutting-edge technology is set to revolutionize the surgical procedures performed at the hospital, leading to improved patient care and outcomes.
9. What pricing options are available for accessing the report?
Pricing options include single-user, multi-user, and enterprise licenses priced at USD 4750, USD 5250, and USD 8750 respectively.
10. Is the market size provided in terms of value or volume?
The market size is provided in terms of value, measured in Million and volume, measured in K Unit.
11. Are there any specific market keywords associated with the report?
Yes, the market keyword associated with the report is "Operating Microscope Industry," which aids in identifying and referencing the specific market segment covered.
12. How do I determine which pricing option suits my needs best?
The pricing options vary based on user requirements and access needs. Individual users may opt for single-user licenses, while businesses requiring broader access may choose multi-user or enterprise licenses for cost-effective access to the report.
13. Are there any additional resources or data provided in the Operating Microscope Industry report?
While the report offers comprehensive insights, it's advisable to review the specific contents or supplementary materials provided to ascertain if additional resources or data are available.
14. How can I stay updated on further developments or reports in the Operating Microscope Industry?
To stay informed about further developments, trends, and reports in the Operating Microscope Industry, consider subscribing to industry newsletters, following relevant companies and organizations, or regularly checking reputable industry news sources and publications.
Methodology
Step 1 - Identification of Relevant Samples Size from Population Database


Step 2 - Approaches for Defining Global Market Size (Value, Volume* & Price*)

Note*: In applicable scenarios
Step 3 - Data Sources
Primary Research
- Web Analytics
- Survey Reports
- Research Institute
- Latest Research Reports
- Opinion Leaders
Secondary Research
- Annual Reports
- White Paper
- Latest Press Release
- Industry Association
- Paid Database
- Investor Presentations

Step 4 - Data Triangulation
Involves using different sources of information in order to increase the validity of a study
These sources are likely to be stakeholders in a program - participants, other researchers, program staff, other community members, and so on.
Then we put all data in single framework & apply various statistical tools to find out the dynamic on the market.
During the analysis stage, feedback from the stakeholder groups would be compared to determine areas of agreement as well as areas of divergence


