
Key Insights
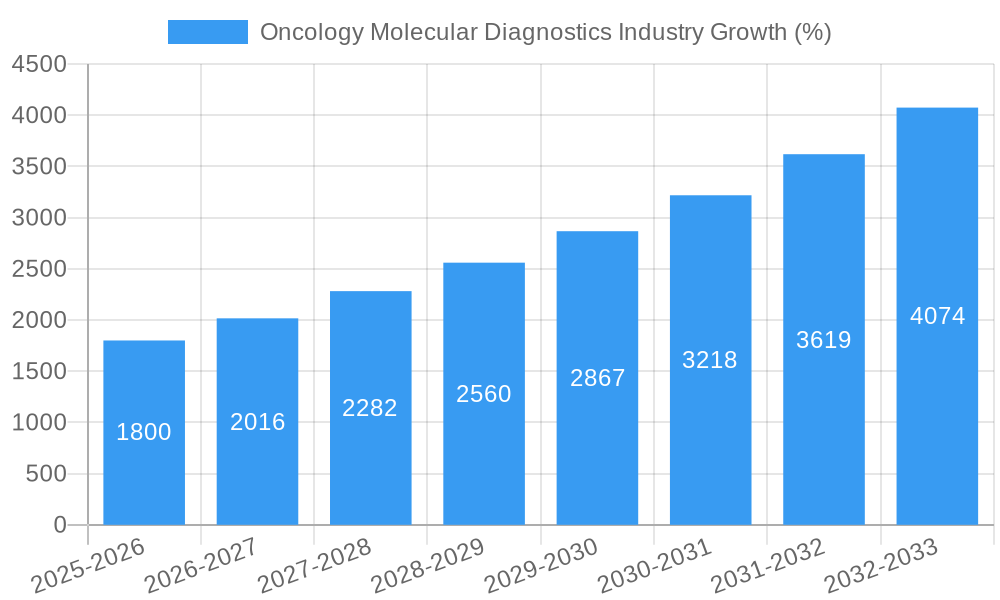
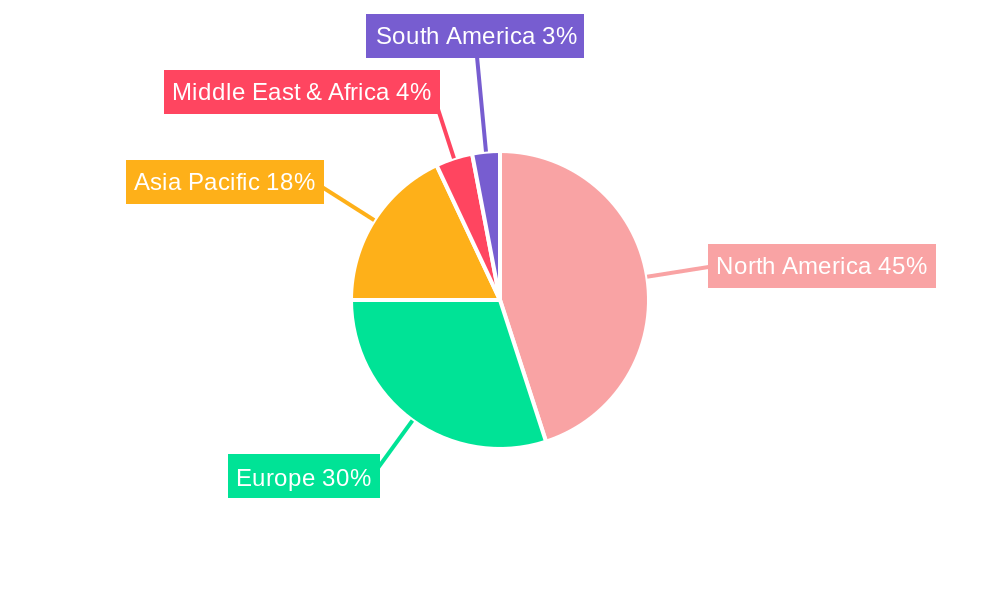
The oncology molecular diagnostics market is experiencing robust growth, driven by the increasing prevalence of cancer globally, advancements in molecular diagnostic technologies, and the rising demand for personalized medicine. The market's Compound Annual Growth Rate (CAGR) exceeding 12% signifies significant expansion opportunities across various segments. Technological advancements, particularly in next-generation sequencing (NGS), polymerase chain reaction (PCR), and other innovative techniques, are enhancing the accuracy and speed of cancer diagnosis and treatment monitoring. This allows for earlier detection, targeted therapies, and improved patient outcomes, fueling market growth. Furthermore, the increasing adoption of molecular diagnostics in clinical settings, including hospitals and diagnostic centers, contributes to the market's expansion. While the market faces restraints such as high costs associated with advanced technologies and regulatory hurdles for new product approvals, these challenges are being mitigated by continuous innovation and increasing reimbursement coverage in several regions. The market segmentation reveals a strong demand across various cancer types, with breast, prostate, colorectal, and lung cancers representing major application segments. The North American market currently holds a significant share due to robust healthcare infrastructure and high adoption rates of advanced technologies. However, the Asia-Pacific region is anticipated to witness substantial growth in the coming years, driven by increasing healthcare expenditure and rising cancer prevalence in developing economies.
The competitive landscape comprises both large multinational corporations and smaller specialized companies. Established players like Roche, Thermo Fisher Scientific, and Illumina are leveraging their established distribution networks and technological expertise to maintain market leadership. However, smaller companies focused on niche applications or innovative technologies are also gaining traction, contributing to a dynamic and competitive market environment. The forecast period (2025-2033) indicates sustained growth, with a continued shift towards personalized medicine and a wider adoption of advanced molecular diagnostic tools across diverse geographic locations. This market expansion will be further influenced by ongoing research and development efforts, collaborations between diagnostic companies and pharmaceutical firms, and the increasing integration of artificial intelligence and big data analytics in cancer diagnostics.
Oncology Molecular Diagnostics Market Report: 2019-2033
This comprehensive report provides an in-depth analysis of the Oncology Molecular Diagnostics market, encompassing its current state, future trajectory, and key players. With a focus on granular segmentation and robust data, this report is an invaluable resource for industry professionals, investors, and strategists seeking to navigate this rapidly evolving landscape. The study period covers 2019-2033, with 2025 as the base year and a forecast period of 2025-2033. The market value is presented in million units.
Oncology Molecular Diagnostics Industry Market Dynamics & Structure
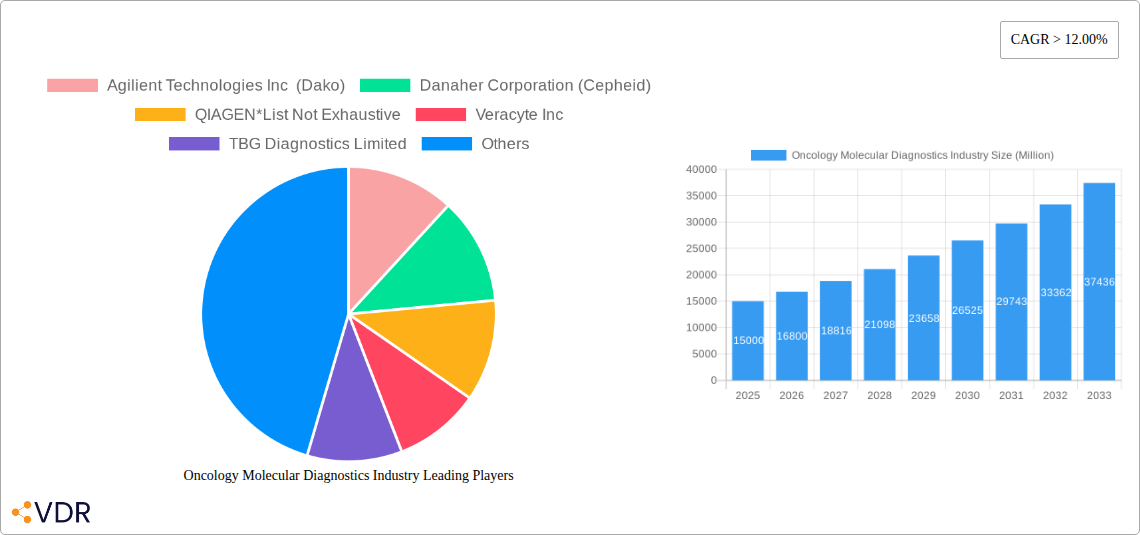
This section analyzes the market's competitive landscape, technological advancements, regulatory influences, and market trends impacting the Oncology Molecular Diagnostics industry. We explore the concentration ratio, examining the market share held by key players like Agilent Technologies Inc (Dako), Danaher Corporation (Cepheid), and QIAGEN. The report assesses the impact of technological innovations, such as next-generation sequencing (NGS), on market growth, alongside the influence of regulatory frameworks like FDA approvals on product adoption. Furthermore, it analyzes the role of mergers and acquisitions (M&A) activity in shaping the industry landscape. We provide quantitative data on market share distribution and M&A deal volumes throughout the historical (2019-2024) and forecast periods (2025-2033). Qualitative factors, including barriers to innovation and the impact of substitute products, are also examined.
- Market Concentration: Analysis of market share distribution among top players (xx% for top 3 players in 2025).
- Technological Innovation Drivers: Detailed examination of NGS, PCR, and other technologies and their impact on market growth.
- Regulatory Frameworks: Impact of FDA approvals and other regulatory bodies on product development and market entry.
- Competitive Product Substitutes: Evaluation of alternative diagnostic methods and their impact on market share.
- End-User Demographics: Analysis of the distribution of end-users across hospitals, diagnostic centers, and other segments.
- M&A Trends: Review of recent M&A activity, including deal volumes and their strategic implications. (xx M&A deals projected in 2025-2033).
Oncology Molecular Diagnostics Industry Growth Trends & Insights
This section presents a detailed analysis of the Oncology Molecular Diagnostics market's growth trajectory using various analytical techniques. We examine historical market size evolution, adoption rates of molecular diagnostic tests across various cancer types, and the impact of technological disruptions on market dynamics. The analysis includes projections of future growth, factoring in anticipated technological advancements and consumer behavior shifts, specifically focusing on the increasing demand for personalized medicine and earlier cancer detection. Key metrics such as compound annual growth rate (CAGR) and market penetration rates are provided for various segments.
(This section will include a 600-word analysis based on XXX - the placeholder will be replaced with the appropriate data and analysis.)
Dominant Regions, Countries, or Segments in Oncology Molecular Diagnostics Industry
This section identifies the leading geographical regions, countries, and market segments driving the growth of the Oncology Molecular Diagnostics industry. We analyze dominance factors, including market share, growth potential, and key market drivers. The analysis considers market segmentation by application type (breast, prostate, colorectal, lung, blood, liver, cervical, and other cancers), end-user (hospitals, diagnostic centers, and other end-users), product type (instruments, reagents, and other product types), and technology type (PCR, INAAT, DNA sequencing, in-situ hybridization, mass spectrometry, TMA, chips and microarrays, and other technologies). The analysis will detail the reasons for regional and segmental dominance.
- By Application Type: Analysis detailing the largest application type (likely Breast Cancer), explaining factors like prevalence rates and treatment protocols. (xx Million units for Breast Cancer market in 2025).
- By End User: Assessment of the dominant end-user segment (likely Hospitals), discussing factors driving market share. (xx Million units for Hospital segment in 2025).
- By Product Type: Examination of the leading product type (likely Reagents), examining factors driving demand. (xx Million units for Reagents market in 2025).
- By Technology Type: Analysis of the dominant technology (likely PCR), considering factors such as cost-effectiveness and widespread adoption. (xx Million units for PCR market in 2025).
Oncology Molecular Diagnostics Industry Product Landscape
This section provides an overview of the product landscape within the Oncology Molecular Diagnostics market, describing key product innovations, applications, and performance metrics. We examine the unique selling propositions (USPs) of leading products and highlight recent technological advancements driving product differentiation and improved diagnostic accuracy.
Key Drivers, Barriers & Challenges in Oncology Molecular Diagnostics Industry
This section identifies and analyzes the key factors driving and hindering the growth of the Oncology Molecular Diagnostics market.
Key Drivers: The market is fueled by factors such as rising cancer prevalence, advancements in molecular diagnostic technologies (e.g., NGS), increasing demand for personalized medicine, and supportive government initiatives and funding for cancer research.
Key Barriers and Challenges: The market faces challenges, including high costs associated with advanced technologies, stringent regulatory approvals, the complexity of interpreting molecular data, and the need for skilled professionals to operate advanced diagnostic equipment. Competition among established players and the emergence of new entrants also pose challenges, with potential for price wars and decreased profit margins.
Emerging Opportunities in Oncology Molecular Diagnostics Industry
This section highlights emerging opportunities within the Oncology Molecular Diagnostics market, including untapped markets (e.g., developing countries), new applications of existing technologies, and evolving consumer preferences for non-invasive diagnostic methods. The potential for liquid biopsies and point-of-care diagnostics will also be explored.
Growth Accelerators in the Oncology Molecular Diagnostics Industry Industry
Technological breakthroughs, such as advancements in NGS and development of more accurate and sensitive assays, are significant growth accelerators. Strategic partnerships between diagnostic companies and pharmaceutical companies to integrate molecular diagnostics into targeted therapy development strategies also fuel market growth. Expansion into new geographic markets and development of user-friendly, cost-effective diagnostic tools are further catalysts for long-term growth.
Key Players Shaping the Oncology Molecular Diagnostics Market
- Agilent Technologies Inc (Dako)
- Danaher Corporation (Cepheid)
- QIAGEN
- Veracyte Inc
- TBG Diagnostics Limited
- HTG Molecular Diagnostics Inc
- Thermo Fisher Scientific Inc
- Abbott Laboratories
- F Hoffmann La-Roche Ltd
- bioMérieux SA
- Illumina Inc
- Sysmex Corporation (Sysmex Europe GmbH)
Notable Milestones in Oncology Molecular Diagnostics Industry Sector
(This section will include a list of notable milestones with year/month and their impact on market dynamics, such as product launches, mergers, and regulatory approvals. The number of milestones will depend on the available data.)
In-Depth Oncology Molecular Diagnostics Industry Market Outlook
The Oncology Molecular Diagnostics market is poised for continued growth, driven by technological advancements, expanding applications, and increased demand for personalized medicine. Strategic opportunities lie in developing novel diagnostic tools, forging collaborations across the healthcare ecosystem, and penetrating underserved markets. The long-term outlook is positive, with significant potential for market expansion and improved patient outcomes.
Oncology Molecular Diagnostics Industry Segmentation
-
1. Product Type
- 1.1. Instrument
- 1.2. Reagents
- 1.3. Other Product Types
-
2. Technology Type
- 2.1. Polymerase Chain Reaction (PCR)
- 2.2. Isotherm
- 2.3. DNA Sequencing and Next-Generation Sequencing
- 2.4. In-situ Hybridization
- 2.5. Mass Spectrometry
- 2.6. Transcription Mediated Amplification (TMA)
- 2.7. Chips and Microarrays
- 2.8. Other Technology Types
-
3. Application Type
- 3.1. Breast Cancer
- 3.2. Prostate Cancer
- 3.3. Colorectal Cancer
- 3.4. Lung Cancer
- 3.5. Blood Cancer
- 3.6. Liver Cancer
- 3.7. Cervical Cancer
- 3.8. Other Application Types
-
4. End User
- 4.1. Hospitals
- 4.2. Diagnostic Centers
- 4.3. Other End Users
Oncology Molecular Diagnostics Industry Segmentation By Geography
-
1. North America
- 1.1. United States
- 1.2. Canada
- 1.3. Mexico
-
2. Europe
- 2.1. Germany
- 2.2. United Kingdom
- 2.3. France
- 2.4. Italy
- 2.5. Spain
- 2.6. Rest of Europe
-
3. Asia Pacific
- 3.1. China
- 3.2. Japan
- 3.3. India
- 3.4. Australia
- 3.5. South Korea
- 3.6. Rest of Asia Pacific
-
4. Middle East and Africa
- 4.1. GCC
- 4.2. South Africa
- 4.3. Rest of Middle East and Africa
-
5. South America
- 5.1. Brazil
- 5.2. Argentina
- 5.3. Rest of South America
Oncology Molecular Diagnostics Industry REPORT HIGHLIGHTS
| Aspects | Details |
|---|---|
| Study Period | 2019-2033 |
| Base Year | 2024 |
| Estimated Year | 2025 |
| Forecast Period | 2025-2033 |
| Historical Period | 2019-2024 |
| Growth Rate | CAGR of > 12.00% from 2019-2033 |
| Segmentation |
|
Table of Contents
- 1. Introduction
- 1.1. Research Scope
- 1.2. Market Segmentation
- 1.3. Research Methodology
- 1.4. Definitions and Assumptions
- 2. Executive Summary
- 2.1. Introduction
- 3. Market Dynamics
- 3.1. Introduction
- 3.2. Market Drivers
- 3.2.1. Rising Prevalence of Cancer Worldwide; Technological Advancements in Diagnostic Testing; Increasing Demand for Point-of-care Treatment
- 3.3. Market Restrains
- 3.3.1. High Cost of Molecular Diagnostic Tests; Lack of Skilled Workforce and Stringent Regulatory Framework
- 3.4. Market Trends
- 3.4.1. Polymerase Chain Reaction (PCR) is Anticipated to Observe a Significant Growth
- 4. Market Factor Analysis
- 4.1. Porters Five Forces
- 4.2. Supply/Value Chain
- 4.3. PESTEL analysis
- 4.4. Market Entropy
- 4.5. Patent/Trademark Analysis
- 5. Global Oncology Molecular Diagnostics Industry Analysis, Insights and Forecast, 2019-2031
- 5.1. Market Analysis, Insights and Forecast - by Product Type
- 5.1.1. Instrument
- 5.1.2. Reagents
- 5.1.3. Other Product Types
- 5.2. Market Analysis, Insights and Forecast - by Technology Type
- 5.2.1. Polymerase Chain Reaction (PCR)
- 5.2.2. Isotherm
- 5.2.3. DNA Sequencing and Next-Generation Sequencing
- 5.2.4. In-situ Hybridization
- 5.2.5. Mass Spectrometry
- 5.2.6. Transcription Mediated Amplification (TMA)
- 5.2.7. Chips and Microarrays
- 5.2.8. Other Technology Types
- 5.3. Market Analysis, Insights and Forecast - by Application Type
- 5.3.1. Breast Cancer
- 5.3.2. Prostate Cancer
- 5.3.3. Colorectal Cancer
- 5.3.4. Lung Cancer
- 5.3.5. Blood Cancer
- 5.3.6. Liver Cancer
- 5.3.7. Cervical Cancer
- 5.3.8. Other Application Types
- 5.4. Market Analysis, Insights and Forecast - by End User
- 5.4.1. Hospitals
- 5.4.2. Diagnostic Centers
- 5.4.3. Other End Users
- 5.5. Market Analysis, Insights and Forecast - by Region
- 5.5.1. North America
- 5.5.2. Europe
- 5.5.3. Asia Pacific
- 5.5.4. Middle East and Africa
- 5.5.5. South America
- 5.1. Market Analysis, Insights and Forecast - by Product Type
- 6. North America Oncology Molecular Diagnostics Industry Analysis, Insights and Forecast, 2019-2031
- 6.1. Market Analysis, Insights and Forecast - by Product Type
- 6.1.1. Instrument
- 6.1.2. Reagents
- 6.1.3. Other Product Types
- 6.2. Market Analysis, Insights and Forecast - by Technology Type
- 6.2.1. Polymerase Chain Reaction (PCR)
- 6.2.2. Isotherm
- 6.2.3. DNA Sequencing and Next-Generation Sequencing
- 6.2.4. In-situ Hybridization
- 6.2.5. Mass Spectrometry
- 6.2.6. Transcription Mediated Amplification (TMA)
- 6.2.7. Chips and Microarrays
- 6.2.8. Other Technology Types
- 6.3. Market Analysis, Insights and Forecast - by Application Type
- 6.3.1. Breast Cancer
- 6.3.2. Prostate Cancer
- 6.3.3. Colorectal Cancer
- 6.3.4. Lung Cancer
- 6.3.5. Blood Cancer
- 6.3.6. Liver Cancer
- 6.3.7. Cervical Cancer
- 6.3.8. Other Application Types
- 6.4. Market Analysis, Insights and Forecast - by End User
- 6.4.1. Hospitals
- 6.4.2. Diagnostic Centers
- 6.4.3. Other End Users
- 6.1. Market Analysis, Insights and Forecast - by Product Type
- 7. Europe Oncology Molecular Diagnostics Industry Analysis, Insights and Forecast, 2019-2031
- 7.1. Market Analysis, Insights and Forecast - by Product Type
- 7.1.1. Instrument
- 7.1.2. Reagents
- 7.1.3. Other Product Types
- 7.2. Market Analysis, Insights and Forecast - by Technology Type
- 7.2.1. Polymerase Chain Reaction (PCR)
- 7.2.2. Isotherm
- 7.2.3. DNA Sequencing and Next-Generation Sequencing
- 7.2.4. In-situ Hybridization
- 7.2.5. Mass Spectrometry
- 7.2.6. Transcription Mediated Amplification (TMA)
- 7.2.7. Chips and Microarrays
- 7.2.8. Other Technology Types
- 7.3. Market Analysis, Insights and Forecast - by Application Type
- 7.3.1. Breast Cancer
- 7.3.2. Prostate Cancer
- 7.3.3. Colorectal Cancer
- 7.3.4. Lung Cancer
- 7.3.5. Blood Cancer
- 7.3.6. Liver Cancer
- 7.3.7. Cervical Cancer
- 7.3.8. Other Application Types
- 7.4. Market Analysis, Insights and Forecast - by End User
- 7.4.1. Hospitals
- 7.4.2. Diagnostic Centers
- 7.4.3. Other End Users
- 7.1. Market Analysis, Insights and Forecast - by Product Type
- 8. Asia Pacific Oncology Molecular Diagnostics Industry Analysis, Insights and Forecast, 2019-2031
- 8.1. Market Analysis, Insights and Forecast - by Product Type
- 8.1.1. Instrument
- 8.1.2. Reagents
- 8.1.3. Other Product Types
- 8.2. Market Analysis, Insights and Forecast - by Technology Type
- 8.2.1. Polymerase Chain Reaction (PCR)
- 8.2.2. Isotherm
- 8.2.3. DNA Sequencing and Next-Generation Sequencing
- 8.2.4. In-situ Hybridization
- 8.2.5. Mass Spectrometry
- 8.2.6. Transcription Mediated Amplification (TMA)
- 8.2.7. Chips and Microarrays
- 8.2.8. Other Technology Types
- 8.3. Market Analysis, Insights and Forecast - by Application Type
- 8.3.1. Breast Cancer
- 8.3.2. Prostate Cancer
- 8.3.3. Colorectal Cancer
- 8.3.4. Lung Cancer
- 8.3.5. Blood Cancer
- 8.3.6. Liver Cancer
- 8.3.7. Cervical Cancer
- 8.3.8. Other Application Types
- 8.4. Market Analysis, Insights and Forecast - by End User
- 8.4.1. Hospitals
- 8.4.2. Diagnostic Centers
- 8.4.3. Other End Users
- 8.1. Market Analysis, Insights and Forecast - by Product Type
- 9. Middle East and Africa Oncology Molecular Diagnostics Industry Analysis, Insights and Forecast, 2019-2031
- 9.1. Market Analysis, Insights and Forecast - by Product Type
- 9.1.1. Instrument
- 9.1.2. Reagents
- 9.1.3. Other Product Types
- 9.2. Market Analysis, Insights and Forecast - by Technology Type
- 9.2.1. Polymerase Chain Reaction (PCR)
- 9.2.2. Isotherm
- 9.2.3. DNA Sequencing and Next-Generation Sequencing
- 9.2.4. In-situ Hybridization
- 9.2.5. Mass Spectrometry
- 9.2.6. Transcription Mediated Amplification (TMA)
- 9.2.7. Chips and Microarrays
- 9.2.8. Other Technology Types
- 9.3. Market Analysis, Insights and Forecast - by Application Type
- 9.3.1. Breast Cancer
- 9.3.2. Prostate Cancer
- 9.3.3. Colorectal Cancer
- 9.3.4. Lung Cancer
- 9.3.5. Blood Cancer
- 9.3.6. Liver Cancer
- 9.3.7. Cervical Cancer
- 9.3.8. Other Application Types
- 9.4. Market Analysis, Insights and Forecast - by End User
- 9.4.1. Hospitals
- 9.4.2. Diagnostic Centers
- 9.4.3. Other End Users
- 9.1. Market Analysis, Insights and Forecast - by Product Type
- 10. South America Oncology Molecular Diagnostics Industry Analysis, Insights and Forecast, 2019-2031
- 10.1. Market Analysis, Insights and Forecast - by Product Type
- 10.1.1. Instrument
- 10.1.2. Reagents
- 10.1.3. Other Product Types
- 10.2. Market Analysis, Insights and Forecast - by Technology Type
- 10.2.1. Polymerase Chain Reaction (PCR)
- 10.2.2. Isotherm
- 10.2.3. DNA Sequencing and Next-Generation Sequencing
- 10.2.4. In-situ Hybridization
- 10.2.5. Mass Spectrometry
- 10.2.6. Transcription Mediated Amplification (TMA)
- 10.2.7. Chips and Microarrays
- 10.2.8. Other Technology Types
- 10.3. Market Analysis, Insights and Forecast - by Application Type
- 10.3.1. Breast Cancer
- 10.3.2. Prostate Cancer
- 10.3.3. Colorectal Cancer
- 10.3.4. Lung Cancer
- 10.3.5. Blood Cancer
- 10.3.6. Liver Cancer
- 10.3.7. Cervical Cancer
- 10.3.8. Other Application Types
- 10.4. Market Analysis, Insights and Forecast - by End User
- 10.4.1. Hospitals
- 10.4.2. Diagnostic Centers
- 10.4.3. Other End Users
- 10.1. Market Analysis, Insights and Forecast - by Product Type
- 11. North America Oncology Molecular Diagnostics Industry Analysis, Insights and Forecast, 2019-2031
- 11.1. Market Analysis, Insights and Forecast - By Country/Sub-region
- 11.1.1 United States
- 11.1.2 Canada
- 11.1.3 Mexico
- 12. Europe Oncology Molecular Diagnostics Industry Analysis, Insights and Forecast, 2019-2031
- 12.1. Market Analysis, Insights and Forecast - By Country/Sub-region
- 12.1.1 Germany
- 12.1.2 United Kingdom
- 12.1.3 France
- 12.1.4 Italy
- 12.1.5 Spain
- 12.1.6 Rest of Europe
- 13. Asia Pacific Oncology Molecular Diagnostics Industry Analysis, Insights and Forecast, 2019-2031
- 13.1. Market Analysis, Insights and Forecast - By Country/Sub-region
- 13.1.1 China
- 13.1.2 Japan
- 13.1.3 India
- 13.1.4 Australia
- 13.1.5 South Korea
- 13.1.6 Rest of Asia Pacific
- 14. Middle East and Africa Oncology Molecular Diagnostics Industry Analysis, Insights and Forecast, 2019-2031
- 14.1. Market Analysis, Insights and Forecast - By Country/Sub-region
- 14.1.1 GCC
- 14.1.2 South Africa
- 14.1.3 Rest of Middle East and Africa
- 15. South America Oncology Molecular Diagnostics Industry Analysis, Insights and Forecast, 2019-2031
- 15.1. Market Analysis, Insights and Forecast - By Country/Sub-region
- 15.1.1 Brazil
- 15.1.2 Argentina
- 15.1.3 Rest of South America
- 16. Competitive Analysis
- 16.1. Global Market Share Analysis 2024
- 16.2. Company Profiles
- 16.2.1 Agilient Technologies Inc (Dako)
- 16.2.1.1. Overview
- 16.2.1.2. Products
- 16.2.1.3. SWOT Analysis
- 16.2.1.4. Recent Developments
- 16.2.1.5. Financials (Based on Availability)
- 16.2.2 Danaher Corporation (Cepheid)
- 16.2.2.1. Overview
- 16.2.2.2. Products
- 16.2.2.3. SWOT Analysis
- 16.2.2.4. Recent Developments
- 16.2.2.5. Financials (Based on Availability)
- 16.2.3 QIAGEN*List Not Exhaustive
- 16.2.3.1. Overview
- 16.2.3.2. Products
- 16.2.3.3. SWOT Analysis
- 16.2.3.4. Recent Developments
- 16.2.3.5. Financials (Based on Availability)
- 16.2.4 Veracyte Inc
- 16.2.4.1. Overview
- 16.2.4.2. Products
- 16.2.4.3. SWOT Analysis
- 16.2.4.4. Recent Developments
- 16.2.4.5. Financials (Based on Availability)
- 16.2.5 TBG Diagnostics Limited
- 16.2.5.1. Overview
- 16.2.5.2. Products
- 16.2.5.3. SWOT Analysis
- 16.2.5.4. Recent Developments
- 16.2.5.5. Financials (Based on Availability)
- 16.2.6 HTG Molecular Diagnostics Inc
- 16.2.6.1. Overview
- 16.2.6.2. Products
- 16.2.6.3. SWOT Analysis
- 16.2.6.4. Recent Developments
- 16.2.6.5. Financials (Based on Availability)
- 16.2.7 Thermo Fisher Scientific Inc
- 16.2.7.1. Overview
- 16.2.7.2. Products
- 16.2.7.3. SWOT Analysis
- 16.2.7.4. Recent Developments
- 16.2.7.5. Financials (Based on Availability)
- 16.2.8 Abbott Laboratories
- 16.2.8.1. Overview
- 16.2.8.2. Products
- 16.2.8.3. SWOT Analysis
- 16.2.8.4. Recent Developments
- 16.2.8.5. Financials (Based on Availability)
- 16.2.9 F Hoffmann La-Roche Ltd
- 16.2.9.1. Overview
- 16.2.9.2. Products
- 16.2.9.3. SWOT Analysis
- 16.2.9.4. Recent Developments
- 16.2.9.5. Financials (Based on Availability)
- 16.2.10 bioMérieux SA
- 16.2.10.1. Overview
- 16.2.10.2. Products
- 16.2.10.3. SWOT Analysis
- 16.2.10.4. Recent Developments
- 16.2.10.5. Financials (Based on Availability)
- 16.2.11 Illumina Inc
- 16.2.11.1. Overview
- 16.2.11.2. Products
- 16.2.11.3. SWOT Analysis
- 16.2.11.4. Recent Developments
- 16.2.11.5. Financials (Based on Availability)
- 16.2.12 Sysmex Corporation (Sysmex Europe GmbH)
- 16.2.12.1. Overview
- 16.2.12.2. Products
- 16.2.12.3. SWOT Analysis
- 16.2.12.4. Recent Developments
- 16.2.12.5. Financials (Based on Availability)
- 16.2.1 Agilient Technologies Inc (Dako)
List of Figures
- Figure 1: Global Oncology Molecular Diagnostics Industry Revenue Breakdown (Million, %) by Region 2024 & 2032
- Figure 2: North America Oncology Molecular Diagnostics Industry Revenue (Million), by Country 2024 & 2032
- Figure 3: North America Oncology Molecular Diagnostics Industry Revenue Share (%), by Country 2024 & 2032
- Figure 4: Europe Oncology Molecular Diagnostics Industry Revenue (Million), by Country 2024 & 2032
- Figure 5: Europe Oncology Molecular Diagnostics Industry Revenue Share (%), by Country 2024 & 2032
- Figure 6: Asia Pacific Oncology Molecular Diagnostics Industry Revenue (Million), by Country 2024 & 2032
- Figure 7: Asia Pacific Oncology Molecular Diagnostics Industry Revenue Share (%), by Country 2024 & 2032
- Figure 8: Middle East and Africa Oncology Molecular Diagnostics Industry Revenue (Million), by Country 2024 & 2032
- Figure 9: Middle East and Africa Oncology Molecular Diagnostics Industry Revenue Share (%), by Country 2024 & 2032
- Figure 10: South America Oncology Molecular Diagnostics Industry Revenue (Million), by Country 2024 & 2032
- Figure 11: South America Oncology Molecular Diagnostics Industry Revenue Share (%), by Country 2024 & 2032
- Figure 12: North America Oncology Molecular Diagnostics Industry Revenue (Million), by Product Type 2024 & 2032
- Figure 13: North America Oncology Molecular Diagnostics Industry Revenue Share (%), by Product Type 2024 & 2032
- Figure 14: North America Oncology Molecular Diagnostics Industry Revenue (Million), by Technology Type 2024 & 2032
- Figure 15: North America Oncology Molecular Diagnostics Industry Revenue Share (%), by Technology Type 2024 & 2032
- Figure 16: North America Oncology Molecular Diagnostics Industry Revenue (Million), by Application Type 2024 & 2032
- Figure 17: North America Oncology Molecular Diagnostics Industry Revenue Share (%), by Application Type 2024 & 2032
- Figure 18: North America Oncology Molecular Diagnostics Industry Revenue (Million), by End User 2024 & 2032
- Figure 19: North America Oncology Molecular Diagnostics Industry Revenue Share (%), by End User 2024 & 2032
- Figure 20: North America Oncology Molecular Diagnostics Industry Revenue (Million), by Country 2024 & 2032
- Figure 21: North America Oncology Molecular Diagnostics Industry Revenue Share (%), by Country 2024 & 2032
- Figure 22: Europe Oncology Molecular Diagnostics Industry Revenue (Million), by Product Type 2024 & 2032
- Figure 23: Europe Oncology Molecular Diagnostics Industry Revenue Share (%), by Product Type 2024 & 2032
- Figure 24: Europe Oncology Molecular Diagnostics Industry Revenue (Million), by Technology Type 2024 & 2032
- Figure 25: Europe Oncology Molecular Diagnostics Industry Revenue Share (%), by Technology Type 2024 & 2032
- Figure 26: Europe Oncology Molecular Diagnostics Industry Revenue (Million), by Application Type 2024 & 2032
- Figure 27: Europe Oncology Molecular Diagnostics Industry Revenue Share (%), by Application Type 2024 & 2032
- Figure 28: Europe Oncology Molecular Diagnostics Industry Revenue (Million), by End User 2024 & 2032
- Figure 29: Europe Oncology Molecular Diagnostics Industry Revenue Share (%), by End User 2024 & 2032
- Figure 30: Europe Oncology Molecular Diagnostics Industry Revenue (Million), by Country 2024 & 2032
- Figure 31: Europe Oncology Molecular Diagnostics Industry Revenue Share (%), by Country 2024 & 2032
- Figure 32: Asia Pacific Oncology Molecular Diagnostics Industry Revenue (Million), by Product Type 2024 & 2032
- Figure 33: Asia Pacific Oncology Molecular Diagnostics Industry Revenue Share (%), by Product Type 2024 & 2032
- Figure 34: Asia Pacific Oncology Molecular Diagnostics Industry Revenue (Million), by Technology Type 2024 & 2032
- Figure 35: Asia Pacific Oncology Molecular Diagnostics Industry Revenue Share (%), by Technology Type 2024 & 2032
- Figure 36: Asia Pacific Oncology Molecular Diagnostics Industry Revenue (Million), by Application Type 2024 & 2032
- Figure 37: Asia Pacific Oncology Molecular Diagnostics Industry Revenue Share (%), by Application Type 2024 & 2032
- Figure 38: Asia Pacific Oncology Molecular Diagnostics Industry Revenue (Million), by End User 2024 & 2032
- Figure 39: Asia Pacific Oncology Molecular Diagnostics Industry Revenue Share (%), by End User 2024 & 2032
- Figure 40: Asia Pacific Oncology Molecular Diagnostics Industry Revenue (Million), by Country 2024 & 2032
- Figure 41: Asia Pacific Oncology Molecular Diagnostics Industry Revenue Share (%), by Country 2024 & 2032
- Figure 42: Middle East and Africa Oncology Molecular Diagnostics Industry Revenue (Million), by Product Type 2024 & 2032
- Figure 43: Middle East and Africa Oncology Molecular Diagnostics Industry Revenue Share (%), by Product Type 2024 & 2032
- Figure 44: Middle East and Africa Oncology Molecular Diagnostics Industry Revenue (Million), by Technology Type 2024 & 2032
- Figure 45: Middle East and Africa Oncology Molecular Diagnostics Industry Revenue Share (%), by Technology Type 2024 & 2032
- Figure 46: Middle East and Africa Oncology Molecular Diagnostics Industry Revenue (Million), by Application Type 2024 & 2032
- Figure 47: Middle East and Africa Oncology Molecular Diagnostics Industry Revenue Share (%), by Application Type 2024 & 2032
- Figure 48: Middle East and Africa Oncology Molecular Diagnostics Industry Revenue (Million), by End User 2024 & 2032
- Figure 49: Middle East and Africa Oncology Molecular Diagnostics Industry Revenue Share (%), by End User 2024 & 2032
- Figure 50: Middle East and Africa Oncology Molecular Diagnostics Industry Revenue (Million), by Country 2024 & 2032
- Figure 51: Middle East and Africa Oncology Molecular Diagnostics Industry Revenue Share (%), by Country 2024 & 2032
- Figure 52: South America Oncology Molecular Diagnostics Industry Revenue (Million), by Product Type 2024 & 2032
- Figure 53: South America Oncology Molecular Diagnostics Industry Revenue Share (%), by Product Type 2024 & 2032
- Figure 54: South America Oncology Molecular Diagnostics Industry Revenue (Million), by Technology Type 2024 & 2032
- Figure 55: South America Oncology Molecular Diagnostics Industry Revenue Share (%), by Technology Type 2024 & 2032
- Figure 56: South America Oncology Molecular Diagnostics Industry Revenue (Million), by Application Type 2024 & 2032
- Figure 57: South America Oncology Molecular Diagnostics Industry Revenue Share (%), by Application Type 2024 & 2032
- Figure 58: South America Oncology Molecular Diagnostics Industry Revenue (Million), by End User 2024 & 2032
- Figure 59: South America Oncology Molecular Diagnostics Industry Revenue Share (%), by End User 2024 & 2032
- Figure 60: South America Oncology Molecular Diagnostics Industry Revenue (Million), by Country 2024 & 2032
- Figure 61: South America Oncology Molecular Diagnostics Industry Revenue Share (%), by Country 2024 & 2032
List of Tables
- Table 1: Global Oncology Molecular Diagnostics Industry Revenue Million Forecast, by Region 2019 & 2032
- Table 2: Global Oncology Molecular Diagnostics Industry Revenue Million Forecast, by Product Type 2019 & 2032
- Table 3: Global Oncology Molecular Diagnostics Industry Revenue Million Forecast, by Technology Type 2019 & 2032
- Table 4: Global Oncology Molecular Diagnostics Industry Revenue Million Forecast, by Application Type 2019 & 2032
- Table 5: Global Oncology Molecular Diagnostics Industry Revenue Million Forecast, by End User 2019 & 2032
- Table 6: Global Oncology Molecular Diagnostics Industry Revenue Million Forecast, by Region 2019 & 2032
- Table 7: Global Oncology Molecular Diagnostics Industry Revenue Million Forecast, by Country 2019 & 2032
- Table 8: United States Oncology Molecular Diagnostics Industry Revenue (Million) Forecast, by Application 2019 & 2032
- Table 9: Canada Oncology Molecular Diagnostics Industry Revenue (Million) Forecast, by Application 2019 & 2032
- Table 10: Mexico Oncology Molecular Diagnostics Industry Revenue (Million) Forecast, by Application 2019 & 2032
- Table 11: Global Oncology Molecular Diagnostics Industry Revenue Million Forecast, by Country 2019 & 2032
- Table 12: Germany Oncology Molecular Diagnostics Industry Revenue (Million) Forecast, by Application 2019 & 2032
- Table 13: United Kingdom Oncology Molecular Diagnostics Industry Revenue (Million) Forecast, by Application 2019 & 2032
- Table 14: France Oncology Molecular Diagnostics Industry Revenue (Million) Forecast, by Application 2019 & 2032
- Table 15: Italy Oncology Molecular Diagnostics Industry Revenue (Million) Forecast, by Application 2019 & 2032
- Table 16: Spain Oncology Molecular Diagnostics Industry Revenue (Million) Forecast, by Application 2019 & 2032
- Table 17: Rest of Europe Oncology Molecular Diagnostics Industry Revenue (Million) Forecast, by Application 2019 & 2032
- Table 18: Global Oncology Molecular Diagnostics Industry Revenue Million Forecast, by Country 2019 & 2032
- Table 19: China Oncology Molecular Diagnostics Industry Revenue (Million) Forecast, by Application 2019 & 2032
- Table 20: Japan Oncology Molecular Diagnostics Industry Revenue (Million) Forecast, by Application 2019 & 2032
- Table 21: India Oncology Molecular Diagnostics Industry Revenue (Million) Forecast, by Application 2019 & 2032
- Table 22: Australia Oncology Molecular Diagnostics Industry Revenue (Million) Forecast, by Application 2019 & 2032
- Table 23: South Korea Oncology Molecular Diagnostics Industry Revenue (Million) Forecast, by Application 2019 & 2032
- Table 24: Rest of Asia Pacific Oncology Molecular Diagnostics Industry Revenue (Million) Forecast, by Application 2019 & 2032
- Table 25: Global Oncology Molecular Diagnostics Industry Revenue Million Forecast, by Country 2019 & 2032
- Table 26: GCC Oncology Molecular Diagnostics Industry Revenue (Million) Forecast, by Application 2019 & 2032
- Table 27: South Africa Oncology Molecular Diagnostics Industry Revenue (Million) Forecast, by Application 2019 & 2032
- Table 28: Rest of Middle East and Africa Oncology Molecular Diagnostics Industry Revenue (Million) Forecast, by Application 2019 & 2032
- Table 29: Global Oncology Molecular Diagnostics Industry Revenue Million Forecast, by Country 2019 & 2032
- Table 30: Brazil Oncology Molecular Diagnostics Industry Revenue (Million) Forecast, by Application 2019 & 2032
- Table 31: Argentina Oncology Molecular Diagnostics Industry Revenue (Million) Forecast, by Application 2019 & 2032
- Table 32: Rest of South America Oncology Molecular Diagnostics Industry Revenue (Million) Forecast, by Application 2019 & 2032
- Table 33: Global Oncology Molecular Diagnostics Industry Revenue Million Forecast, by Product Type 2019 & 2032
- Table 34: Global Oncology Molecular Diagnostics Industry Revenue Million Forecast, by Technology Type 2019 & 2032
- Table 35: Global Oncology Molecular Diagnostics Industry Revenue Million Forecast, by Application Type 2019 & 2032
- Table 36: Global Oncology Molecular Diagnostics Industry Revenue Million Forecast, by End User 2019 & 2032
- Table 37: Global Oncology Molecular Diagnostics Industry Revenue Million Forecast, by Country 2019 & 2032
- Table 38: United States Oncology Molecular Diagnostics Industry Revenue (Million) Forecast, by Application 2019 & 2032
- Table 39: Canada Oncology Molecular Diagnostics Industry Revenue (Million) Forecast, by Application 2019 & 2032
- Table 40: Mexico Oncology Molecular Diagnostics Industry Revenue (Million) Forecast, by Application 2019 & 2032
- Table 41: Global Oncology Molecular Diagnostics Industry Revenue Million Forecast, by Product Type 2019 & 2032
- Table 42: Global Oncology Molecular Diagnostics Industry Revenue Million Forecast, by Technology Type 2019 & 2032
- Table 43: Global Oncology Molecular Diagnostics Industry Revenue Million Forecast, by Application Type 2019 & 2032
- Table 44: Global Oncology Molecular Diagnostics Industry Revenue Million Forecast, by End User 2019 & 2032
- Table 45: Global Oncology Molecular Diagnostics Industry Revenue Million Forecast, by Country 2019 & 2032
- Table 46: Germany Oncology Molecular Diagnostics Industry Revenue (Million) Forecast, by Application 2019 & 2032
- Table 47: United Kingdom Oncology Molecular Diagnostics Industry Revenue (Million) Forecast, by Application 2019 & 2032
- Table 48: France Oncology Molecular Diagnostics Industry Revenue (Million) Forecast, by Application 2019 & 2032
- Table 49: Italy Oncology Molecular Diagnostics Industry Revenue (Million) Forecast, by Application 2019 & 2032
- Table 50: Spain Oncology Molecular Diagnostics Industry Revenue (Million) Forecast, by Application 2019 & 2032
- Table 51: Rest of Europe Oncology Molecular Diagnostics Industry Revenue (Million) Forecast, by Application 2019 & 2032
- Table 52: Global Oncology Molecular Diagnostics Industry Revenue Million Forecast, by Product Type 2019 & 2032
- Table 53: Global Oncology Molecular Diagnostics Industry Revenue Million Forecast, by Technology Type 2019 & 2032
- Table 54: Global Oncology Molecular Diagnostics Industry Revenue Million Forecast, by Application Type 2019 & 2032
- Table 55: Global Oncology Molecular Diagnostics Industry Revenue Million Forecast, by End User 2019 & 2032
- Table 56: Global Oncology Molecular Diagnostics Industry Revenue Million Forecast, by Country 2019 & 2032
- Table 57: China Oncology Molecular Diagnostics Industry Revenue (Million) Forecast, by Application 2019 & 2032
- Table 58: Japan Oncology Molecular Diagnostics Industry Revenue (Million) Forecast, by Application 2019 & 2032
- Table 59: India Oncology Molecular Diagnostics Industry Revenue (Million) Forecast, by Application 2019 & 2032
- Table 60: Australia Oncology Molecular Diagnostics Industry Revenue (Million) Forecast, by Application 2019 & 2032
- Table 61: South Korea Oncology Molecular Diagnostics Industry Revenue (Million) Forecast, by Application 2019 & 2032
- Table 62: Rest of Asia Pacific Oncology Molecular Diagnostics Industry Revenue (Million) Forecast, by Application 2019 & 2032
- Table 63: Global Oncology Molecular Diagnostics Industry Revenue Million Forecast, by Product Type 2019 & 2032
- Table 64: Global Oncology Molecular Diagnostics Industry Revenue Million Forecast, by Technology Type 2019 & 2032
- Table 65: Global Oncology Molecular Diagnostics Industry Revenue Million Forecast, by Application Type 2019 & 2032
- Table 66: Global Oncology Molecular Diagnostics Industry Revenue Million Forecast, by End User 2019 & 2032
- Table 67: Global Oncology Molecular Diagnostics Industry Revenue Million Forecast, by Country 2019 & 2032
- Table 68: GCC Oncology Molecular Diagnostics Industry Revenue (Million) Forecast, by Application 2019 & 2032
- Table 69: South Africa Oncology Molecular Diagnostics Industry Revenue (Million) Forecast, by Application 2019 & 2032
- Table 70: Rest of Middle East and Africa Oncology Molecular Diagnostics Industry Revenue (Million) Forecast, by Application 2019 & 2032
- Table 71: Global Oncology Molecular Diagnostics Industry Revenue Million Forecast, by Product Type 2019 & 2032
- Table 72: Global Oncology Molecular Diagnostics Industry Revenue Million Forecast, by Technology Type 2019 & 2032
- Table 73: Global Oncology Molecular Diagnostics Industry Revenue Million Forecast, by Application Type 2019 & 2032
- Table 74: Global Oncology Molecular Diagnostics Industry Revenue Million Forecast, by End User 2019 & 2032
- Table 75: Global Oncology Molecular Diagnostics Industry Revenue Million Forecast, by Country 2019 & 2032
- Table 76: Brazil Oncology Molecular Diagnostics Industry Revenue (Million) Forecast, by Application 2019 & 2032
- Table 77: Argentina Oncology Molecular Diagnostics Industry Revenue (Million) Forecast, by Application 2019 & 2032
- Table 78: Rest of South America Oncology Molecular Diagnostics Industry Revenue (Million) Forecast, by Application 2019 & 2032
Frequently Asked Questions
1. What is the projected Compound Annual Growth Rate (CAGR) of the Oncology Molecular Diagnostics Industry?
The projected CAGR is approximately > 12.00%.
2. Which companies are prominent players in the Oncology Molecular Diagnostics Industry?
Key companies in the market include Agilient Technologies Inc (Dako), Danaher Corporation (Cepheid), QIAGEN*List Not Exhaustive, Veracyte Inc, TBG Diagnostics Limited, HTG Molecular Diagnostics Inc, Thermo Fisher Scientific Inc, Abbott Laboratories, F Hoffmann La-Roche Ltd, bioMérieux SA, Illumina Inc, Sysmex Corporation (Sysmex Europe GmbH).
3. What are the main segments of the Oncology Molecular Diagnostics Industry?
The market segments include Product Type, Technology Type, Application Type, End User.
4. Can you provide details about the market size?
The market size is estimated to be USD XX Million as of 2022.
5. What are some drivers contributing to market growth?
Rising Prevalence of Cancer Worldwide; Technological Advancements in Diagnostic Testing; Increasing Demand for Point-of-care Treatment.
6. What are the notable trends driving market growth?
Polymerase Chain Reaction (PCR) is Anticipated to Observe a Significant Growth.
7. Are there any restraints impacting market growth?
High Cost of Molecular Diagnostic Tests; Lack of Skilled Workforce and Stringent Regulatory Framework.
8. Can you provide examples of recent developments in the market?
N/A
9. What pricing options are available for accessing the report?
Pricing options include single-user, multi-user, and enterprise licenses priced at USD 4750, USD 5250, and USD 8750 respectively.
10. Is the market size provided in terms of value or volume?
The market size is provided in terms of value, measured in Million.
11. Are there any specific market keywords associated with the report?
Yes, the market keyword associated with the report is "Oncology Molecular Diagnostics Industry," which aids in identifying and referencing the specific market segment covered.
12. How do I determine which pricing option suits my needs best?
The pricing options vary based on user requirements and access needs. Individual users may opt for single-user licenses, while businesses requiring broader access may choose multi-user or enterprise licenses for cost-effective access to the report.
13. Are there any additional resources or data provided in the Oncology Molecular Diagnostics Industry report?
While the report offers comprehensive insights, it's advisable to review the specific contents or supplementary materials provided to ascertain if additional resources or data are available.
14. How can I stay updated on further developments or reports in the Oncology Molecular Diagnostics Industry?
To stay informed about further developments, trends, and reports in the Oncology Molecular Diagnostics Industry, consider subscribing to industry newsletters, following relevant companies and organizations, or regularly checking reputable industry news sources and publications.
Methodology
Step 1 - Identification of Relevant Samples Size from Population Database


Step 2 - Approaches for Defining Global Market Size (Value, Volume* & Price*)

Note*: In applicable scenarios
Step 3 - Data Sources
Primary Research
- Web Analytics
- Survey Reports
- Research Institute
- Latest Research Reports
- Opinion Leaders
Secondary Research
- Annual Reports
- White Paper
- Latest Press Release
- Industry Association
- Paid Database
- Investor Presentations

Step 4 - Data Triangulation
Involves using different sources of information in order to increase the validity of a study
These sources are likely to be stakeholders in a program - participants, other researchers, program staff, other community members, and so on.
Then we put all data in single framework & apply various statistical tools to find out the dynamic on the market.
During the analysis stage, feedback from the stakeholder groups would be compared to determine areas of agreement as well as areas of divergence


