
Key Insights
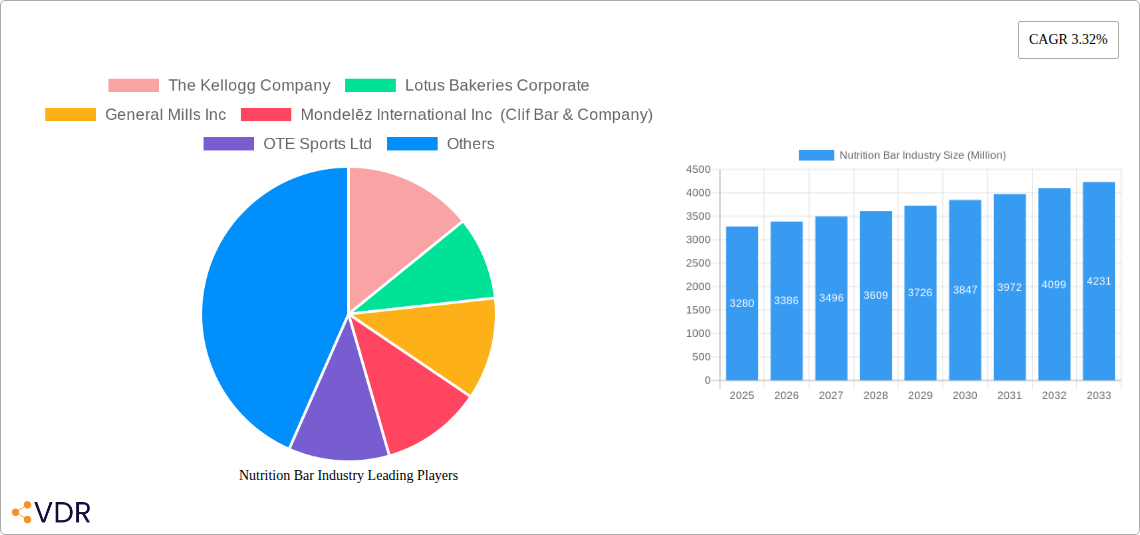
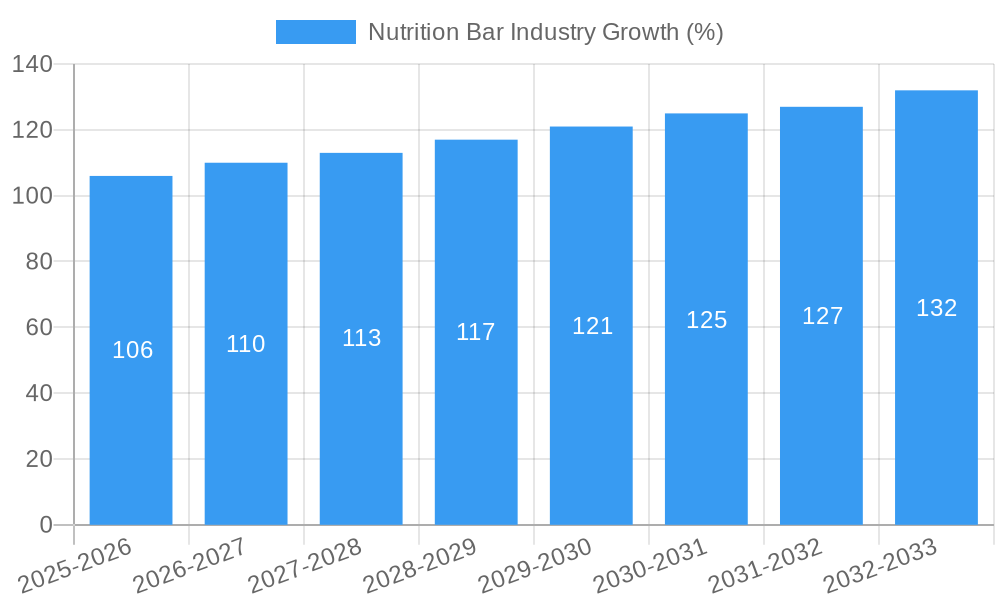
The global nutrition bar market, valued at $3.28 billion in 2025, is projected to experience steady growth, driven by increasing health consciousness among consumers and the convenience offered by these bars. The Compound Annual Growth Rate (CAGR) of 3.32% from 2025 to 2033 indicates a consistent expansion, although the actual growth may fluctuate year-to-year depending on economic conditions and shifts in consumer preferences. Key drivers include the rising prevalence of busy lifestyles demanding quick and nutritious meal replacements, a growing awareness of the importance of protein and fiber intake, and the increasing popularity of functional foods enriched with vitamins and minerals. Furthermore, the market is witnessing a trend towards healthier ingredients, such as organic and plant-based options, catering to the growing demand for natural and sustainable products. Despite the positive outlook, market growth might be constrained by factors such as price sensitivity among consumers, concerns about added sugar and artificial ingredients in certain brands, and the availability of substitute products, like fresh fruits and vegetables. The competitive landscape is dominated by established players like Kellogg's, General Mills, and Mondelez, alongside emerging brands focusing on niche segments and specific dietary needs. This segmentation, with options catering to vegan, keto, and high-protein diets, contributes to the market's dynamism.
The forecast period (2025-2033) presents opportunities for both established and emerging players to capitalize on innovative product development, strategic partnerships, and expansion into new geographical markets. Companies are investing in research and development to create nutrition bars with improved taste, texture, and nutritional profiles. The increasing adoption of online sales channels and e-commerce also plays a crucial role in reaching a wider customer base. Future success within this market will depend on effectively addressing consumer preferences for healthy and convenient snacking options while remaining price competitive and maintaining a strong brand reputation. Careful attention to ingredient sourcing, sustainability initiatives, and effective marketing campaigns will be critical for market leadership.
Nutrition Bar Industry Market Report: 2019-2033
This comprehensive report provides a detailed analysis of the global nutrition bar industry, encompassing market dynamics, growth trends, competitive landscape, and future outlook. The study period covers 2019-2033, with 2025 as the base and estimated year. This report is invaluable for industry professionals, investors, and strategic decision-makers seeking a deep understanding of this dynamic market.
Nutrition Bar Industry Market Dynamics & Structure
The nutrition bar market, a sub-segment of the larger confectionery and snack market, is characterized by high competition and significant consolidation. Market concentration is moderate, with a few large players holding significant market share, while numerous smaller players cater to niche segments. Technological innovation, particularly in ingredient sourcing, flavor profiles, and packaging, is a key driver. Regulatory frameworks concerning labeling, health claims, and ingredient sourcing vary across regions, impacting market dynamics. Competitive product substitutes include other convenient snack options like granola, yogurt, and fruit, impacting market penetration. End-user demographics are diverse, spanning across age groups, fitness levels, and dietary preferences. The market witnesses frequent mergers and acquisitions (M&A) activity, reflecting the industry's dynamic nature.
- Market Concentration: Moderate, with top 5 players holding approximately xx% market share (2024).
- M&A Activity: xx deals recorded between 2019-2024, with an average deal value of $xx million.
- Technological Innovation: Focus on clean-label ingredients, functional benefits (e.g., protein, fiber), and sustainable packaging.
- Regulatory Landscape: Varying regulations across regions regarding labeling, health claims, and ingredient standards create regional variations.
- Competitive Substitutes: Granola, yogurt, fruit, and other convenient snack options pose competition.
- End-User Demographics: Diverse, spanning across age, lifestyle, health consciousness, and dietary needs.
Nutrition Bar Industry Growth Trends & Insights
The global nutrition bar market experienced robust growth during the historical period (2019-2024), driven by increasing health consciousness, convenience, and the proliferation of new product innovations. The market size witnessed a CAGR of xx% during this period, reaching xx million units in 2024. Adoption rates have steadily increased, particularly among health-conscious consumers and athletes. Technological disruptions, such as the development of novel protein sources and functional ingredients, have further fueled market expansion. Consumer behavior shifts towards healthier and more convenient snacking options have positively impacted market growth. The forecast period (2025-2033) anticipates continued growth, driven by sustained demand and further technological advancements. Market penetration is expected to increase significantly, particularly in emerging economies. The market is projected to reach xx million units by 2033, with a CAGR of xx%.
Dominant Regions, Countries, or Segments in Nutrition Bar Industry
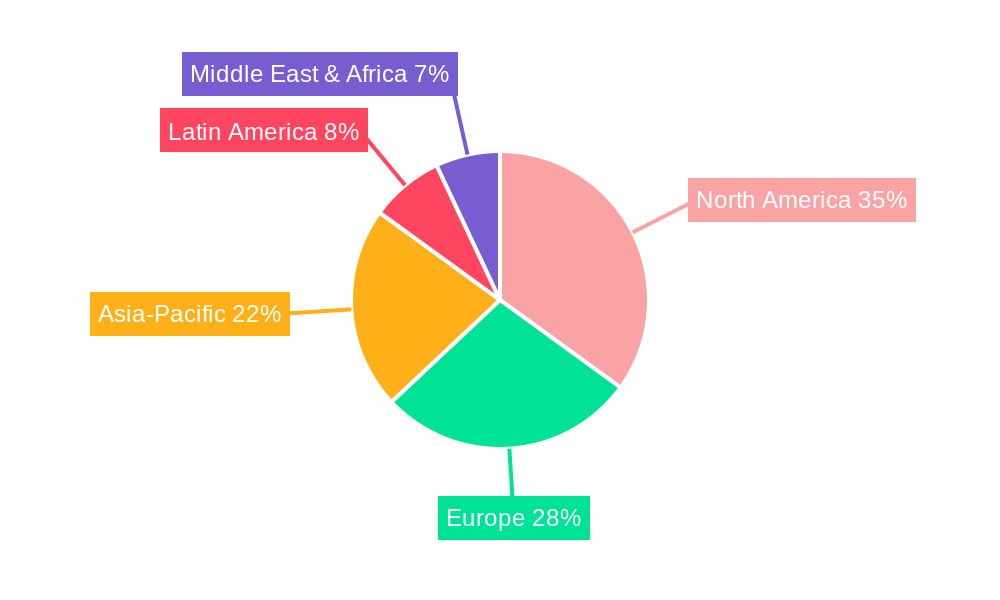
North America currently holds the largest market share in the nutrition bar industry, driven by high consumer awareness of health and wellness, strong disposable incomes, and established distribution channels. Europe follows as a significant market, showcasing robust growth in specialized segments like organic and vegan bars. Asia-Pacific is experiencing rapid growth, fueled by increasing health consciousness, rising disposable incomes, and expanding distribution networks. Within segments, protein bars and energy bars dominate the market.
- North America: High consumer awareness of health & wellness; established distribution channels; strong disposable incomes.
- Europe: Robust growth in specialized segments (organic, vegan); increasing demand for functional foods.
- Asia-Pacific: Rapid growth fueled by rising disposable incomes, expanding distribution networks, and growing health consciousness.
- Dominant Segments: Protein bars and energy bars represent the largest market shares.
Nutrition Bar Industry Product Landscape
The nutrition bar market boasts diverse product offerings, ranging from traditional energy bars to specialized options like protein bars, vegan bars, and bars catering to specific dietary needs (e.g., keto, gluten-free). Product innovations center on improved taste profiles, enhanced nutritional value, unique ingredient combinations, and sustainable packaging. Key performance metrics include protein content, fiber content, sugar content, and overall taste and texture. Unique selling propositions frequently include certified organic ingredients, specific health benefits (e.g., improved energy levels, muscle recovery), and convenience. Technological advancements in ingredient processing and packaging contribute to enhanced product quality and shelf life.
Key Drivers, Barriers & Challenges in Nutrition Bar Industry
Key Drivers: Increasing consumer health awareness, the growing popularity of convenient snack options, increasing demand for functional foods, and technological advancements in ingredient sourcing and formulation.
Challenges & Restraints: Intense competition from established players and new entrants, fluctuating raw material prices impacting production costs, stringent regulatory requirements for labeling and health claims, and supply chain disruptions due to geopolitical uncertainties. The impact of these factors is estimated to result in a xx% reduction in market growth during periods of significant supply chain disruptions.
Emerging Opportunities in Nutrition Bar Industry
Emerging opportunities include the expansion into untapped markets, particularly in developing economies with growing middle classes. The development of innovative product formulations targeting specific dietary needs (e.g., keto, paleo) and the increased use of plant-based and sustainable ingredients present significant opportunities. Personalized nutrition bars catering to individual health and fitness goals also offer substantial market potential. Moreover, the growing demand for functional foods with added benefits (e.g., probiotics, adaptogens) opens avenues for product diversification.
Growth Accelerators in the Nutrition Bar Industry
Long-term growth will be accelerated by technological breakthroughs in ingredient processing and formulation, resulting in improved nutritional profiles, taste, and texture. Strategic partnerships between nutrition bar manufacturers and ingredient suppliers, as well as retailers, can enhance market reach and penetration. Expansion into new geographical markets, leveraging e-commerce platforms, and aggressive marketing strategies focused on health and wellness will further stimulate market growth.
Key Players Shaping the Nutrition Bar Industry Market
- The Kellogg Company
- Lotus Bakeries Corporate
- General Mills Inc
- Mondelēz International Inc (Clif Bar & Company)
- OTE Sports Ltd
- Post Holdings Inc
- Mars Incorporated (Kind LLC)
- PepsiCo Inc
- Wholesome Habits Private Limited (EAT Anytime)
- ProBar LLC
- Nestlé S A
- List Not Exhaustive
Notable Milestones in Nutrition Bar Industry Sector
- April 2021: Kellogg India launched K Energy bars, targeting the "in-between meal" segment.
- August 2021: General Mills, Inc. launched Performance Protein bars from Cinnamon Toast Crunch and Golden Grahams brands.
- August 2022: Mondelez International, Inc. acquired Clif Bar & Company, significantly expanding its global snack bar business.
In-Depth Nutrition Bar Industry Market Outlook
The nutrition bar industry is poised for continued growth driven by sustained consumer demand for healthy and convenient snacking options. Strategic investments in research and development, innovative product formulations, targeted marketing strategies, and expanding distribution networks will be crucial for capturing market share. The industry's future success hinges on adapting to evolving consumer preferences and effectively navigating competitive pressures and regulatory landscapes. The market's long-term potential is significant, offering substantial opportunities for growth and innovation.
Nutrition Bar Industry Segmentation
-
1. Type
- 1.1. Organic
- 1.2. Conventional
-
2. Distribution Channel
- 2.1. Supermarkets/Hypermarkets
- 2.2. Convenience Stores
- 2.3. Specialty Stores
- 2.4. Online Retail Stores
- 2.5. Other Distribution Channels
Nutrition Bar Industry Segmentation By Geography
-
1. North America
- 1.1. United States
- 1.2. Canada
- 1.3. Mexico
- 1.4. Rest of North America
-
2. Europe
- 2.1. United Kingdom
- 2.2. Germany
- 2.3. Spain
- 2.4. France
- 2.5. Italy
- 2.6. Russia
- 2.7. Rest of Europe
-
3. Asia Pacific
- 3.1. China
- 3.2. Japan
- 3.3. India
- 3.4. Australia
- 3.5. Rest of Asia Pacific
-
4. South America
- 4.1. Brazil
- 4.2. Argentina
- 4.3. Rest of South America
-
5. Middle East and Africa
- 5.1. Saudi Arabia
- 5.2. South Africa
- 5.3. Rest Middle East and Africa
Nutrition Bar Industry REPORT HIGHLIGHTS
| Aspects | Details |
|---|---|
| Study Period | 2019-2033 |
| Base Year | 2024 |
| Estimated Year | 2025 |
| Forecast Period | 2025-2033 |
| Historical Period | 2019-2024 |
| Growth Rate | CAGR of 3.32% from 2019-2033 |
| Segmentation |
|
Table of Contents
- 1. Introduction
- 1.1. Research Scope
- 1.2. Market Segmentation
- 1.3. Research Methodology
- 1.4. Definitions and Assumptions
- 2. Executive Summary
- 2.1. Introduction
- 3. Market Dynamics
- 3.1. Introduction
- 3.2. Market Drivers
- 3.3. Market Restrains
- 3.4. Market Trends
- 3.4.1. Rising Demand for Healthy On-the-go Snacking
- 4. Market Factor Analysis
- 4.1. Porters Five Forces
- 4.2. Supply/Value Chain
- 4.3. PESTEL analysis
- 4.4. Market Entropy
- 4.5. Patent/Trademark Analysis
- 5. Global Nutrition Bar Industry Analysis, Insights and Forecast, 2019-2031
- 5.1. Market Analysis, Insights and Forecast - by Type
- 5.1.1. Organic
- 5.1.2. Conventional
- 5.2. Market Analysis, Insights and Forecast - by Distribution Channel
- 5.2.1. Supermarkets/Hypermarkets
- 5.2.2. Convenience Stores
- 5.2.3. Specialty Stores
- 5.2.4. Online Retail Stores
- 5.2.5. Other Distribution Channels
- 5.3. Market Analysis, Insights and Forecast - by Region
- 5.3.1. North America
- 5.3.2. Europe
- 5.3.3. Asia Pacific
- 5.3.4. South America
- 5.3.5. Middle East and Africa
- 5.1. Market Analysis, Insights and Forecast - by Type
- 6. North America Nutrition Bar Industry Analysis, Insights and Forecast, 2019-2031
- 6.1. Market Analysis, Insights and Forecast - by Type
- 6.1.1. Organic
- 6.1.2. Conventional
- 6.2. Market Analysis, Insights and Forecast - by Distribution Channel
- 6.2.1. Supermarkets/Hypermarkets
- 6.2.2. Convenience Stores
- 6.2.3. Specialty Stores
- 6.2.4. Online Retail Stores
- 6.2.5. Other Distribution Channels
- 6.1. Market Analysis, Insights and Forecast - by Type
- 7. Europe Nutrition Bar Industry Analysis, Insights and Forecast, 2019-2031
- 7.1. Market Analysis, Insights and Forecast - by Type
- 7.1.1. Organic
- 7.1.2. Conventional
- 7.2. Market Analysis, Insights and Forecast - by Distribution Channel
- 7.2.1. Supermarkets/Hypermarkets
- 7.2.2. Convenience Stores
- 7.2.3. Specialty Stores
- 7.2.4. Online Retail Stores
- 7.2.5. Other Distribution Channels
- 7.1. Market Analysis, Insights and Forecast - by Type
- 8. Asia Pacific Nutrition Bar Industry Analysis, Insights and Forecast, 2019-2031
- 8.1. Market Analysis, Insights and Forecast - by Type
- 8.1.1. Organic
- 8.1.2. Conventional
- 8.2. Market Analysis, Insights and Forecast - by Distribution Channel
- 8.2.1. Supermarkets/Hypermarkets
- 8.2.2. Convenience Stores
- 8.2.3. Specialty Stores
- 8.2.4. Online Retail Stores
- 8.2.5. Other Distribution Channels
- 8.1. Market Analysis, Insights and Forecast - by Type
- 9. South America Nutrition Bar Industry Analysis, Insights and Forecast, 2019-2031
- 9.1. Market Analysis, Insights and Forecast - by Type
- 9.1.1. Organic
- 9.1.2. Conventional
- 9.2. Market Analysis, Insights and Forecast - by Distribution Channel
- 9.2.1. Supermarkets/Hypermarkets
- 9.2.2. Convenience Stores
- 9.2.3. Specialty Stores
- 9.2.4. Online Retail Stores
- 9.2.5. Other Distribution Channels
- 9.1. Market Analysis, Insights and Forecast - by Type
- 10. Middle East and Africa Nutrition Bar Industry Analysis, Insights and Forecast, 2019-2031
- 10.1. Market Analysis, Insights and Forecast - by Type
- 10.1.1. Organic
- 10.1.2. Conventional
- 10.2. Market Analysis, Insights and Forecast - by Distribution Channel
- 10.2.1. Supermarkets/Hypermarkets
- 10.2.2. Convenience Stores
- 10.2.3. Specialty Stores
- 10.2.4. Online Retail Stores
- 10.2.5. Other Distribution Channels
- 10.1. Market Analysis, Insights and Forecast - by Type
- 11. Competitive Analysis
- 11.1. Global Market Share Analysis 2024
- 11.2. Company Profiles
- 11.2.1 The Kellogg Company
- 11.2.1.1. Overview
- 11.2.1.2. Products
- 11.2.1.3. SWOT Analysis
- 11.2.1.4. Recent Developments
- 11.2.1.5. Financials (Based on Availability)
- 11.2.2 Lotus Bakeries Corporate
- 11.2.2.1. Overview
- 11.2.2.2. Products
- 11.2.2.3. SWOT Analysis
- 11.2.2.4. Recent Developments
- 11.2.2.5. Financials (Based on Availability)
- 11.2.3 General Mills Inc
- 11.2.3.1. Overview
- 11.2.3.2. Products
- 11.2.3.3. SWOT Analysis
- 11.2.3.4. Recent Developments
- 11.2.3.5. Financials (Based on Availability)
- 11.2.4 Mondelēz International Inc (Clif Bar & Company)
- 11.2.4.1. Overview
- 11.2.4.2. Products
- 11.2.4.3. SWOT Analysis
- 11.2.4.4. Recent Developments
- 11.2.4.5. Financials (Based on Availability)
- 11.2.5 OTE Sports Ltd
- 11.2.5.1. Overview
- 11.2.5.2. Products
- 11.2.5.3. SWOT Analysis
- 11.2.5.4. Recent Developments
- 11.2.5.5. Financials (Based on Availability)
- 11.2.6 Post Holdings Inc
- 11.2.6.1. Overview
- 11.2.6.2. Products
- 11.2.6.3. SWOT Analysis
- 11.2.6.4. Recent Developments
- 11.2.6.5. Financials (Based on Availability)
- 11.2.7 Mars Incorporated (Kind LLC)
- 11.2.7.1. Overview
- 11.2.7.2. Products
- 11.2.7.3. SWOT Analysis
- 11.2.7.4. Recent Developments
- 11.2.7.5. Financials (Based on Availability)
- 11.2.8 PepsiCo Inc
- 11.2.8.1. Overview
- 11.2.8.2. Products
- 11.2.8.3. SWOT Analysis
- 11.2.8.4. Recent Developments
- 11.2.8.5. Financials (Based on Availability)
- 11.2.9 Wholesome Habits Private Limited (EAT Anytime)
- 11.2.9.1. Overview
- 11.2.9.2. Products
- 11.2.9.3. SWOT Analysis
- 11.2.9.4. Recent Developments
- 11.2.9.5. Financials (Based on Availability)
- 11.2.10 ProBar LLC
- 11.2.10.1. Overview
- 11.2.10.2. Products
- 11.2.10.3. SWOT Analysis
- 11.2.10.4. Recent Developments
- 11.2.10.5. Financials (Based on Availability)
- 11.2.11 Nestlé S A *List Not Exhaustive
- 11.2.11.1. Overview
- 11.2.11.2. Products
- 11.2.11.3. SWOT Analysis
- 11.2.11.4. Recent Developments
- 11.2.11.5. Financials (Based on Availability)
- 11.2.1 The Kellogg Company
List of Figures
- Figure 1: Global Nutrition Bar Industry Revenue Breakdown (Million, %) by Region 2024 & 2032
- Figure 2: Global Nutrition Bar Industry Volume Breakdown (Billion, %) by Region 2024 & 2032
- Figure 3: North America Nutrition Bar Industry Revenue (Million), by Type 2024 & 2032
- Figure 4: North America Nutrition Bar Industry Volume (Billion), by Type 2024 & 2032
- Figure 5: North America Nutrition Bar Industry Revenue Share (%), by Type 2024 & 2032
- Figure 6: North America Nutrition Bar Industry Volume Share (%), by Type 2024 & 2032
- Figure 7: North America Nutrition Bar Industry Revenue (Million), by Distribution Channel 2024 & 2032
- Figure 8: North America Nutrition Bar Industry Volume (Billion), by Distribution Channel 2024 & 2032
- Figure 9: North America Nutrition Bar Industry Revenue Share (%), by Distribution Channel 2024 & 2032
- Figure 10: North America Nutrition Bar Industry Volume Share (%), by Distribution Channel 2024 & 2032
- Figure 11: North America Nutrition Bar Industry Revenue (Million), by Country 2024 & 2032
- Figure 12: North America Nutrition Bar Industry Volume (Billion), by Country 2024 & 2032
- Figure 13: North America Nutrition Bar Industry Revenue Share (%), by Country 2024 & 2032
- Figure 14: North America Nutrition Bar Industry Volume Share (%), by Country 2024 & 2032
- Figure 15: Europe Nutrition Bar Industry Revenue (Million), by Type 2024 & 2032
- Figure 16: Europe Nutrition Bar Industry Volume (Billion), by Type 2024 & 2032
- Figure 17: Europe Nutrition Bar Industry Revenue Share (%), by Type 2024 & 2032
- Figure 18: Europe Nutrition Bar Industry Volume Share (%), by Type 2024 & 2032
- Figure 19: Europe Nutrition Bar Industry Revenue (Million), by Distribution Channel 2024 & 2032
- Figure 20: Europe Nutrition Bar Industry Volume (Billion), by Distribution Channel 2024 & 2032
- Figure 21: Europe Nutrition Bar Industry Revenue Share (%), by Distribution Channel 2024 & 2032
- Figure 22: Europe Nutrition Bar Industry Volume Share (%), by Distribution Channel 2024 & 2032
- Figure 23: Europe Nutrition Bar Industry Revenue (Million), by Country 2024 & 2032
- Figure 24: Europe Nutrition Bar Industry Volume (Billion), by Country 2024 & 2032
- Figure 25: Europe Nutrition Bar Industry Revenue Share (%), by Country 2024 & 2032
- Figure 26: Europe Nutrition Bar Industry Volume Share (%), by Country 2024 & 2032
- Figure 27: Asia Pacific Nutrition Bar Industry Revenue (Million), by Type 2024 & 2032
- Figure 28: Asia Pacific Nutrition Bar Industry Volume (Billion), by Type 2024 & 2032
- Figure 29: Asia Pacific Nutrition Bar Industry Revenue Share (%), by Type 2024 & 2032
- Figure 30: Asia Pacific Nutrition Bar Industry Volume Share (%), by Type 2024 & 2032
- Figure 31: Asia Pacific Nutrition Bar Industry Revenue (Million), by Distribution Channel 2024 & 2032
- Figure 32: Asia Pacific Nutrition Bar Industry Volume (Billion), by Distribution Channel 2024 & 2032
- Figure 33: Asia Pacific Nutrition Bar Industry Revenue Share (%), by Distribution Channel 2024 & 2032
- Figure 34: Asia Pacific Nutrition Bar Industry Volume Share (%), by Distribution Channel 2024 & 2032
- Figure 35: Asia Pacific Nutrition Bar Industry Revenue (Million), by Country 2024 & 2032
- Figure 36: Asia Pacific Nutrition Bar Industry Volume (Billion), by Country 2024 & 2032
- Figure 37: Asia Pacific Nutrition Bar Industry Revenue Share (%), by Country 2024 & 2032
- Figure 38: Asia Pacific Nutrition Bar Industry Volume Share (%), by Country 2024 & 2032
- Figure 39: South America Nutrition Bar Industry Revenue (Million), by Type 2024 & 2032
- Figure 40: South America Nutrition Bar Industry Volume (Billion), by Type 2024 & 2032
- Figure 41: South America Nutrition Bar Industry Revenue Share (%), by Type 2024 & 2032
- Figure 42: South America Nutrition Bar Industry Volume Share (%), by Type 2024 & 2032
- Figure 43: South America Nutrition Bar Industry Revenue (Million), by Distribution Channel 2024 & 2032
- Figure 44: South America Nutrition Bar Industry Volume (Billion), by Distribution Channel 2024 & 2032
- Figure 45: South America Nutrition Bar Industry Revenue Share (%), by Distribution Channel 2024 & 2032
- Figure 46: South America Nutrition Bar Industry Volume Share (%), by Distribution Channel 2024 & 2032
- Figure 47: South America Nutrition Bar Industry Revenue (Million), by Country 2024 & 2032
- Figure 48: South America Nutrition Bar Industry Volume (Billion), by Country 2024 & 2032
- Figure 49: South America Nutrition Bar Industry Revenue Share (%), by Country 2024 & 2032
- Figure 50: South America Nutrition Bar Industry Volume Share (%), by Country 2024 & 2032
- Figure 51: Middle East and Africa Nutrition Bar Industry Revenue (Million), by Type 2024 & 2032
- Figure 52: Middle East and Africa Nutrition Bar Industry Volume (Billion), by Type 2024 & 2032
- Figure 53: Middle East and Africa Nutrition Bar Industry Revenue Share (%), by Type 2024 & 2032
- Figure 54: Middle East and Africa Nutrition Bar Industry Volume Share (%), by Type 2024 & 2032
- Figure 55: Middle East and Africa Nutrition Bar Industry Revenue (Million), by Distribution Channel 2024 & 2032
- Figure 56: Middle East and Africa Nutrition Bar Industry Volume (Billion), by Distribution Channel 2024 & 2032
- Figure 57: Middle East and Africa Nutrition Bar Industry Revenue Share (%), by Distribution Channel 2024 & 2032
- Figure 58: Middle East and Africa Nutrition Bar Industry Volume Share (%), by Distribution Channel 2024 & 2032
- Figure 59: Middle East and Africa Nutrition Bar Industry Revenue (Million), by Country 2024 & 2032
- Figure 60: Middle East and Africa Nutrition Bar Industry Volume (Billion), by Country 2024 & 2032
- Figure 61: Middle East and Africa Nutrition Bar Industry Revenue Share (%), by Country 2024 & 2032
- Figure 62: Middle East and Africa Nutrition Bar Industry Volume Share (%), by Country 2024 & 2032
List of Tables
- Table 1: Global Nutrition Bar Industry Revenue Million Forecast, by Region 2019 & 2032
- Table 2: Global Nutrition Bar Industry Volume Billion Forecast, by Region 2019 & 2032
- Table 3: Global Nutrition Bar Industry Revenue Million Forecast, by Type 2019 & 2032
- Table 4: Global Nutrition Bar Industry Volume Billion Forecast, by Type 2019 & 2032
- Table 5: Global Nutrition Bar Industry Revenue Million Forecast, by Distribution Channel 2019 & 2032
- Table 6: Global Nutrition Bar Industry Volume Billion Forecast, by Distribution Channel 2019 & 2032
- Table 7: Global Nutrition Bar Industry Revenue Million Forecast, by Region 2019 & 2032
- Table 8: Global Nutrition Bar Industry Volume Billion Forecast, by Region 2019 & 2032
- Table 9: Global Nutrition Bar Industry Revenue Million Forecast, by Type 2019 & 2032
- Table 10: Global Nutrition Bar Industry Volume Billion Forecast, by Type 2019 & 2032
- Table 11: Global Nutrition Bar Industry Revenue Million Forecast, by Distribution Channel 2019 & 2032
- Table 12: Global Nutrition Bar Industry Volume Billion Forecast, by Distribution Channel 2019 & 2032
- Table 13: Global Nutrition Bar Industry Revenue Million Forecast, by Country 2019 & 2032
- Table 14: Global Nutrition Bar Industry Volume Billion Forecast, by Country 2019 & 2032
- Table 15: United States Nutrition Bar Industry Revenue (Million) Forecast, by Application 2019 & 2032
- Table 16: United States Nutrition Bar Industry Volume (Billion) Forecast, by Application 2019 & 2032
- Table 17: Canada Nutrition Bar Industry Revenue (Million) Forecast, by Application 2019 & 2032
- Table 18: Canada Nutrition Bar Industry Volume (Billion) Forecast, by Application 2019 & 2032
- Table 19: Mexico Nutrition Bar Industry Revenue (Million) Forecast, by Application 2019 & 2032
- Table 20: Mexico Nutrition Bar Industry Volume (Billion) Forecast, by Application 2019 & 2032
- Table 21: Rest of North America Nutrition Bar Industry Revenue (Million) Forecast, by Application 2019 & 2032
- Table 22: Rest of North America Nutrition Bar Industry Volume (Billion) Forecast, by Application 2019 & 2032
- Table 23: Global Nutrition Bar Industry Revenue Million Forecast, by Type 2019 & 2032
- Table 24: Global Nutrition Bar Industry Volume Billion Forecast, by Type 2019 & 2032
- Table 25: Global Nutrition Bar Industry Revenue Million Forecast, by Distribution Channel 2019 & 2032
- Table 26: Global Nutrition Bar Industry Volume Billion Forecast, by Distribution Channel 2019 & 2032
- Table 27: Global Nutrition Bar Industry Revenue Million Forecast, by Country 2019 & 2032
- Table 28: Global Nutrition Bar Industry Volume Billion Forecast, by Country 2019 & 2032
- Table 29: United Kingdom Nutrition Bar Industry Revenue (Million) Forecast, by Application 2019 & 2032
- Table 30: United Kingdom Nutrition Bar Industry Volume (Billion) Forecast, by Application 2019 & 2032
- Table 31: Germany Nutrition Bar Industry Revenue (Million) Forecast, by Application 2019 & 2032
- Table 32: Germany Nutrition Bar Industry Volume (Billion) Forecast, by Application 2019 & 2032
- Table 33: Spain Nutrition Bar Industry Revenue (Million) Forecast, by Application 2019 & 2032
- Table 34: Spain Nutrition Bar Industry Volume (Billion) Forecast, by Application 2019 & 2032
- Table 35: France Nutrition Bar Industry Revenue (Million) Forecast, by Application 2019 & 2032
- Table 36: France Nutrition Bar Industry Volume (Billion) Forecast, by Application 2019 & 2032
- Table 37: Italy Nutrition Bar Industry Revenue (Million) Forecast, by Application 2019 & 2032
- Table 38: Italy Nutrition Bar Industry Volume (Billion) Forecast, by Application 2019 & 2032
- Table 39: Russia Nutrition Bar Industry Revenue (Million) Forecast, by Application 2019 & 2032
- Table 40: Russia Nutrition Bar Industry Volume (Billion) Forecast, by Application 2019 & 2032
- Table 41: Rest of Europe Nutrition Bar Industry Revenue (Million) Forecast, by Application 2019 & 2032
- Table 42: Rest of Europe Nutrition Bar Industry Volume (Billion) Forecast, by Application 2019 & 2032
- Table 43: Global Nutrition Bar Industry Revenue Million Forecast, by Type 2019 & 2032
- Table 44: Global Nutrition Bar Industry Volume Billion Forecast, by Type 2019 & 2032
- Table 45: Global Nutrition Bar Industry Revenue Million Forecast, by Distribution Channel 2019 & 2032
- Table 46: Global Nutrition Bar Industry Volume Billion Forecast, by Distribution Channel 2019 & 2032
- Table 47: Global Nutrition Bar Industry Revenue Million Forecast, by Country 2019 & 2032
- Table 48: Global Nutrition Bar Industry Volume Billion Forecast, by Country 2019 & 2032
- Table 49: China Nutrition Bar Industry Revenue (Million) Forecast, by Application 2019 & 2032
- Table 50: China Nutrition Bar Industry Volume (Billion) Forecast, by Application 2019 & 2032
- Table 51: Japan Nutrition Bar Industry Revenue (Million) Forecast, by Application 2019 & 2032
- Table 52: Japan Nutrition Bar Industry Volume (Billion) Forecast, by Application 2019 & 2032
- Table 53: India Nutrition Bar Industry Revenue (Million) Forecast, by Application 2019 & 2032
- Table 54: India Nutrition Bar Industry Volume (Billion) Forecast, by Application 2019 & 2032
- Table 55: Australia Nutrition Bar Industry Revenue (Million) Forecast, by Application 2019 & 2032
- Table 56: Australia Nutrition Bar Industry Volume (Billion) Forecast, by Application 2019 & 2032
- Table 57: Rest of Asia Pacific Nutrition Bar Industry Revenue (Million) Forecast, by Application 2019 & 2032
- Table 58: Rest of Asia Pacific Nutrition Bar Industry Volume (Billion) Forecast, by Application 2019 & 2032
- Table 59: Global Nutrition Bar Industry Revenue Million Forecast, by Type 2019 & 2032
- Table 60: Global Nutrition Bar Industry Volume Billion Forecast, by Type 2019 & 2032
- Table 61: Global Nutrition Bar Industry Revenue Million Forecast, by Distribution Channel 2019 & 2032
- Table 62: Global Nutrition Bar Industry Volume Billion Forecast, by Distribution Channel 2019 & 2032
- Table 63: Global Nutrition Bar Industry Revenue Million Forecast, by Country 2019 & 2032
- Table 64: Global Nutrition Bar Industry Volume Billion Forecast, by Country 2019 & 2032
- Table 65: Brazil Nutrition Bar Industry Revenue (Million) Forecast, by Application 2019 & 2032
- Table 66: Brazil Nutrition Bar Industry Volume (Billion) Forecast, by Application 2019 & 2032
- Table 67: Argentina Nutrition Bar Industry Revenue (Million) Forecast, by Application 2019 & 2032
- Table 68: Argentina Nutrition Bar Industry Volume (Billion) Forecast, by Application 2019 & 2032
- Table 69: Rest of South America Nutrition Bar Industry Revenue (Million) Forecast, by Application 2019 & 2032
- Table 70: Rest of South America Nutrition Bar Industry Volume (Billion) Forecast, by Application 2019 & 2032
- Table 71: Global Nutrition Bar Industry Revenue Million Forecast, by Type 2019 & 2032
- Table 72: Global Nutrition Bar Industry Volume Billion Forecast, by Type 2019 & 2032
- Table 73: Global Nutrition Bar Industry Revenue Million Forecast, by Distribution Channel 2019 & 2032
- Table 74: Global Nutrition Bar Industry Volume Billion Forecast, by Distribution Channel 2019 & 2032
- Table 75: Global Nutrition Bar Industry Revenue Million Forecast, by Country 2019 & 2032
- Table 76: Global Nutrition Bar Industry Volume Billion Forecast, by Country 2019 & 2032
- Table 77: Saudi Arabia Nutrition Bar Industry Revenue (Million) Forecast, by Application 2019 & 2032
- Table 78: Saudi Arabia Nutrition Bar Industry Volume (Billion) Forecast, by Application 2019 & 2032
- Table 79: South Africa Nutrition Bar Industry Revenue (Million) Forecast, by Application 2019 & 2032
- Table 80: South Africa Nutrition Bar Industry Volume (Billion) Forecast, by Application 2019 & 2032
- Table 81: Rest Middle East and Africa Nutrition Bar Industry Revenue (Million) Forecast, by Application 2019 & 2032
- Table 82: Rest Middle East and Africa Nutrition Bar Industry Volume (Billion) Forecast, by Application 2019 & 2032
Frequently Asked Questions
1. What is the projected Compound Annual Growth Rate (CAGR) of the Nutrition Bar Industry?
The projected CAGR is approximately 3.32%.
2. Which companies are prominent players in the Nutrition Bar Industry?
Key companies in the market include The Kellogg Company, Lotus Bakeries Corporate, General Mills Inc, Mondelēz International Inc (Clif Bar & Company), OTE Sports Ltd, Post Holdings Inc, Mars Incorporated (Kind LLC), PepsiCo Inc, Wholesome Habits Private Limited (EAT Anytime), ProBar LLC, Nestlé S A *List Not Exhaustive.
3. What are the main segments of the Nutrition Bar Industry?
The market segments include Type, Distribution Channel.
4. Can you provide details about the market size?
The market size is estimated to be USD 3.28 Million as of 2022.
5. What are some drivers contributing to market growth?
N/A
6. What are the notable trends driving market growth?
Rising Demand for Healthy On-the-go Snacking.
7. Are there any restraints impacting market growth?
N/A
8. Can you provide examples of recent developments in the market?
August 2022: Clif Bar & Company, which offers a range of energy bars, was acquired by Mondelez International, Inc. With leading brands like CLIF, CLIF Kid, and LUNA complementing the company's refrigerated snacking business in the United States and popular performance nutrition business Grenade in the United Kingdom, the acquisition is anticipated to increase Mondelez International's global snack bar business to more than USD 1 billion.
9. What pricing options are available for accessing the report?
Pricing options include single-user, multi-user, and enterprise licenses priced at USD 4750, USD 5250, and USD 8750 respectively.
10. Is the market size provided in terms of value or volume?
The market size is provided in terms of value, measured in Million and volume, measured in Billion.
11. Are there any specific market keywords associated with the report?
Yes, the market keyword associated with the report is "Nutrition Bar Industry," which aids in identifying and referencing the specific market segment covered.
12. How do I determine which pricing option suits my needs best?
The pricing options vary based on user requirements and access needs. Individual users may opt for single-user licenses, while businesses requiring broader access may choose multi-user or enterprise licenses for cost-effective access to the report.
13. Are there any additional resources or data provided in the Nutrition Bar Industry report?
While the report offers comprehensive insights, it's advisable to review the specific contents or supplementary materials provided to ascertain if additional resources or data are available.
14. How can I stay updated on further developments or reports in the Nutrition Bar Industry?
To stay informed about further developments, trends, and reports in the Nutrition Bar Industry, consider subscribing to industry newsletters, following relevant companies and organizations, or regularly checking reputable industry news sources and publications.
Methodology
Step 1 - Identification of Relevant Samples Size from Population Database


Step 2 - Approaches for Defining Global Market Size (Value, Volume* & Price*)

Note*: In applicable scenarios
Step 3 - Data Sources
Primary Research
- Web Analytics
- Survey Reports
- Research Institute
- Latest Research Reports
- Opinion Leaders
Secondary Research
- Annual Reports
- White Paper
- Latest Press Release
- Industry Association
- Paid Database
- Investor Presentations

Step 4 - Data Triangulation
Involves using different sources of information in order to increase the validity of a study
These sources are likely to be stakeholders in a program - participants, other researchers, program staff, other community members, and so on.
Then we put all data in single framework & apply various statistical tools to find out the dynamic on the market.
During the analysis stage, feedback from the stakeholder groups would be compared to determine areas of agreement as well as areas of divergence


