

Key Insights
The global fruit and vegetable juice market, valued at $111.07 billion in the 2025 base year, is projected to grow at a Compound Annual Growth Rate (CAGR) of 5.6% from 2025 to 2033. This growth is propelled by increasing consumer health consciousness and a preference for nutritious, convenient beverages. The rising incidence of lifestyle-related health issues also supports demand. Innovations in packaging, such as single-serve and ready-to-drink formats, enhance accessibility. Product development, including functional juices fortified with vitamins and probiotics, aligns with evolving consumer preferences. E-commerce expansion offers new distribution channels, complementing traditional supermarket and hypermarket sales. Challenges include raw material price volatility and concerns regarding added sugars and preservatives, offset by the growth of premium, organic, and cold-pressed varieties.
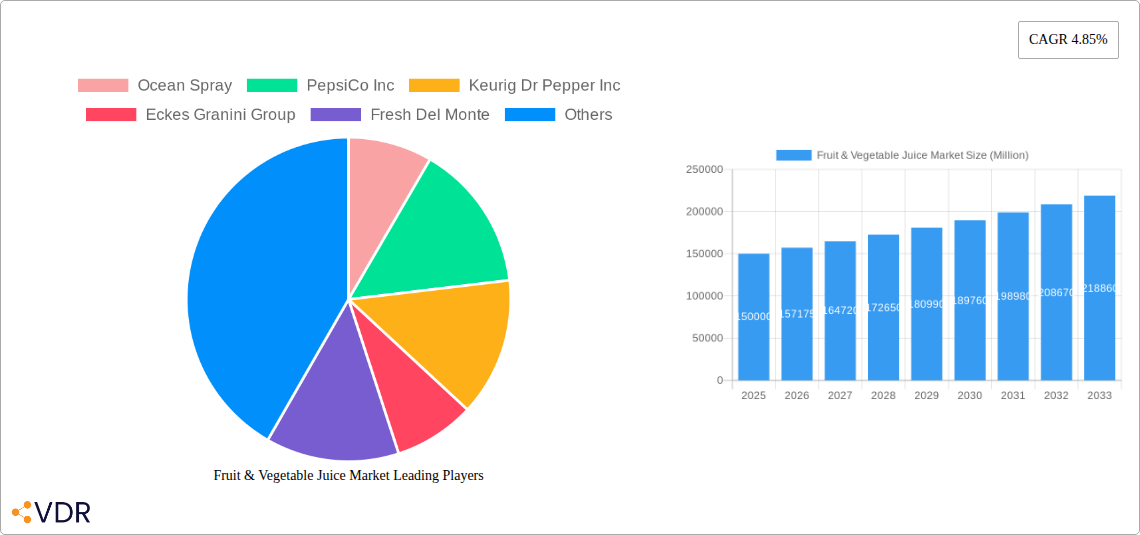
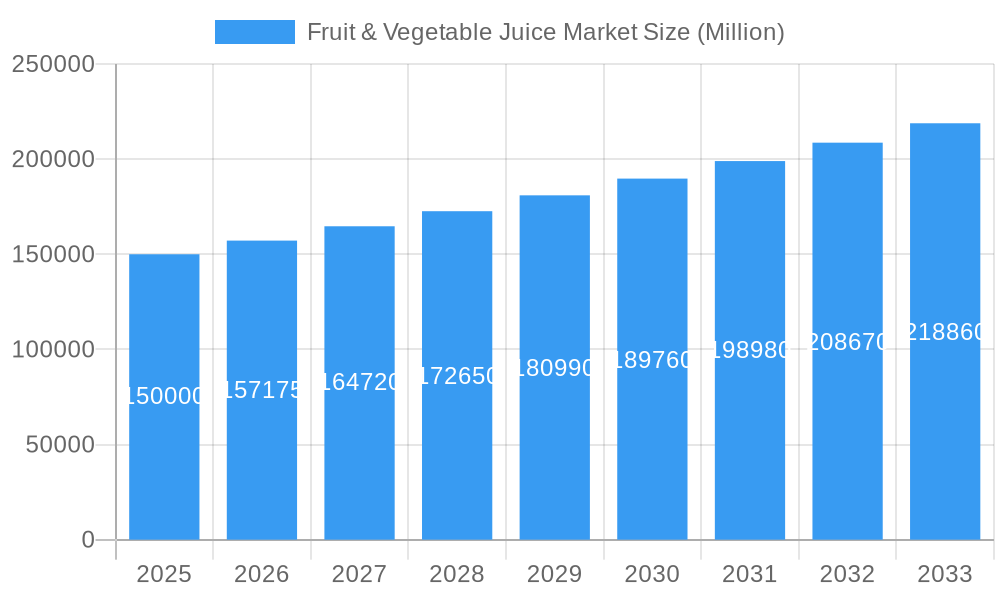
Fruit & Vegetable Juice Market Market Size (In Billion)
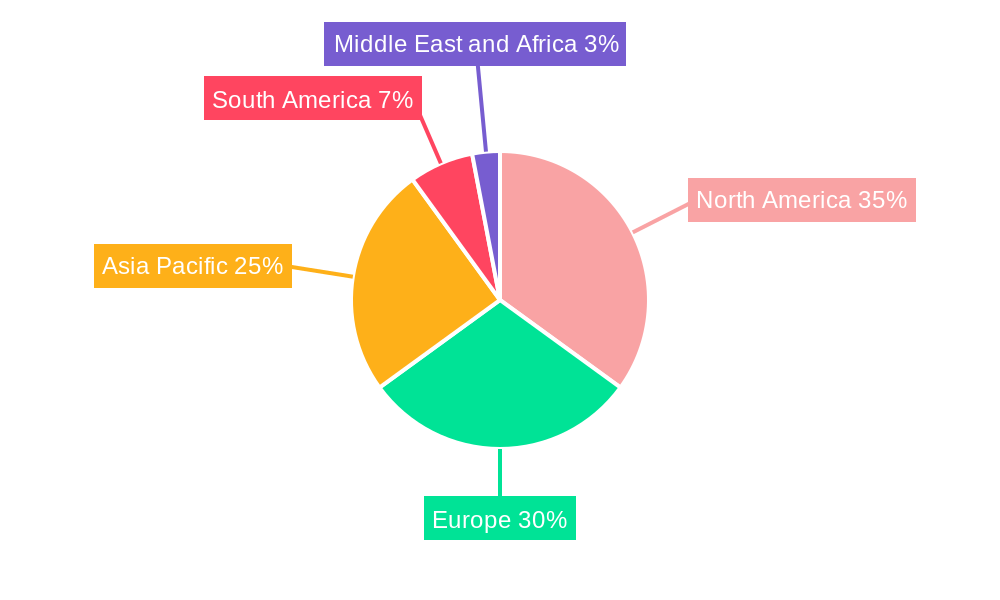
Market segmentation indicates that fruit juices hold the largest share, followed by vegetable juices and nectars. North America and Europe currently lead market consumption, supported by robust distribution. However, the Asia-Pacific region is anticipated to exhibit the fastest growth, driven by increasing disposable incomes, evolving lifestyles, and expanding middle-class populations in key markets like India and China. The competitive landscape features multinational corporations and specialized niche players, with ongoing mergers, acquisitions, and product innovation shaping market dynamics.
Fruit & Vegetable Juice Market Company Market Share
Fruit & Vegetable Juice Market: A Comprehensive Report (2019-2033)
This comprehensive report provides an in-depth analysis of the Fruit & Vegetable Juice Market, encompassing market dynamics, growth trends, regional segmentation, product landscape, key players, and future outlook. The study period covers 2019-2033, with 2025 as the base year and a forecast period of 2025-2033. The report offers valuable insights for industry professionals, investors, and stakeholders seeking to understand and capitalize on opportunities within this dynamic market. The market size is predicted to reach xx Million units by 2033.
Fruit & Vegetable Juice Market Dynamics & Structure
The fruit and vegetable juice market is characterized by a moderately concentrated landscape with several multinational corporations and regional players vying for market share. Market concentration is influenced by factors such as brand recognition, distribution networks, and economies of scale. Technological innovations, particularly in packaging, preservation, and flavor enhancement, play a crucial role. Stringent regulatory frameworks concerning food safety and labeling standards significantly impact product development and marketing strategies. Competitive substitutes, including carbonated soft drinks, energy drinks, and other beverages, pose challenges to market growth. End-user demographics, particularly the growing health-conscious consumer base, are driving demand for healthier juice options. M&A activity remains moderate with xx deals recorded during the historical period (2019-2024), indicating consolidation and expansion strategies among key players.
- Market Concentration: Moderately concentrated, with top players holding xx% market share in 2025.
- Technological Innovation: Focus on shelf-life extension technologies, innovative flavor profiles, and sustainable packaging.
- Regulatory Framework: Stringent food safety and labeling regulations impacting market dynamics.
- Competitive Substitutes: Carbonated drinks, energy drinks, and other beverages compete for consumer attention.
- End-User Demographics: Health-conscious consumers are driving demand for natural and functional juices.
- M&A Activity: xx M&A deals during 2019-2024 reflecting ongoing market consolidation.
Fruit & Vegetable Juice Market Growth Trends & Insights
The global fruit and vegetable juice market exhibits a robust growth trajectory, driven by shifting consumer preferences towards healthier beverages and increasing disposable incomes. The market witnessed a CAGR of xx% during the historical period (2019-2024), and is projected to grow at a CAGR of xx% during the forecast period (2025-2033). This growth is fueled by several factors, including the rising awareness of the health benefits of consuming fruits and vegetables, the increasing demand for convenient and ready-to-drink beverages, and the growing popularity of functional juices enriched with added vitamins and nutrients. The market penetration of fruit and vegetable juices in developing economies is also increasing, with rising urbanization and changing lifestyles. Technological disruptions, such as the introduction of innovative packaging and processing technologies, further propel market expansion. Consumer behavior shifts towards premiumization and the growing demand for organic and ethically sourced products present significant opportunities for market players.
Dominant Regions, Countries, or Segments in Fruit & Vegetable Juice Market
The North American region is currently the dominant market for fruit and vegetable juices, representing xx% of global market share in 2025. This dominance is attributed to high per capita consumption, strong brand presence, and well-established distribution channels. However, significant growth potential is observed in emerging markets of Asia-Pacific and Latin America. Within the product type segment, fruit juices hold the largest market share (xx%), driven by a wide variety of available flavors and established consumer preferences. The supermarkets/hypermarkets distribution channel remains dominant (xx% market share), owing to its widespread availability and established brand presence.
- Key Drivers for North America: High per capita consumption, strong brand presence, and developed distribution networks.
- Growth Potential in Asia-Pacific and Latin America: Rising disposable incomes, increasing urbanization, and growing health consciousness.
- Dominant Product Type: Fruit Juices (xx% market share), driven by diverse flavors and strong consumer preference.
- Dominant Distribution Channel: Supermarkets/Hypermarkets (xx% market share), owing to wide availability and brand presence.
Fruit & Vegetable Juice Market Product Landscape
The fruit and vegetable juice market is characterized by a diverse product landscape, including conventional juices, nectars, blended juices, functional juices (with added vitamins/minerals), and organic juices. Recent innovations focus on incorporating superfoods, natural sweeteners (like stevia), and unique flavor profiles to meet the changing consumer preferences. Products are constantly being improved through innovative processing techniques aimed at preserving nutritional value and extending shelf life. The market increasingly features products marketed on the basis of health benefits and ethically-sourced ingredients. Unique selling propositions include organic certifications, fair-trade sourcing, and innovative flavor combinations.
Key Drivers, Barriers & Challenges in Fruit & Vegetable Juice Market
Key Drivers:
The growing health-conscious population is driving the demand for healthy beverages. The convenience factor of ready-to-drink formats is boosting sales. Technological innovations, such as improved preservation techniques, are expanding the market's reach.
Key Challenges:
Fluctuations in raw material prices and supply chain disruptions create cost pressures. Stringent regulatory requirements increase compliance costs. Intense competition from other beverage categories restricts market growth. Maintaining product quality and freshness is critical for consumer satisfaction.
Emerging Opportunities in Fruit & Vegetable Juice Market
Untapped markets in developing countries present significant opportunities for expansion. The demand for functional juices with added health benefits creates a niche for specialized products. Innovative packaging solutions, such as aseptic packaging and single-serve formats, improve convenience and extend shelf life. Evolving consumer preferences towards organic and plant-based products drive demand for healthier options.
Growth Accelerators in the Fruit & Vegetable Juice Market Industry
Technological advancements in preservation and packaging are enhancing product quality and shelf life. Strategic partnerships with retailers and food service providers expand market reach. Expansion into emerging markets taps into new consumer segments. Focusing on premium and functional juices caters to evolving consumer preferences.
Key Players Shaping the Fruit & Vegetable Juice Market Market
Notable Milestones in Fruit & Vegetable Juice Market Sector
- November 2021: Star launches UAE's first naturally sweetened fruit juice range using Stevia.
- May 2022: Bidco launches joOz Boost+ fruit juice in Kenya, approved by KEBS.
- July 2022: Tipco launches vegetable and herb-infused drinks in Southeast Asia and the Middle East.
In-Depth Fruit & Vegetable Juice Market Market Outlook
The future of the fruit and vegetable juice market is bright, driven by sustained consumer demand for healthy and convenient beverages. Market growth will be further fueled by technological innovations, expansion into new geographical markets, and the development of innovative product offerings, including functional and organic juices. Strategic partnerships and acquisitions will continue to shape the market landscape, with key players striving to enhance their product portfolios and expand their reach. The market presents significant opportunities for companies that can effectively leverage technological advancements, cater to evolving consumer preferences, and establish robust distribution networks.
Fruit & Vegetable Juice Market Segmentation
-
1. Category
- 1.1. Fruit
- 1.2. Vegetable
-
2. Type
- 2.1. Still Juice Drinks
- 2.2. 100% juice
- 2.3. Nectar
-
3. Distribution Channel
- 3.1. Supermarkets/Hypermarkets
- 3.2. Convenience Stores
- 3.3. Specialty Stores
- 3.4. Online Retail Stores
- 3.5. Other Distribution Channels
Fruit & Vegetable Juice Market Segmentation By Geography
-
1. North America
- 1.1. United States
- 1.2. Canada
- 1.3. Mexico
- 1.4. Rest of North America
-
2. Europe
- 2.1. United Kingdom
- 2.2. Germany
- 2.3. Spain
- 2.4. France
- 2.5. Italy
- 2.6. Russia
- 2.7. Rest of Europe
-
3. Asia Pacific
- 3.1. China
- 3.2. Japan
- 3.3. India
- 3.4. Australia
- 3.5. Rest of Asia Pacific
-
4. South America
- 4.1. Brazil
- 4.2. Argentina
- 4.3. Rest of South America
-
5. Middle East and Africa
- 5.1. Saudi Arabia
- 5.2. South Africa
- 5.3. Rest of Middle East and Africa
Fruit & Vegetable Juice Market Regional Market Share
Geographic Coverage of Fruit & Vegetable Juice Market
Fruit & Vegetable Juice Market REPORT HIGHLIGHTS
| Aspects | Details |
|---|---|
| Study Period | 2020-2034 |
| Base Year | 2025 |
| Estimated Year | 2026 |
| Forecast Period | 2026-2034 |
| Historical Period | 2020-2025 |
| Growth Rate | CAGR of 5.6% from 2020-2034 |
| Segmentation |
|
Table of Contents
- 1. Introduction
- 1.1. Research Scope
- 1.2. Market Segmentation
- 1.3. Research Objective
- 1.4. Definitions and Assumptions
- 2. Executive Summary
- 2.1. Market Snapshot
- 3. Market Dynamics
- 3.1. Market Drivers
- 3.2. Market Restrains
- 3.3. Market Trends
- 3.4. Market Opportunities
- 4. Market Factor Analysis
- 4.1. Porters Five Forces
- 4.1.1. Bargaining Power of Suppliers
- 4.1.2. Bargaining Power of Buyers
- 4.1.3. Threat of New Entrants
- 4.1.4. Threat of Substitutes
- 4.1.5. Competitive Rivalry
- 4.2. PESTEL analysis
- 4.3. BCG Analysis
- 4.3.1. Stars (High Growth, High Market Share)
- 4.3.2. Cash Cows (Low Growth, High Market Share)
- 4.3.3. Question Mark (High Growth, Low Market Share)
- 4.3.4. Dogs (Low Growth, Low Market Share)
- 4.4. Ansoff Matrix Analysis
- 4.5. Supply Chain Analysis
- 4.6. Regulatory Landscape
- 4.7. Current Market Potential and Opportunity Assessment (TAM–SAM–SOM Framework)
- 4.8. VDR Analyst Note
- 4.1. Porters Five Forces
- 5. Market Analysis, Insights and Forecast 2021-2033
- 5.1. Market Analysis, Insights and Forecast - by Category
- 5.1.1. Fruit
- 5.1.2. Vegetable
- 5.2. Market Analysis, Insights and Forecast - by Type
- 5.2.1. Still Juice Drinks
- 5.2.2. 100% juice
- 5.2.3. Nectar
- 5.3. Market Analysis, Insights and Forecast - by Distribution Channel
- 5.3.1. Supermarkets/Hypermarkets
- 5.3.2. Convenience Stores
- 5.3.3. Specialty Stores
- 5.3.4. Online Retail Stores
- 5.3.5. Other Distribution Channels
- 5.4. Market Analysis, Insights and Forecast - by Region
- 5.4.1. North America
- 5.4.2. Europe
- 5.4.3. Asia Pacific
- 5.4.4. South America
- 5.4.5. Middle East and Africa
- 5.1. Market Analysis, Insights and Forecast - by Category
- 6. Global Fruit & Vegetable Juice Market Analysis, Insights and Forecast, 2021-2033
- 6.1. Market Analysis, Insights and Forecast - by Category
- 6.1.1. Fruit
- 6.1.2. Vegetable
- 6.2. Market Analysis, Insights and Forecast - by Type
- 6.2.1. Still Juice Drinks
- 6.2.2. 100% juice
- 6.2.3. Nectar
- 6.3. Market Analysis, Insights and Forecast - by Distribution Channel
- 6.3.1. Supermarkets/Hypermarkets
- 6.3.2. Convenience Stores
- 6.3.3. Specialty Stores
- 6.3.4. Online Retail Stores
- 6.3.5. Other Distribution Channels
- 6.1. Market Analysis, Insights and Forecast - by Category
- 7. North America Fruit & Vegetable Juice Market Analysis, Insights and Forecast, 2021-2033
- 7.1. Market Analysis, Insights and Forecast - by Category
- 7.1.1. Fruit
- 7.1.2. Vegetable
- 7.2. Market Analysis, Insights and Forecast - by Type
- 7.2.1. Still Juice Drinks
- 7.2.2. 100% juice
- 7.2.3. Nectar
- 7.3. Market Analysis, Insights and Forecast - by Distribution Channel
- 7.3.1. Supermarkets/Hypermarkets
- 7.3.2. Convenience Stores
- 7.3.3. Specialty Stores
- 7.3.4. Online Retail Stores
- 7.3.5. Other Distribution Channels
- 7.1. Market Analysis, Insights and Forecast - by Category
- 8. Europe Fruit & Vegetable Juice Market Analysis, Insights and Forecast, 2021-2033
- 8.1. Market Analysis, Insights and Forecast - by Category
- 8.1.1. Fruit
- 8.1.2. Vegetable
- 8.2. Market Analysis, Insights and Forecast - by Type
- 8.2.1. Still Juice Drinks
- 8.2.2. 100% juice
- 8.2.3. Nectar
- 8.3. Market Analysis, Insights and Forecast - by Distribution Channel
- 8.3.1. Supermarkets/Hypermarkets
- 8.3.2. Convenience Stores
- 8.3.3. Specialty Stores
- 8.3.4. Online Retail Stores
- 8.3.5. Other Distribution Channels
- 8.1. Market Analysis, Insights and Forecast - by Category
- 9. Asia Pacific Fruit & Vegetable Juice Market Analysis, Insights and Forecast, 2021-2033
- 9.1. Market Analysis, Insights and Forecast - by Category
- 9.1.1. Fruit
- 9.1.2. Vegetable
- 9.2. Market Analysis, Insights and Forecast - by Type
- 9.2.1. Still Juice Drinks
- 9.2.2. 100% juice
- 9.2.3. Nectar
- 9.3. Market Analysis, Insights and Forecast - by Distribution Channel
- 9.3.1. Supermarkets/Hypermarkets
- 9.3.2. Convenience Stores
- 9.3.3. Specialty Stores
- 9.3.4. Online Retail Stores
- 9.3.5. Other Distribution Channels
- 9.1. Market Analysis, Insights and Forecast - by Category
- 10. South America Fruit & Vegetable Juice Market Analysis, Insights and Forecast, 2021-2033
- 10.1. Market Analysis, Insights and Forecast - by Category
- 10.1.1. Fruit
- 10.1.2. Vegetable
- 10.2. Market Analysis, Insights and Forecast - by Type
- 10.2.1. Still Juice Drinks
- 10.2.2. 100% juice
- 10.2.3. Nectar
- 10.3. Market Analysis, Insights and Forecast - by Distribution Channel
- 10.3.1. Supermarkets/Hypermarkets
- 10.3.2. Convenience Stores
- 10.3.3. Specialty Stores
- 10.3.4. Online Retail Stores
- 10.3.5. Other Distribution Channels
- 10.1. Market Analysis, Insights and Forecast - by Category
- 11. Middle East and Africa Fruit & Vegetable Juice Market Analysis, Insights and Forecast, 2021-2033
- 11.1. Market Analysis, Insights and Forecast - by Category
- 11.1.1. Fruit
- 11.1.2. Vegetable
- 11.2. Market Analysis, Insights and Forecast - by Type
- 11.2.1. Still Juice Drinks
- 11.2.2. 100% juice
- 11.2.3. Nectar
- 11.3. Market Analysis, Insights and Forecast - by Distribution Channel
- 11.3.1. Supermarkets/Hypermarkets
- 11.3.2. Convenience Stores
- 11.3.3. Specialty Stores
- 11.3.4. Online Retail Stores
- 11.3.5. Other Distribution Channels
- 11.1. Market Analysis, Insights and Forecast - by Category
- 12. Competitive Analysis
- 12.1. Company Profiles
- 12.1.1 Ocean Spray
- 12.1.1.1. Company Overview
- 12.1.1.2. Products
- 12.1.1.3. Company Financials
- 12.1.1.4. SWOT Analysis
- 12.1.2 PepsiCo Inc
- 12.1.2.1. Company Overview
- 12.1.2.2. Products
- 12.1.2.3. Company Financials
- 12.1.2.4. SWOT Analysis
- 12.1.3 Keurig Dr Pepper Inc
- 12.1.3.1. Company Overview
- 12.1.3.2. Products
- 12.1.3.3. Company Financials
- 12.1.3.4. SWOT Analysis
- 12.1.4 Eckes Granini Group
- 12.1.4.1. Company Overview
- 12.1.4.2. Products
- 12.1.4.3. Company Financials
- 12.1.4.4. SWOT Analysis
- 12.1.5 Fresh Del Monte
- 12.1.5.1. Company Overview
- 12.1.5.2. Products
- 12.1.5.3. Company Financials
- 12.1.5.4. SWOT Analysis
- 12.1.6 The Kraft Heinz Company
- 12.1.6.1. Company Overview
- 12.1.6.2. Products
- 12.1.6.3. Company Financials
- 12.1.6.4. SWOT Analysis
- 12.1.7 The Coca-Cola Company
- 12.1.7.1. Company Overview
- 12.1.7.2. Products
- 12.1.7.3. Company Financials
- 12.1.7.4. SWOT Analysis
- 12.1.8 Campbell Soup Company
- 12.1.8.1. Company Overview
- 12.1.8.2. Products
- 12.1.8.3. Company Financials
- 12.1.8.4. SWOT Analysis
- 12.1.9 Citrus World Inc
- 12.1.9.1. Company Overview
- 12.1.9.2. Products
- 12.1.9.3. Company Financials
- 12.1.9.4. SWOT Analysis
- 12.1.10 Welch's
- 12.1.10.1. Company Overview
- 12.1.10.2. Products
- 12.1.10.3. Company Financials
- 12.1.10.4. SWOT Analysis
- 12.1.1 Ocean Spray
- 12.2. Market Entropy
- 12.2.1 Company's Key Areas Served
- 12.2.2 Recent Developments
- 12.3. Company Market Share Analysis 2025
- 12.3.1 Top 5 Companies Market Share Analysis
- 12.3.2 Top 3 Companies Market Share Analysis
- 12.4. List of Potential Customers
- 13. Research Methodology
List of Figures
- Figure 1: Global Fruit & Vegetable Juice Market Revenue Breakdown (billion, %) by Region 2025 & 2033
- Figure 2: Global Fruit & Vegetable Juice Market Volume Breakdown (K Litres, %) by Region 2025 & 2033
- Figure 3: North America Fruit & Vegetable Juice Market Revenue (billion), by Category 2025 & 2033
- Figure 4: North America Fruit & Vegetable Juice Market Volume (K Litres), by Category 2025 & 2033
- Figure 5: North America Fruit & Vegetable Juice Market Revenue Share (%), by Category 2025 & 2033
- Figure 6: North America Fruit & Vegetable Juice Market Volume Share (%), by Category 2025 & 2033
- Figure 7: North America Fruit & Vegetable Juice Market Revenue (billion), by Type 2025 & 2033
- Figure 8: North America Fruit & Vegetable Juice Market Volume (K Litres), by Type 2025 & 2033
- Figure 9: North America Fruit & Vegetable Juice Market Revenue Share (%), by Type 2025 & 2033
- Figure 10: North America Fruit & Vegetable Juice Market Volume Share (%), by Type 2025 & 2033
- Figure 11: North America Fruit & Vegetable Juice Market Revenue (billion), by Distribution Channel 2025 & 2033
- Figure 12: North America Fruit & Vegetable Juice Market Volume (K Litres), by Distribution Channel 2025 & 2033
- Figure 13: North America Fruit & Vegetable Juice Market Revenue Share (%), by Distribution Channel 2025 & 2033
- Figure 14: North America Fruit & Vegetable Juice Market Volume Share (%), by Distribution Channel 2025 & 2033
- Figure 15: North America Fruit & Vegetable Juice Market Revenue (billion), by Country 2025 & 2033
- Figure 16: North America Fruit & Vegetable Juice Market Volume (K Litres), by Country 2025 & 2033
- Figure 17: North America Fruit & Vegetable Juice Market Revenue Share (%), by Country 2025 & 2033
- Figure 18: North America Fruit & Vegetable Juice Market Volume Share (%), by Country 2025 & 2033
- Figure 19: Europe Fruit & Vegetable Juice Market Revenue (billion), by Category 2025 & 2033
- Figure 20: Europe Fruit & Vegetable Juice Market Volume (K Litres), by Category 2025 & 2033
- Figure 21: Europe Fruit & Vegetable Juice Market Revenue Share (%), by Category 2025 & 2033
- Figure 22: Europe Fruit & Vegetable Juice Market Volume Share (%), by Category 2025 & 2033
- Figure 23: Europe Fruit & Vegetable Juice Market Revenue (billion), by Type 2025 & 2033
- Figure 24: Europe Fruit & Vegetable Juice Market Volume (K Litres), by Type 2025 & 2033
- Figure 25: Europe Fruit & Vegetable Juice Market Revenue Share (%), by Type 2025 & 2033
- Figure 26: Europe Fruit & Vegetable Juice Market Volume Share (%), by Type 2025 & 2033
- Figure 27: Europe Fruit & Vegetable Juice Market Revenue (billion), by Distribution Channel 2025 & 2033
- Figure 28: Europe Fruit & Vegetable Juice Market Volume (K Litres), by Distribution Channel 2025 & 2033
- Figure 29: Europe Fruit & Vegetable Juice Market Revenue Share (%), by Distribution Channel 2025 & 2033
- Figure 30: Europe Fruit & Vegetable Juice Market Volume Share (%), by Distribution Channel 2025 & 2033
- Figure 31: Europe Fruit & Vegetable Juice Market Revenue (billion), by Country 2025 & 2033
- Figure 32: Europe Fruit & Vegetable Juice Market Volume (K Litres), by Country 2025 & 2033
- Figure 33: Europe Fruit & Vegetable Juice Market Revenue Share (%), by Country 2025 & 2033
- Figure 34: Europe Fruit & Vegetable Juice Market Volume Share (%), by Country 2025 & 2033
- Figure 35: Asia Pacific Fruit & Vegetable Juice Market Revenue (billion), by Category 2025 & 2033
- Figure 36: Asia Pacific Fruit & Vegetable Juice Market Volume (K Litres), by Category 2025 & 2033
- Figure 37: Asia Pacific Fruit & Vegetable Juice Market Revenue Share (%), by Category 2025 & 2033
- Figure 38: Asia Pacific Fruit & Vegetable Juice Market Volume Share (%), by Category 2025 & 2033
- Figure 39: Asia Pacific Fruit & Vegetable Juice Market Revenue (billion), by Type 2025 & 2033
- Figure 40: Asia Pacific Fruit & Vegetable Juice Market Volume (K Litres), by Type 2025 & 2033
- Figure 41: Asia Pacific Fruit & Vegetable Juice Market Revenue Share (%), by Type 2025 & 2033
- Figure 42: Asia Pacific Fruit & Vegetable Juice Market Volume Share (%), by Type 2025 & 2033
- Figure 43: Asia Pacific Fruit & Vegetable Juice Market Revenue (billion), by Distribution Channel 2025 & 2033
- Figure 44: Asia Pacific Fruit & Vegetable Juice Market Volume (K Litres), by Distribution Channel 2025 & 2033
- Figure 45: Asia Pacific Fruit & Vegetable Juice Market Revenue Share (%), by Distribution Channel 2025 & 2033
- Figure 46: Asia Pacific Fruit & Vegetable Juice Market Volume Share (%), by Distribution Channel 2025 & 2033
- Figure 47: Asia Pacific Fruit & Vegetable Juice Market Revenue (billion), by Country 2025 & 2033
- Figure 48: Asia Pacific Fruit & Vegetable Juice Market Volume (K Litres), by Country 2025 & 2033
- Figure 49: Asia Pacific Fruit & Vegetable Juice Market Revenue Share (%), by Country 2025 & 2033
- Figure 50: Asia Pacific Fruit & Vegetable Juice Market Volume Share (%), by Country 2025 & 2033
- Figure 51: South America Fruit & Vegetable Juice Market Revenue (billion), by Category 2025 & 2033
- Figure 52: South America Fruit & Vegetable Juice Market Volume (K Litres), by Category 2025 & 2033
- Figure 53: South America Fruit & Vegetable Juice Market Revenue Share (%), by Category 2025 & 2033
- Figure 54: South America Fruit & Vegetable Juice Market Volume Share (%), by Category 2025 & 2033
- Figure 55: South America Fruit & Vegetable Juice Market Revenue (billion), by Type 2025 & 2033
- Figure 56: South America Fruit & Vegetable Juice Market Volume (K Litres), by Type 2025 & 2033
- Figure 57: South America Fruit & Vegetable Juice Market Revenue Share (%), by Type 2025 & 2033
- Figure 58: South America Fruit & Vegetable Juice Market Volume Share (%), by Type 2025 & 2033
- Figure 59: South America Fruit & Vegetable Juice Market Revenue (billion), by Distribution Channel 2025 & 2033
- Figure 60: South America Fruit & Vegetable Juice Market Volume (K Litres), by Distribution Channel 2025 & 2033
- Figure 61: South America Fruit & Vegetable Juice Market Revenue Share (%), by Distribution Channel 2025 & 2033
- Figure 62: South America Fruit & Vegetable Juice Market Volume Share (%), by Distribution Channel 2025 & 2033
- Figure 63: South America Fruit & Vegetable Juice Market Revenue (billion), by Country 2025 & 2033
- Figure 64: South America Fruit & Vegetable Juice Market Volume (K Litres), by Country 2025 & 2033
- Figure 65: South America Fruit & Vegetable Juice Market Revenue Share (%), by Country 2025 & 2033
- Figure 66: South America Fruit & Vegetable Juice Market Volume Share (%), by Country 2025 & 2033
- Figure 67: Middle East and Africa Fruit & Vegetable Juice Market Revenue (billion), by Category 2025 & 2033
- Figure 68: Middle East and Africa Fruit & Vegetable Juice Market Volume (K Litres), by Category 2025 & 2033
- Figure 69: Middle East and Africa Fruit & Vegetable Juice Market Revenue Share (%), by Category 2025 & 2033
- Figure 70: Middle East and Africa Fruit & Vegetable Juice Market Volume Share (%), by Category 2025 & 2033
- Figure 71: Middle East and Africa Fruit & Vegetable Juice Market Revenue (billion), by Type 2025 & 2033
- Figure 72: Middle East and Africa Fruit & Vegetable Juice Market Volume (K Litres), by Type 2025 & 2033
- Figure 73: Middle East and Africa Fruit & Vegetable Juice Market Revenue Share (%), by Type 2025 & 2033
- Figure 74: Middle East and Africa Fruit & Vegetable Juice Market Volume Share (%), by Type 2025 & 2033
- Figure 75: Middle East and Africa Fruit & Vegetable Juice Market Revenue (billion), by Distribution Channel 2025 & 2033
- Figure 76: Middle East and Africa Fruit & Vegetable Juice Market Volume (K Litres), by Distribution Channel 2025 & 2033
- Figure 77: Middle East and Africa Fruit & Vegetable Juice Market Revenue Share (%), by Distribution Channel 2025 & 2033
- Figure 78: Middle East and Africa Fruit & Vegetable Juice Market Volume Share (%), by Distribution Channel 2025 & 2033
- Figure 79: Middle East and Africa Fruit & Vegetable Juice Market Revenue (billion), by Country 2025 & 2033
- Figure 80: Middle East and Africa Fruit & Vegetable Juice Market Volume (K Litres), by Country 2025 & 2033
- Figure 81: Middle East and Africa Fruit & Vegetable Juice Market Revenue Share (%), by Country 2025 & 2033
- Figure 82: Middle East and Africa Fruit & Vegetable Juice Market Volume Share (%), by Country 2025 & 2033
List of Tables
- Table 1: Global Fruit & Vegetable Juice Market Revenue billion Forecast, by Category 2020 & 2033
- Table 2: Global Fruit & Vegetable Juice Market Volume K Litres Forecast, by Category 2020 & 2033
- Table 3: Global Fruit & Vegetable Juice Market Revenue billion Forecast, by Type 2020 & 2033
- Table 4: Global Fruit & Vegetable Juice Market Volume K Litres Forecast, by Type 2020 & 2033
- Table 5: Global Fruit & Vegetable Juice Market Revenue billion Forecast, by Distribution Channel 2020 & 2033
- Table 6: Global Fruit & Vegetable Juice Market Volume K Litres Forecast, by Distribution Channel 2020 & 2033
- Table 7: Global Fruit & Vegetable Juice Market Revenue billion Forecast, by Region 2020 & 2033
- Table 8: Global Fruit & Vegetable Juice Market Volume K Litres Forecast, by Region 2020 & 2033
- Table 9: Global Fruit & Vegetable Juice Market Revenue billion Forecast, by Category 2020 & 2033
- Table 10: Global Fruit & Vegetable Juice Market Volume K Litres Forecast, by Category 2020 & 2033
- Table 11: Global Fruit & Vegetable Juice Market Revenue billion Forecast, by Type 2020 & 2033
- Table 12: Global Fruit & Vegetable Juice Market Volume K Litres Forecast, by Type 2020 & 2033
- Table 13: Global Fruit & Vegetable Juice Market Revenue billion Forecast, by Distribution Channel 2020 & 2033
- Table 14: Global Fruit & Vegetable Juice Market Volume K Litres Forecast, by Distribution Channel 2020 & 2033
- Table 15: Global Fruit & Vegetable Juice Market Revenue billion Forecast, by Country 2020 & 2033
- Table 16: Global Fruit & Vegetable Juice Market Volume K Litres Forecast, by Country 2020 & 2033
- Table 17: United States Fruit & Vegetable Juice Market Revenue (billion) Forecast, by Application 2020 & 2033
- Table 18: United States Fruit & Vegetable Juice Market Volume (K Litres) Forecast, by Application 2020 & 2033
- Table 19: Canada Fruit & Vegetable Juice Market Revenue (billion) Forecast, by Application 2020 & 2033
- Table 20: Canada Fruit & Vegetable Juice Market Volume (K Litres) Forecast, by Application 2020 & 2033
- Table 21: Mexico Fruit & Vegetable Juice Market Revenue (billion) Forecast, by Application 2020 & 2033
- Table 22: Mexico Fruit & Vegetable Juice Market Volume (K Litres) Forecast, by Application 2020 & 2033
- Table 23: Rest of North America Fruit & Vegetable Juice Market Revenue (billion) Forecast, by Application 2020 & 2033
- Table 24: Rest of North America Fruit & Vegetable Juice Market Volume (K Litres) Forecast, by Application 2020 & 2033
- Table 25: Global Fruit & Vegetable Juice Market Revenue billion Forecast, by Category 2020 & 2033
- Table 26: Global Fruit & Vegetable Juice Market Volume K Litres Forecast, by Category 2020 & 2033
- Table 27: Global Fruit & Vegetable Juice Market Revenue billion Forecast, by Type 2020 & 2033
- Table 28: Global Fruit & Vegetable Juice Market Volume K Litres Forecast, by Type 2020 & 2033
- Table 29: Global Fruit & Vegetable Juice Market Revenue billion Forecast, by Distribution Channel 2020 & 2033
- Table 30: Global Fruit & Vegetable Juice Market Volume K Litres Forecast, by Distribution Channel 2020 & 2033
- Table 31: Global Fruit & Vegetable Juice Market Revenue billion Forecast, by Country 2020 & 2033
- Table 32: Global Fruit & Vegetable Juice Market Volume K Litres Forecast, by Country 2020 & 2033
- Table 33: United Kingdom Fruit & Vegetable Juice Market Revenue (billion) Forecast, by Application 2020 & 2033
- Table 34: United Kingdom Fruit & Vegetable Juice Market Volume (K Litres) Forecast, by Application 2020 & 2033
- Table 35: Germany Fruit & Vegetable Juice Market Revenue (billion) Forecast, by Application 2020 & 2033
- Table 36: Germany Fruit & Vegetable Juice Market Volume (K Litres) Forecast, by Application 2020 & 2033
- Table 37: Spain Fruit & Vegetable Juice Market Revenue (billion) Forecast, by Application 2020 & 2033
- Table 38: Spain Fruit & Vegetable Juice Market Volume (K Litres) Forecast, by Application 2020 & 2033
- Table 39: France Fruit & Vegetable Juice Market Revenue (billion) Forecast, by Application 2020 & 2033
- Table 40: France Fruit & Vegetable Juice Market Volume (K Litres) Forecast, by Application 2020 & 2033
- Table 41: Italy Fruit & Vegetable Juice Market Revenue (billion) Forecast, by Application 2020 & 2033
- Table 42: Italy Fruit & Vegetable Juice Market Volume (K Litres) Forecast, by Application 2020 & 2033
- Table 43: Russia Fruit & Vegetable Juice Market Revenue (billion) Forecast, by Application 2020 & 2033
- Table 44: Russia Fruit & Vegetable Juice Market Volume (K Litres) Forecast, by Application 2020 & 2033
- Table 45: Rest of Europe Fruit & Vegetable Juice Market Revenue (billion) Forecast, by Application 2020 & 2033
- Table 46: Rest of Europe Fruit & Vegetable Juice Market Volume (K Litres) Forecast, by Application 2020 & 2033
- Table 47: Global Fruit & Vegetable Juice Market Revenue billion Forecast, by Category 2020 & 2033
- Table 48: Global Fruit & Vegetable Juice Market Volume K Litres Forecast, by Category 2020 & 2033
- Table 49: Global Fruit & Vegetable Juice Market Revenue billion Forecast, by Type 2020 & 2033
- Table 50: Global Fruit & Vegetable Juice Market Volume K Litres Forecast, by Type 2020 & 2033
- Table 51: Global Fruit & Vegetable Juice Market Revenue billion Forecast, by Distribution Channel 2020 & 2033
- Table 52: Global Fruit & Vegetable Juice Market Volume K Litres Forecast, by Distribution Channel 2020 & 2033
- Table 53: Global Fruit & Vegetable Juice Market Revenue billion Forecast, by Country 2020 & 2033
- Table 54: Global Fruit & Vegetable Juice Market Volume K Litres Forecast, by Country 2020 & 2033
- Table 55: China Fruit & Vegetable Juice Market Revenue (billion) Forecast, by Application 2020 & 2033
- Table 56: China Fruit & Vegetable Juice Market Volume (K Litres) Forecast, by Application 2020 & 2033
- Table 57: Japan Fruit & Vegetable Juice Market Revenue (billion) Forecast, by Application 2020 & 2033
- Table 58: Japan Fruit & Vegetable Juice Market Volume (K Litres) Forecast, by Application 2020 & 2033
- Table 59: India Fruit & Vegetable Juice Market Revenue (billion) Forecast, by Application 2020 & 2033
- Table 60: India Fruit & Vegetable Juice Market Volume (K Litres) Forecast, by Application 2020 & 2033
- Table 61: Australia Fruit & Vegetable Juice Market Revenue (billion) Forecast, by Application 2020 & 2033
- Table 62: Australia Fruit & Vegetable Juice Market Volume (K Litres) Forecast, by Application 2020 & 2033
- Table 63: Rest of Asia Pacific Fruit & Vegetable Juice Market Revenue (billion) Forecast, by Application 2020 & 2033
- Table 64: Rest of Asia Pacific Fruit & Vegetable Juice Market Volume (K Litres) Forecast, by Application 2020 & 2033
- Table 65: Global Fruit & Vegetable Juice Market Revenue billion Forecast, by Category 2020 & 2033
- Table 66: Global Fruit & Vegetable Juice Market Volume K Litres Forecast, by Category 2020 & 2033
- Table 67: Global Fruit & Vegetable Juice Market Revenue billion Forecast, by Type 2020 & 2033
- Table 68: Global Fruit & Vegetable Juice Market Volume K Litres Forecast, by Type 2020 & 2033
- Table 69: Global Fruit & Vegetable Juice Market Revenue billion Forecast, by Distribution Channel 2020 & 2033
- Table 70: Global Fruit & Vegetable Juice Market Volume K Litres Forecast, by Distribution Channel 2020 & 2033
- Table 71: Global Fruit & Vegetable Juice Market Revenue billion Forecast, by Country 2020 & 2033
- Table 72: Global Fruit & Vegetable Juice Market Volume K Litres Forecast, by Country 2020 & 2033
- Table 73: Brazil Fruit & Vegetable Juice Market Revenue (billion) Forecast, by Application 2020 & 2033
- Table 74: Brazil Fruit & Vegetable Juice Market Volume (K Litres) Forecast, by Application 2020 & 2033
- Table 75: Argentina Fruit & Vegetable Juice Market Revenue (billion) Forecast, by Application 2020 & 2033
- Table 76: Argentina Fruit & Vegetable Juice Market Volume (K Litres) Forecast, by Application 2020 & 2033
- Table 77: Rest of South America Fruit & Vegetable Juice Market Revenue (billion) Forecast, by Application 2020 & 2033
- Table 78: Rest of South America Fruit & Vegetable Juice Market Volume (K Litres) Forecast, by Application 2020 & 2033
- Table 79: Global Fruit & Vegetable Juice Market Revenue billion Forecast, by Category 2020 & 2033
- Table 80: Global Fruit & Vegetable Juice Market Volume K Litres Forecast, by Category 2020 & 2033
- Table 81: Global Fruit & Vegetable Juice Market Revenue billion Forecast, by Type 2020 & 2033
- Table 82: Global Fruit & Vegetable Juice Market Volume K Litres Forecast, by Type 2020 & 2033
- Table 83: Global Fruit & Vegetable Juice Market Revenue billion Forecast, by Distribution Channel 2020 & 2033
- Table 84: Global Fruit & Vegetable Juice Market Volume K Litres Forecast, by Distribution Channel 2020 & 2033
- Table 85: Global Fruit & Vegetable Juice Market Revenue billion Forecast, by Country 2020 & 2033
- Table 86: Global Fruit & Vegetable Juice Market Volume K Litres Forecast, by Country 2020 & 2033
- Table 87: Saudi Arabia Fruit & Vegetable Juice Market Revenue (billion) Forecast, by Application 2020 & 2033
- Table 88: Saudi Arabia Fruit & Vegetable Juice Market Volume (K Litres) Forecast, by Application 2020 & 2033
- Table 89: South Africa Fruit & Vegetable Juice Market Revenue (billion) Forecast, by Application 2020 & 2033
- Table 90: South Africa Fruit & Vegetable Juice Market Volume (K Litres) Forecast, by Application 2020 & 2033
- Table 91: Rest of Middle East and Africa Fruit & Vegetable Juice Market Revenue (billion) Forecast, by Application 2020 & 2033
- Table 92: Rest of Middle East and Africa Fruit & Vegetable Juice Market Volume (K Litres) Forecast, by Application 2020 & 2033
Frequently Asked Questions
1. What is the projected Compound Annual Growth Rate (CAGR) of the Fruit & Vegetable Juice Market?
The projected CAGR is approximately 5.6%.
2. Which companies are prominent players in the Fruit & Vegetable Juice Market?
Key companies in the market include Ocean Spray, PepsiCo Inc, Keurig Dr Pepper Inc, Eckes Granini Group, Fresh Del Monte, The Kraft Heinz Company, The Coca-Cola Company, Campbell Soup Company, Citrus World Inc, Welch's.
3. What are the main segments of the Fruit & Vegetable Juice Market?
The market segments include Category, Type, Distribution Channel.
4. Can you provide details about the market size?
The market size is estimated to be USD 111.07 billion as of 2022.
5. What are some drivers contributing to market growth?
Growing consumer awareness about health and wellness has increased the demand for nutritious beverages.
6. What are the notable trends driving market growth?
Rising demand for organic and natural juices free from additives and preservatives.
7. Are there any restraints impacting market growth?
Adverse Effects of Overconsumption of Products.
8. Can you provide examples of recent developments in the market?
In July 2022, Tipco, a Thailand-based juice company, launched a variety of vegetable juice and herb-infused drinks in the South East Asian and Middle-Eastern markets. The different flavors of herb-infused drinks include curcumin and finger root.
9. What pricing options are available for accessing the report?
Pricing options include single-user, multi-user, and enterprise licenses priced at USD 4750, USD 5250, and USD 8750 respectively.
10. Is the market size provided in terms of value or volume?
The market size is provided in terms of value, measured in billion and volume, measured in K Litres.
11. Are there any specific market keywords associated with the report?
Yes, the market keyword associated with the report is "Fruit & Vegetable Juice Market," which aids in identifying and referencing the specific market segment covered.
12. How do I determine which pricing option suits my needs best?
The pricing options vary based on user requirements and access needs. Individual users may opt for single-user licenses, while businesses requiring broader access may choose multi-user or enterprise licenses for cost-effective access to the report.
13. Are there any additional resources or data provided in the Fruit & Vegetable Juice Market report?
While the report offers comprehensive insights, it's advisable to review the specific contents or supplementary materials provided to ascertain if additional resources or data are available.
14. How can I stay updated on further developments or reports in the Fruit & Vegetable Juice Market?
To stay informed about further developments, trends, and reports in the Fruit & Vegetable Juice Market, consider subscribing to industry newsletters, following relevant companies and organizations, or regularly checking reputable industry news sources and publications.
Methodology
Step 1 - Identification of Relevant Samples Size from Population Database


Step 2 - Approaches for Defining Global Market Size (Value, Volume* & Price*)

Note*: In applicable scenarios
Step 3 - Data Sources
Primary Research
- Web Analytics
- Survey Reports
- Research Institute
- Latest Research Reports
- Opinion Leaders
Secondary Research
- Annual Reports
- White Paper
- Latest Press Release
- Industry Association
- Paid Database
- Investor Presentations

Step 4 - Data Triangulation
Involves using different sources of information in order to increase the validity of a study
These sources are likely to be stakeholders in a program - participants, other researchers, program staff, other community members, and so on.
Then we put all data in single framework & apply various statistical tools to find out the dynamic on the market.
During the analysis stage, feedback from the stakeholder groups would be compared to determine areas of agreement as well as areas of divergence