
Key Insights
The North American flexible office space market is experiencing robust growth, driven by a shift towards agile work models, increasing demand for cost-effective solutions, and the expansion of technology-driven businesses. The market, segmented by type (private offices, co-working spaces, virtual offices) and end-user (IT & Telecommunications, Media & Entertainment, Retail & Consumer Goods), shows a strong preference for co-working spaces, fueled by their collaborative environments and flexible lease terms. The IT and Telecommunications sector is a major driver, demonstrating significant adoption due to the industry's need for adaptable workspaces and reduced overhead costs. While the market faced some temporary headwinds during the initial phases of the COVID-19 pandemic, the subsequent rebound has been remarkably strong, exceeding pre-pandemic projections. This resurgence reflects the enduring need for flexible and adaptable work arrangements, even as remote work options remain relevant. Major players like WeWork, Regus, and Industrious are continually expanding their footprints, indicating sustained investor confidence and market potential. Competition is intense, with smaller, specialized providers vying for market share through unique offerings and localized strategies. Growth is expected to continue, albeit at a slightly moderated pace compared to the initial surge, reflecting market saturation in some major metropolitan areas. However, expansion into secondary and tertiary markets presents significant opportunities for both established and emerging players. The ongoing evolution of hybrid work models will remain a key factor shaping future market dynamics.
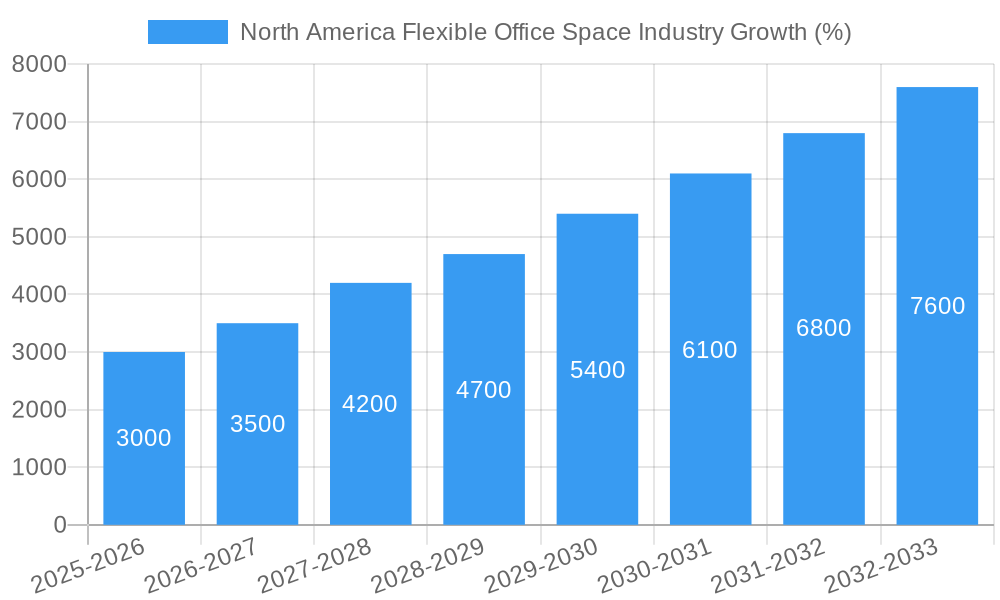
The forecast period (2025-2033) anticipates a continued, albeit potentially slightly decelerating, growth trajectory, reflecting market maturity. The sustained demand for flexible workspace solutions, coupled with the burgeoning adoption in less saturated markets, will propel the market. While potential economic downturns could pose a challenge, the inherent flexibility and adaptability of this market segment suggest inherent resilience. Furthermore, the continued investment in technological infrastructure within these spaces, enhancing productivity and collaboration, will reinforce the market's attractiveness to businesses of all sizes. The North American market, specifically the United States, is projected to remain the dominant force, fueled by its robust economy and concentration of technology-driven companies. Canada and Mexico are also expected to show considerable growth, albeit at a potentially slower pace.

North America Flexible Office Space Industry Report: 2019-2033
This comprehensive report provides a detailed analysis of the North America flexible office space market, covering the period from 2019 to 2033. It examines market dynamics, growth trends, dominant players, and future opportunities within this rapidly evolving sector. The report segments the market by type (private offices, co-working space, virtual offices) and end-user (IT and Telecommunications, Media and Entertainment, Retail and Consumer Goods), offering granular insights into each segment's performance and growth potential. This in-depth analysis is essential for industry professionals, investors, and strategic decision-makers seeking a clear understanding of this dynamic market.
North America Flexible Office Space Industry Market Dynamics & Structure
The North American flexible office space market is a dynamic landscape shaped by intense competition, rapid technological advancements, and evolving regulatory environments. Established industry giants and agile startups coexist, fostering both innovation and a fiercely competitive market. This section delves into the key factors influencing this dynamic sector.
- Market Concentration and Competition: While a few major players, such as WeWork and Regus, command significant market share, the market exhibits moderate concentration. Numerous smaller, regional providers contribute to a diverse and competitive landscape. Industry consolidation through mergers and acquisitions is expected to continue, potentially leading to a more concentrated market in the coming years. Projections for 2025 estimate the top 5 players holding approximately 40% of the market share.
- Technological Innovation and Disruption: Technological advancements are transforming the flexible workspace experience. Property management software, sophisticated booking platforms, and innovative workspace design solutions enhance efficiency and user experience. However, high initial investment costs present a barrier to entry for some innovative startups. The integration of smart building technologies and data-driven insights is further enhancing operational efficiency and creating opportunities for differentiation.
- Regulatory Landscape and its Impact: Zoning regulations and building codes vary significantly across North American cities, directly impacting the availability, cost, and feasibility of flexible office spaces. Changes in these regulations, along with potential tax incentives or restrictions, can influence market expansion and investment decisions. Navigating this complex regulatory environment is crucial for success in this sector.
- Competitive Landscape and Market Substitutes: Traditional office leasing remains a significant competitor, especially for large corporations with established needs. However, the increasing preference for flexible arrangements, driven by cost-effectiveness and adaptability, is fueling the migration towards flexible solutions. The rise of remote work further contributes to the appeal of flexible office spaces, providing a balance between remote work and collaborative in-office environments.
- End-User Demographics and Preferences: The primary end-users encompass small and medium-sized businesses (SMBs), startups, freelancers, and independent contractors. These users are attracted to the flexibility, cost-efficiency, and collaborative environments offered. Large corporations are increasingly incorporating flexible workspaces for specific teams or projects, recognizing the benefits of agility and adaptability.
- Mergers, Acquisitions, and Industry Consolidation: Recent years have witnessed a significant number of mergers and acquisitions (M&A) within the industry. Larger companies are actively consolidating their market position and expanding their geographical reach through strategic acquisitions. This trend is anticipated to continue, with projections indicating a substantial volume of M&A activity through 2025. This consolidation is reshaping the competitive landscape and influencing market dynamics.
North America Flexible Office Space Industry Growth Trends & Insights
The North America flexible office space market experienced substantial growth during the historical period (2019-2024), driven by the increasing adoption of remote work and flexible work arrangements. This trend accelerated during the pandemic and is expected to continue throughout the forecast period (2025-2033).
The market size reached xx million in 2024 and is projected to reach xx million by 2033, exhibiting a Compound Annual Growth Rate (CAGR) of xx% during the forecast period. This growth is fueled by several factors:
- Increased demand for flexible work arrangements among businesses of all sizes.
- Technological advancements making workspace management and booking easier.
- Growing preference for collaborative work environments.
- Expansion of co-working spaces into suburban and secondary markets.
- Increasing adoption of hybrid work models.
Dominant Regions, Countries, or Segments in North America Flexible Office Space Industry
Major metropolitan areas in the US and Canada, including New York, San Francisco, Los Angeles, Toronto, and Montreal, are the dominant regions within the North American flexible office space market. These areas attract substantial growth due to high business concentrations, a robust startup ecosystem, and a skilled talent pool. The co-working space segment currently leads in market revenue, followed by private offices, but the landscape is constantly evolving.
- Key Growth Drivers:
- Robust economic growth in major metropolitan areas fuels demand for flexible workspaces.
- Well-developed infrastructure effectively supports flexible workspace operations.
- Supportive government policies promoting entrepreneurship and innovation create a favorable environment.
- Increasing acceptance of hybrid work models further drives demand for flexible office solutions.
- Market Share and Dominance Factors: The US currently holds the largest market share in North America, projected to be xx% in 2025, followed by Canada with xx%. This dominance is attributable to a high concentration of businesses, strong demand from startups and freelancers, robust technology infrastructure, and a large pool of skilled workers.
- Future Growth Potential: Growth is anticipated to expand beyond major metropolitan areas into secondary markets and suburban areas. Businesses are increasingly seeking more affordable options, and employees are looking for workspaces closer to their homes. The virtual office segment is also poised for substantial growth, driven by the continued adoption of remote work practices. This expansion will broaden market access and create new opportunities for providers.
North America Flexible Office Space Industry Product Landscape
The flexible office space market offers a diverse range of products, including private offices, co-working spaces, and virtual offices. Innovations include flexible lease terms, customizable workspace configurations, and integrated technology solutions enhancing productivity and collaboration. These solutions cater to varied business needs and budgets, ensuring market accessibility and competition. Unique selling propositions often center around location, amenities, and community building. Technological advancements focus on streamlining operations, enhancing user experience through mobile apps, and implementing smart building technologies for energy efficiency and security.
Key Drivers, Barriers & Challenges in North America Flexible Office Space Industry
The North American flexible office space industry is characterized by both significant growth drivers and notable challenges.
Key Drivers:
- The widespread adoption of remote and hybrid work models significantly fuels demand for flexible workspace solutions.
- Technological advancements in workspace management and booking platforms streamline operations and improve user experiences.
- The increasing preference for collaborative work environments among startups and SMEs drives demand for shared workspaces.
- The desire for greater work-life balance and flexible working arrangements amongst employees continues to fuel growth in the sector.
Key Challenges:
- High real estate costs in major metropolitan areas pose a significant challenge to profitability, especially for smaller operators. This necessitates innovative pricing strategies and efficient space utilization.
- Intense competition from both established players and new entrants exerts pressure on pricing and profitability margins. Differentiation through unique offerings and superior service is crucial.
- Economic downturns can significantly impact demand, leading to decreased occupancy rates and financial strain. The impact of unforeseen events, like the 2020 pandemic, highlights the importance of robust financial planning and operational flexibility.
- Attracting and retaining talent in a competitive market is a constant challenge for operators. Offering attractive amenities and a positive work environment is crucial.
Emerging Opportunities in North America Flexible Office Space Industry
Emerging opportunities lie in expanding into secondary and suburban markets, targeting underserved demographics, and offering specialized workspaces catering to specific industries. The integration of technology, such as smart building management systems and virtual reality tools for virtual office experiences, represents significant growth opportunities. Furthermore, focusing on sustainable and environmentally friendly practices could attract environmentally conscious businesses.
Growth Accelerators in the North America Flexible Office Space Industry Industry
Technological breakthroughs in workspace management and design, strategic partnerships to expand service offerings, and aggressive marketing campaigns targeting niche markets represent significant catalysts for long-term growth. Expansion into underserved geographical areas and the development of innovative, customized solutions for specific business needs also represent key growth areas.
Key Players Shaping the North America Flexible Office Space Industry Market
- Green Desk
- Servcorp
- Venture X
- Proximity Space
- Serendipity Labs
- Knotel Inc
- Office Freedom
- WeWork Inc
- Industrious Office
- Regus Corporation
Notable Milestones in North America Flexible Office Space Industry Sector
- 2020 (March): The COVID-19 pandemic initially disrupted the industry, causing reduced occupancy rates and a temporary shift towards remote work. This period also spurred innovation in safety protocols and remote work technologies.
- 2021 (Q3): A notable recovery was observed in major metropolitan areas as businesses reevaluated their office needs and embraced flexible options to support hybrid work models.
- 2022 (Q4): The year witnessed a wave of mergers and acquisitions, signifying industry consolidation and the expansion of major players' market reach.
- 2023 (Ongoing): Sustainability and technological integration are increasingly prominent focuses within flexible workspaces. Operators are prioritizing eco-friendly practices and incorporating advanced technologies to enhance efficiency and user experience.
- Future Trends: The industry is expected to see continued focus on personalization, wellness initiatives, and community building within flexible workspace environments. These factors contribute to employee satisfaction and retention, crucial aspects for attracting tenants.
In-Depth North America Flexible Office Space Industry Market Outlook
The future of the North American flexible office space market remains positive, driven by the enduring demand for adaptable and flexible work arrangements. Continued growth is projected, fueled by technological innovation, the expansion of co-working spaces into secondary and suburban markets, and the growing prevalence of hybrid work models. Success in this dynamic and competitive sector will depend on strategic partnerships, a focus on niche markets, and the adoption of sustainable business practices. Companies that effectively adapt to evolving consumer preferences, technological advancements, and economic fluctuations will be best positioned to capitalize on future growth opportunities.
Further success will depend on the ability of operators to understand and adapt to evolving workplace trends, including a continued emphasis on employee well-being, community building, and technological integration. Data-driven decision making, flexible lease terms, and a focus on creating collaborative workspaces that reflect the changing needs of the modern workforce are vital for future success.
North America Flexible Office Space Industry Segmentation
-
1. Type
- 1.1. Private offices
- 1.2. Co-working space
- 1.3. Virtual offices
-
2. End User
- 2.1. IT and Telecommunications
- 2.2. Media and Entertainment
- 2.3. Retail and consumer goods
-
3. Geography
- 3.1. United States
- 3.2. Canada
- 3.3. Mexico
- 3.4. Rest of North America
North America Flexible Office Space Industry Segmentation By Geography
- 1. United States
- 2. Canada
- 3. Mexico
- 4. Rest of North America

North America Flexible Office Space Industry REPORT HIGHLIGHTS
| Aspects | Details |
|---|---|
| Study Period | 2019-2033 |
| Base Year | 2024 |
| Estimated Year | 2025 |
| Forecast Period | 2025-2033 |
| Historical Period | 2019-2024 |
| Growth Rate | CAGR of 12.00% from 2019-2033 |
| Segmentation |
|
Table of Contents
- 1. Introduction
- 1.1. Research Scope
- 1.2. Market Segmentation
- 1.3. Research Methodology
- 1.4. Definitions and Assumptions
- 2. Executive Summary
- 2.1. Introduction
- 3. Market Dynamics
- 3.1. Introduction
- 3.2. Market Drivers
- 3.2.1. The Rise in e-commerce and digitalization
- 3.3. Market Restrains
- 3.3.1. The Complexity of regulations and property ownership
- 3.4. Market Trends
- 3.4.1. Increase in Office Space Vacancy Rate
- 4. Market Factor Analysis
- 4.1. Porters Five Forces
- 4.2. Supply/Value Chain
- 4.3. PESTEL analysis
- 4.4. Market Entropy
- 4.5. Patent/Trademark Analysis
- 5. North America Flexible Office Space Industry Analysis, Insights and Forecast, 2019-2031
- 5.1. Market Analysis, Insights and Forecast - by Type
- 5.1.1. Private offices
- 5.1.2. Co-working space
- 5.1.3. Virtual offices
- 5.2. Market Analysis, Insights and Forecast - by End User
- 5.2.1. IT and Telecommunications
- 5.2.2. Media and Entertainment
- 5.2.3. Retail and consumer goods
- 5.3. Market Analysis, Insights and Forecast - by Geography
- 5.3.1. United States
- 5.3.2. Canada
- 5.3.3. Mexico
- 5.3.4. Rest of North America
- 5.4. Market Analysis, Insights and Forecast - by Region
- 5.4.1. United States
- 5.4.2. Canada
- 5.4.3. Mexico
- 5.4.4. Rest of North America
- 5.1. Market Analysis, Insights and Forecast - by Type
- 6. United States North America Flexible Office Space Industry Analysis, Insights and Forecast, 2019-2031
- 6.1. Market Analysis, Insights and Forecast - by Type
- 6.1.1. Private offices
- 6.1.2. Co-working space
- 6.1.3. Virtual offices
- 6.2. Market Analysis, Insights and Forecast - by End User
- 6.2.1. IT and Telecommunications
- 6.2.2. Media and Entertainment
- 6.2.3. Retail and consumer goods
- 6.3. Market Analysis, Insights and Forecast - by Geography
- 6.3.1. United States
- 6.3.2. Canada
- 6.3.3. Mexico
- 6.3.4. Rest of North America
- 6.1. Market Analysis, Insights and Forecast - by Type
- 7. Canada North America Flexible Office Space Industry Analysis, Insights and Forecast, 2019-2031
- 7.1. Market Analysis, Insights and Forecast - by Type
- 7.1.1. Private offices
- 7.1.2. Co-working space
- 7.1.3. Virtual offices
- 7.2. Market Analysis, Insights and Forecast - by End User
- 7.2.1. IT and Telecommunications
- 7.2.2. Media and Entertainment
- 7.2.3. Retail and consumer goods
- 7.3. Market Analysis, Insights and Forecast - by Geography
- 7.3.1. United States
- 7.3.2. Canada
- 7.3.3. Mexico
- 7.3.4. Rest of North America
- 7.1. Market Analysis, Insights and Forecast - by Type
- 8. Mexico North America Flexible Office Space Industry Analysis, Insights and Forecast, 2019-2031
- 8.1. Market Analysis, Insights and Forecast - by Type
- 8.1.1. Private offices
- 8.1.2. Co-working space
- 8.1.3. Virtual offices
- 8.2. Market Analysis, Insights and Forecast - by End User
- 8.2.1. IT and Telecommunications
- 8.2.2. Media and Entertainment
- 8.2.3. Retail and consumer goods
- 8.3. Market Analysis, Insights and Forecast - by Geography
- 8.3.1. United States
- 8.3.2. Canada
- 8.3.3. Mexico
- 8.3.4. Rest of North America
- 8.1. Market Analysis, Insights and Forecast - by Type
- 9. Rest of North America North America Flexible Office Space Industry Analysis, Insights and Forecast, 2019-2031
- 9.1. Market Analysis, Insights and Forecast - by Type
- 9.1.1. Private offices
- 9.1.2. Co-working space
- 9.1.3. Virtual offices
- 9.2. Market Analysis, Insights and Forecast - by End User
- 9.2.1. IT and Telecommunications
- 9.2.2. Media and Entertainment
- 9.2.3. Retail and consumer goods
- 9.3. Market Analysis, Insights and Forecast - by Geography
- 9.3.1. United States
- 9.3.2. Canada
- 9.3.3. Mexico
- 9.3.4. Rest of North America
- 9.1. Market Analysis, Insights and Forecast - by Type
- 10. United States North America Flexible Office Space Industry Analysis, Insights and Forecast, 2019-2031
- 11. Canada North America Flexible Office Space Industry Analysis, Insights and Forecast, 2019-2031
- 12. Mexico North America Flexible Office Space Industry Analysis, Insights and Forecast, 2019-2031
- 13. Rest of North America North America Flexible Office Space Industry Analysis, Insights and Forecast, 2019-2031
- 14. Competitive Analysis
- 14.1. Market Share Analysis 2024
- 14.2. Company Profiles
- 14.2.1 Green Desk
- 14.2.1.1. Overview
- 14.2.1.2. Products
- 14.2.1.3. SWOT Analysis
- 14.2.1.4. Recent Developments
- 14.2.1.5. Financials (Based on Availability)
- 14.2.2 Servcorp
- 14.2.2.1. Overview
- 14.2.2.2. Products
- 14.2.2.3. SWOT Analysis
- 14.2.2.4. Recent Developments
- 14.2.2.5. Financials (Based on Availability)
- 14.2.3 Venture X
- 14.2.3.1. Overview
- 14.2.3.2. Products
- 14.2.3.3. SWOT Analysis
- 14.2.3.4. Recent Developments
- 14.2.3.5. Financials (Based on Availability)
- 14.2.4 Proximity Space
- 14.2.4.1. Overview
- 14.2.4.2. Products
- 14.2.4.3. SWOT Analysis
- 14.2.4.4. Recent Developments
- 14.2.4.5. Financials (Based on Availability)
- 14.2.5 Serendipity Labs
- 14.2.5.1. Overview
- 14.2.5.2. Products
- 14.2.5.3. SWOT Analysis
- 14.2.5.4. Recent Developments
- 14.2.5.5. Financials (Based on Availability)
- 14.2.6 Knotel Inc
- 14.2.6.1. Overview
- 14.2.6.2. Products
- 14.2.6.3. SWOT Analysis
- 14.2.6.4. Recent Developments
- 14.2.6.5. Financials (Based on Availability)
- 14.2.7 Office Freedom**List Not Exhaustive
- 14.2.7.1. Overview
- 14.2.7.2. Products
- 14.2.7.3. SWOT Analysis
- 14.2.7.4. Recent Developments
- 14.2.7.5. Financials (Based on Availability)
- 14.2.8 Wework Inc
- 14.2.8.1. Overview
- 14.2.8.2. Products
- 14.2.8.3. SWOT Analysis
- 14.2.8.4. Recent Developments
- 14.2.8.5. Financials (Based on Availability)
- 14.2.9 Industrious Office
- 14.2.9.1. Overview
- 14.2.9.2. Products
- 14.2.9.3. SWOT Analysis
- 14.2.9.4. Recent Developments
- 14.2.9.5. Financials (Based on Availability)
- 14.2.10 Regus Corporation
- 14.2.10.1. Overview
- 14.2.10.2. Products
- 14.2.10.3. SWOT Analysis
- 14.2.10.4. Recent Developments
- 14.2.10.5. Financials (Based on Availability)
- 14.2.1 Green Desk
List of Figures
- Figure 1: North America Flexible Office Space Industry Revenue Breakdown (Million, %) by Product 2024 & 2032
- Figure 2: North America Flexible Office Space Industry Share (%) by Company 2024
List of Tables
- Table 1: North America Flexible Office Space Industry Revenue Million Forecast, by Region 2019 & 2032
- Table 2: North America Flexible Office Space Industry Revenue Million Forecast, by Type 2019 & 2032
- Table 3: North America Flexible Office Space Industry Revenue Million Forecast, by End User 2019 & 2032
- Table 4: North America Flexible Office Space Industry Revenue Million Forecast, by Geography 2019 & 2032
- Table 5: North America Flexible Office Space Industry Revenue Million Forecast, by Region 2019 & 2032
- Table 6: North America Flexible Office Space Industry Revenue Million Forecast, by Country 2019 & 2032
- Table 7: United States North America Flexible Office Space Industry Revenue (Million) Forecast, by Application 2019 & 2032
- Table 8: Canada North America Flexible Office Space Industry Revenue (Million) Forecast, by Application 2019 & 2032
- Table 9: Mexico North America Flexible Office Space Industry Revenue (Million) Forecast, by Application 2019 & 2032
- Table 10: Rest of North America North America Flexible Office Space Industry Revenue (Million) Forecast, by Application 2019 & 2032
- Table 11: North America Flexible Office Space Industry Revenue Million Forecast, by Type 2019 & 2032
- Table 12: North America Flexible Office Space Industry Revenue Million Forecast, by End User 2019 & 2032
- Table 13: North America Flexible Office Space Industry Revenue Million Forecast, by Geography 2019 & 2032
- Table 14: North America Flexible Office Space Industry Revenue Million Forecast, by Country 2019 & 2032
- Table 15: North America Flexible Office Space Industry Revenue Million Forecast, by Type 2019 & 2032
- Table 16: North America Flexible Office Space Industry Revenue Million Forecast, by End User 2019 & 2032
- Table 17: North America Flexible Office Space Industry Revenue Million Forecast, by Geography 2019 & 2032
- Table 18: North America Flexible Office Space Industry Revenue Million Forecast, by Country 2019 & 2032
- Table 19: North America Flexible Office Space Industry Revenue Million Forecast, by Type 2019 & 2032
- Table 20: North America Flexible Office Space Industry Revenue Million Forecast, by End User 2019 & 2032
- Table 21: North America Flexible Office Space Industry Revenue Million Forecast, by Geography 2019 & 2032
- Table 22: North America Flexible Office Space Industry Revenue Million Forecast, by Country 2019 & 2032
- Table 23: North America Flexible Office Space Industry Revenue Million Forecast, by Type 2019 & 2032
- Table 24: North America Flexible Office Space Industry Revenue Million Forecast, by End User 2019 & 2032
- Table 25: North America Flexible Office Space Industry Revenue Million Forecast, by Geography 2019 & 2032
- Table 26: North America Flexible Office Space Industry Revenue Million Forecast, by Country 2019 & 2032
Frequently Asked Questions
1. What is the projected Compound Annual Growth Rate (CAGR) of the North America Flexible Office Space Industry?
The projected CAGR is approximately 12.00%.
2. Which companies are prominent players in the North America Flexible Office Space Industry?
Key companies in the market include Green Desk, Servcorp, Venture X, Proximity Space, Serendipity Labs, Knotel Inc, Office Freedom**List Not Exhaustive, Wework Inc, Industrious Office, Regus Corporation.
3. What are the main segments of the North America Flexible Office Space Industry?
The market segments include Type, End User, Geography.
4. Can you provide details about the market size?
The market size is estimated to be USD XX Million as of 2022.
5. What are some drivers contributing to market growth?
The Rise in e-commerce and digitalization.
6. What are the notable trends driving market growth?
Increase in Office Space Vacancy Rate.
7. Are there any restraints impacting market growth?
The Complexity of regulations and property ownership.
8. Can you provide examples of recent developments in the market?
N/A
9. What pricing options are available for accessing the report?
Pricing options include single-user, multi-user, and enterprise licenses priced at USD 4750, USD 5250, and USD 8750 respectively.
10. Is the market size provided in terms of value or volume?
The market size is provided in terms of value, measured in Million.
11. Are there any specific market keywords associated with the report?
Yes, the market keyword associated with the report is "North America Flexible Office Space Industry," which aids in identifying and referencing the specific market segment covered.
12. How do I determine which pricing option suits my needs best?
The pricing options vary based on user requirements and access needs. Individual users may opt for single-user licenses, while businesses requiring broader access may choose multi-user or enterprise licenses for cost-effective access to the report.
13. Are there any additional resources or data provided in the North America Flexible Office Space Industry report?
While the report offers comprehensive insights, it's advisable to review the specific contents or supplementary materials provided to ascertain if additional resources or data are available.
14. How can I stay updated on further developments or reports in the North America Flexible Office Space Industry?
To stay informed about further developments, trends, and reports in the North America Flexible Office Space Industry, consider subscribing to industry newsletters, following relevant companies and organizations, or regularly checking reputable industry news sources and publications.
Methodology
Step 1 - Identification of Relevant Samples Size from Population Database


Step 2 - Approaches for Defining Global Market Size (Value, Volume* & Price*)

Note*: In applicable scenarios
Step 3 - Data Sources
Primary Research
- Web Analytics
- Survey Reports
- Research Institute
- Latest Research Reports
- Opinion Leaders
Secondary Research
- Annual Reports
- White Paper
- Latest Press Release
- Industry Association
- Paid Database
- Investor Presentations

Step 4 - Data Triangulation
Involves using different sources of information in order to increase the validity of a study
These sources are likely to be stakeholders in a program - participants, other researchers, program staff, other community members, and so on.
Then we put all data in single framework & apply various statistical tools to find out the dynamic on the market.
During the analysis stage, feedback from the stakeholder groups would be compared to determine areas of agreement as well as areas of divergence


