
Key Insights
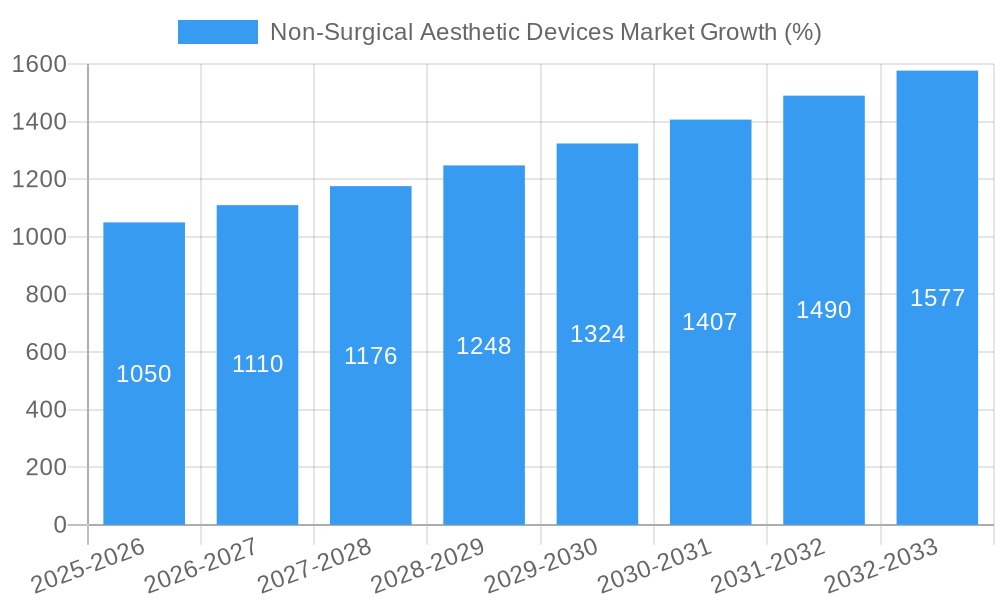
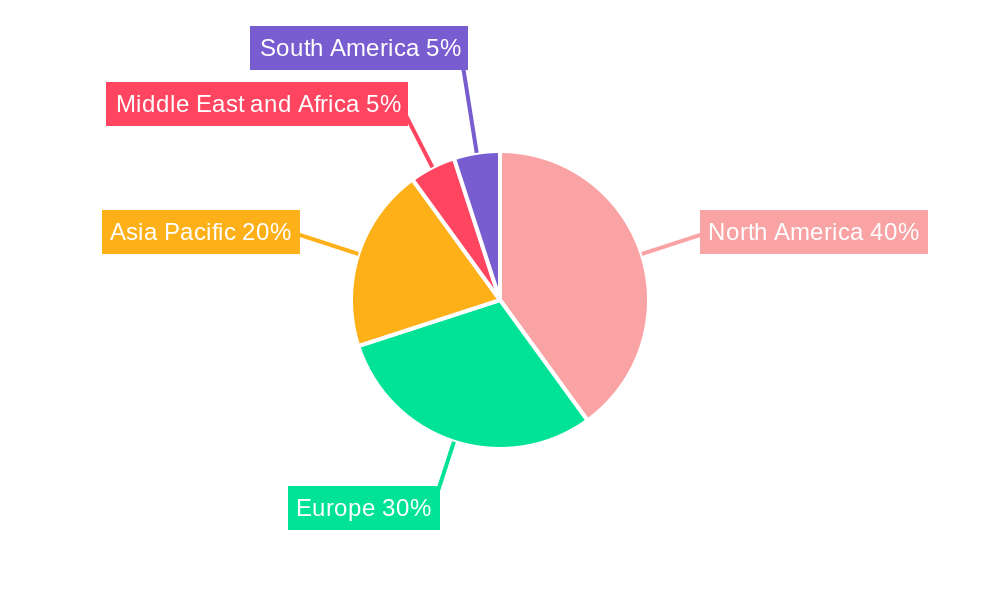
The Non-Surgical Aesthetic Devices market is experiencing robust growth, driven by the increasing demand for minimally invasive cosmetic procedures and the rising disposable incomes globally. The market, estimated at $XX million in 2025, is projected to expand at a CAGR of 7.10% from 2025 to 2033. This growth is fueled by several key factors. Firstly, the rising prevalence of age-related skin issues and a growing desire for enhanced appearance among both men and women are significantly boosting demand. Secondly, technological advancements leading to safer, more effective, and less painful procedures are making these treatments more accessible and appealing. The diverse range of applications, including skin resurfacing, body contouring, hair removal, and tattoo removal, further contributes to the market's expansion. Finally, the increasing number of well-equipped beauty clinics and hospitals offering these procedures is enhancing market accessibility. Regional variations exist, with North America and Europe currently holding significant market shares, driven by higher adoption rates and technological advancements. However, the Asia-Pacific region is expected to witness substantial growth in the coming years, propelled by increasing awareness and rising disposable incomes.
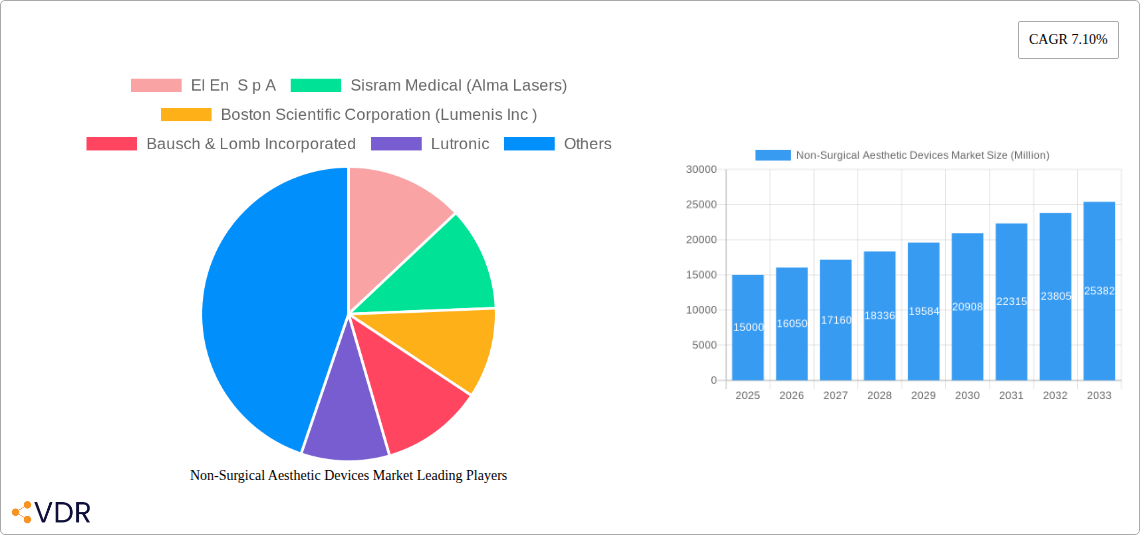
Several market segments are contributing to this growth trajectory. Laser-based devices continue to dominate, owing to their versatility and effectiveness across various applications. However, the radiofrequency (RF) based and ultrasound devices are gaining traction due to their non-invasive nature and relatively lower cost. The skin resurfacing and tightening application segment currently leads in terms of revenue, reflecting the widespread concern about aging skin. However, other segments, such as body contouring and cellulite reduction, are rapidly gaining momentum. Competitive dynamics are intense, with established players like El En Sp A, Sisram Medical (Alma Lasers), and Boston Scientific Corporation (Lumenis Inc) competing alongside newer entrants. While the market enjoys favorable growth drivers, potential restraints include regulatory hurdles related to device approvals and the risk of adverse effects associated with some procedures. Navigating these challenges and addressing patient safety concerns will be crucial for sustained market growth.
Non-Surgical Aesthetic Devices Market Report: 2019-2033
This comprehensive report provides a detailed analysis of the Non-Surgical Aesthetic Devices market, encompassing its dynamics, growth trends, key players, and future outlook. The study period covers 2019-2033, with a base year of 2025 and a forecast period of 2025-2033. This in-depth analysis will be invaluable for industry professionals, investors, and researchers seeking to understand this rapidly evolving market. The market is segmented by application (Skin Resurfacing and Tightening, Body Contouring and Cellulite Reduction, Hair Removal, Tattoo Removal, Other Applications), end-user (Hospital, Beauty Clinics, Other End-Users), and type (Laser-based Aesthetic Device, Radiofrequency (RF) Based Aesthetic Device, Ultrasound Aesthetic Device, Intense Pulsed Light Device, Other Types).
Non-Surgical Aesthetic Devices Market Dynamics & Structure
The non-surgical aesthetic devices market is characterized by moderate concentration, with key players holding significant market share. Technological innovation, particularly in laser and energy-based devices, is a primary growth driver. Stringent regulatory frameworks, varying across geographies, influence market access and adoption. Competitive pressures arise from substitute treatments and the emergence of new technologies. End-user demographics, including an aging population and increasing disposable incomes, fuel market expansion. M&A activity, while not excessively frequent, plays a role in shaping the competitive landscape.
- Market Concentration: Moderately concentrated, with top 10 players holding approximately xx% market share in 2025.
- Technological Innovation: Significant advancements in laser technology, radiofrequency, and ultrasound are driving improved efficacy and safety.
- Regulatory Landscape: Varying regulatory approvals and guidelines across countries impact market penetration.
- Competitive Substitutes: Alternatives such as injectables and surgical procedures exert competitive pressure.
- End-User Demographics: Growing aging population and increasing disposable income in developed and emerging economies are key drivers.
- M&A Activity: A moderate number of M&A deals (xx in the last 5 years) indicate consolidation and expansion strategies among key players.
Non-Surgical Aesthetic Devices Market Growth Trends & Insights
The non-surgical aesthetic devices market experienced robust growth during the historical period (2019-2024), driven by increasing demand for minimally invasive cosmetic procedures. The market size reached approximately xx million units in 2024 and is projected to expand at a CAGR of xx% during the forecast period (2025-2033), reaching xx million units by 2033. This growth is fueled by technological advancements leading to improved treatment outcomes, increased patient acceptance, and expanding distribution channels. Consumer preference shifts towards non-invasive procedures and rising awareness regarding aesthetic treatments also contribute to market expansion. Market penetration is highest in developed regions, but significant growth potential exists in emerging markets. Technological disruptions, such as the introduction of AI-powered devices and personalized treatment options, will further shape market dynamics.
Dominant Regions, Countries, or Segments in Non-Surgical Aesthetic Devices Market
North America currently dominates the non-surgical aesthetic devices market, driven by high adoption rates, advanced healthcare infrastructure, and a strong regulatory framework. Within this region, the United States holds the largest market share. The European market is also significant, exhibiting strong growth due to rising disposable incomes and increasing demand for aesthetic treatments. Asia-Pacific is a rapidly expanding region with considerable growth potential, driven by a young and growing population and increasing awareness of aesthetic procedures.
Dominant Segments:
- Application: Skin resurfacing and tightening hold the largest market share, followed by hair removal.
- End-User: Beauty clinics constitute the largest end-user segment.
- Type: Laser-based aesthetic devices maintain a significant market share, attributed to their versatility and efficacy.
Key Drivers by Region:
- North America: High disposable incomes, advanced healthcare infrastructure, and high adoption rates.
- Europe: Rising awareness of aesthetic treatments and increasing acceptance of minimally invasive procedures.
- Asia-Pacific: Growing population, rising disposable incomes, and increasing awareness of aesthetic treatments.
Non-Surgical Aesthetic Devices Market Product Landscape
The non-surgical aesthetic devices market offers a diverse range of products, including laser-based devices for skin resurfacing, radiofrequency devices for skin tightening, and ultrasound devices for body contouring. Recent innovations focus on enhancing treatment efficacy, improving patient comfort, and minimizing downtime. Unique selling propositions often highlight features like faster treatment times, improved results, and personalized treatment options. Technological advancements such as AI integration and advanced energy delivery systems are constantly improving device performance and expanding their applications.
Key Drivers, Barriers & Challenges in Non-Surgical Aesthetic Devices Market
Key Drivers:
- Technological advancements leading to improved efficacy and safety of treatments.
- Increasing demand for minimally invasive cosmetic procedures.
- Rising disposable incomes and increased awareness among consumers.
Key Challenges:
- High initial investment costs for advanced devices.
- Stringent regulatory approvals and potential for delays in market entry.
- Intense competition among existing and emerging players.
Emerging Opportunities in Non-Surgical Aesthetic Devices Market
- Expanding into untapped markets in developing countries.
- Development of innovative applications, such as combination therapies.
- Customization of treatments based on individual patient needs and preferences.
Growth Accelerators in the Non-Surgical Aesthetic Devices Market Industry
Technological breakthroughs, particularly in areas like AI-powered image analysis and personalized treatment algorithms, are poised to significantly accelerate market growth. Strategic partnerships and collaborations between device manufacturers and healthcare providers will expand market reach and improve treatment accessibility. Expanding into new geographical markets, particularly in emerging economies with growing populations and disposable incomes, represents a major growth opportunity.
Key Players Shaping the Non-Surgical Aesthetic Devices Market Market
- El En S p A
- Sisram Medical (Alma Lasers)
- Boston Scientific Corporation (Lumenis Inc)
- Bausch & Lomb Incorporated
- Lutronic
- Fotona
- Cutera Inc
- STRATA Skin Sciences
- Lynton Lasers Ltd
- Sciton Inc
Notable Milestones in Non-Surgical Aesthetic Devices Market Sector
- June 2022: Cynosure launched the FDA-approved PicoSure Pro device, a 755nm picosecond laser for skin rejuvenation.
- October 2022: Sensus Healthcare launched the Silk Laser Hair Removal System, a portable hair removal laser system.
In-Depth Non-Surgical Aesthetic Devices Market Market Outlook
The non-surgical aesthetic devices market is poised for continued robust growth driven by technological innovation, increasing consumer demand, and expansion into new markets. Strategic opportunities exist for companies focused on developing innovative devices, establishing strong distribution networks, and providing personalized treatment options. The market's future success will hinge on the ability of companies to adapt to evolving consumer preferences, navigate regulatory landscapes, and compete effectively in a dynamic market environment.
Non-Surgical Aesthetic Devices Market Segmentation
-
1. Type
- 1.1. Laser-based Aesthetic Device
- 1.2. Radiofrequency (RF) Based Aesthetic Device
- 1.3. Ultrasound Aesthetic Device
- 1.4. Intense Pulsed Light Device
- 1.5. Other Types
-
2. Application
- 2.1. Skin Resurfacing and Tightening
- 2.2. Body Contouring and Cellulite Reduction
- 2.3. Hair Removal
- 2.4. Tattoo Removal
- 2.5. Other Applications
-
3. End-User
- 3.1. Hospital
- 3.2. Beauty Clinics
- 3.3. Other End-Users
Non-Surgical Aesthetic Devices Market Segmentation By Geography
-
1. North America
- 1.1. United States
- 1.2. Canada
- 1.3. Mexico
-
2. Europe
- 2.1. Germany
- 2.2. United Kingdom
- 2.3. France
- 2.4. Italy
- 2.5. Spain
- 2.6. Rest of Europe
-
3. Asia Pacific
- 3.1. China
- 3.2. Japan
- 3.3. India
- 3.4. Australia
- 3.5. South Korea
- 3.6. Rest of Asia Pacific
-
4. Middle East and Africa
- 4.1. GCC
- 4.2. South Africa
- 4.3. Rest of Middle East and Africa
-
5. South America
- 5.1. Brazil
- 5.2. Argentina
- 5.3. Rest of South America
Non-Surgical Aesthetic Devices Market REPORT HIGHLIGHTS
| Aspects | Details |
|---|---|
| Study Period | 2019-2033 |
| Base Year | 2024 |
| Estimated Year | 2025 |
| Forecast Period | 2025-2033 |
| Historical Period | 2019-2024 |
| Growth Rate | CAGR of 7.10% from 2019-2033 |
| Segmentation |
|
Table of Contents
- 1. Introduction
- 1.1. Research Scope
- 1.2. Market Segmentation
- 1.3. Research Methodology
- 1.4. Definitions and Assumptions
- 2. Executive Summary
- 2.1. Introduction
- 3. Market Dynamics
- 3.1. Introduction
- 3.2. Market Drivers
- 3.2.1. Increasing Demand for Non-surgical Aesthetics Procedures; Technological Advancements in Non-surgical Aesthetic Devices
- 3.3. Market Restrains
- 3.3.1. High Cost of the Devices
- 3.4. Market Trends
- 3.4.1. Skin Resurfacing and Tightening is Expected to Hold the Significant Market Share Over the Forecast period.
- 4. Market Factor Analysis
- 4.1. Porters Five Forces
- 4.2. Supply/Value Chain
- 4.3. PESTEL analysis
- 4.4. Market Entropy
- 4.5. Patent/Trademark Analysis
- 5. Global Non-Surgical Aesthetic Devices Market Analysis, Insights and Forecast, 2019-2031
- 5.1. Market Analysis, Insights and Forecast - by Type
- 5.1.1. Laser-based Aesthetic Device
- 5.1.2. Radiofrequency (RF) Based Aesthetic Device
- 5.1.3. Ultrasound Aesthetic Device
- 5.1.4. Intense Pulsed Light Device
- 5.1.5. Other Types
- 5.2. Market Analysis, Insights and Forecast - by Application
- 5.2.1. Skin Resurfacing and Tightening
- 5.2.2. Body Contouring and Cellulite Reduction
- 5.2.3. Hair Removal
- 5.2.4. Tattoo Removal
- 5.2.5. Other Applications
- 5.3. Market Analysis, Insights and Forecast - by End-User
- 5.3.1. Hospital
- 5.3.2. Beauty Clinics
- 5.3.3. Other End-Users
- 5.4. Market Analysis, Insights and Forecast - by Region
- 5.4.1. North America
- 5.4.2. Europe
- 5.4.3. Asia Pacific
- 5.4.4. Middle East and Africa
- 5.4.5. South America
- 5.1. Market Analysis, Insights and Forecast - by Type
- 6. North America Non-Surgical Aesthetic Devices Market Analysis, Insights and Forecast, 2019-2031
- 6.1. Market Analysis, Insights and Forecast - by Type
- 6.1.1. Laser-based Aesthetic Device
- 6.1.2. Radiofrequency (RF) Based Aesthetic Device
- 6.1.3. Ultrasound Aesthetic Device
- 6.1.4. Intense Pulsed Light Device
- 6.1.5. Other Types
- 6.2. Market Analysis, Insights and Forecast - by Application
- 6.2.1. Skin Resurfacing and Tightening
- 6.2.2. Body Contouring and Cellulite Reduction
- 6.2.3. Hair Removal
- 6.2.4. Tattoo Removal
- 6.2.5. Other Applications
- 6.3. Market Analysis, Insights and Forecast - by End-User
- 6.3.1. Hospital
- 6.3.2. Beauty Clinics
- 6.3.3. Other End-Users
- 6.1. Market Analysis, Insights and Forecast - by Type
- 7. Europe Non-Surgical Aesthetic Devices Market Analysis, Insights and Forecast, 2019-2031
- 7.1. Market Analysis, Insights and Forecast - by Type
- 7.1.1. Laser-based Aesthetic Device
- 7.1.2. Radiofrequency (RF) Based Aesthetic Device
- 7.1.3. Ultrasound Aesthetic Device
- 7.1.4. Intense Pulsed Light Device
- 7.1.5. Other Types
- 7.2. Market Analysis, Insights and Forecast - by Application
- 7.2.1. Skin Resurfacing and Tightening
- 7.2.2. Body Contouring and Cellulite Reduction
- 7.2.3. Hair Removal
- 7.2.4. Tattoo Removal
- 7.2.5. Other Applications
- 7.3. Market Analysis, Insights and Forecast - by End-User
- 7.3.1. Hospital
- 7.3.2. Beauty Clinics
- 7.3.3. Other End-Users
- 7.1. Market Analysis, Insights and Forecast - by Type
- 8. Asia Pacific Non-Surgical Aesthetic Devices Market Analysis, Insights and Forecast, 2019-2031
- 8.1. Market Analysis, Insights and Forecast - by Type
- 8.1.1. Laser-based Aesthetic Device
- 8.1.2. Radiofrequency (RF) Based Aesthetic Device
- 8.1.3. Ultrasound Aesthetic Device
- 8.1.4. Intense Pulsed Light Device
- 8.1.5. Other Types
- 8.2. Market Analysis, Insights and Forecast - by Application
- 8.2.1. Skin Resurfacing and Tightening
- 8.2.2. Body Contouring and Cellulite Reduction
- 8.2.3. Hair Removal
- 8.2.4. Tattoo Removal
- 8.2.5. Other Applications
- 8.3. Market Analysis, Insights and Forecast - by End-User
- 8.3.1. Hospital
- 8.3.2. Beauty Clinics
- 8.3.3. Other End-Users
- 8.1. Market Analysis, Insights and Forecast - by Type
- 9. Middle East and Africa Non-Surgical Aesthetic Devices Market Analysis, Insights and Forecast, 2019-2031
- 9.1. Market Analysis, Insights and Forecast - by Type
- 9.1.1. Laser-based Aesthetic Device
- 9.1.2. Radiofrequency (RF) Based Aesthetic Device
- 9.1.3. Ultrasound Aesthetic Device
- 9.1.4. Intense Pulsed Light Device
- 9.1.5. Other Types
- 9.2. Market Analysis, Insights and Forecast - by Application
- 9.2.1. Skin Resurfacing and Tightening
- 9.2.2. Body Contouring and Cellulite Reduction
- 9.2.3. Hair Removal
- 9.2.4. Tattoo Removal
- 9.2.5. Other Applications
- 9.3. Market Analysis, Insights and Forecast - by End-User
- 9.3.1. Hospital
- 9.3.2. Beauty Clinics
- 9.3.3. Other End-Users
- 9.1. Market Analysis, Insights and Forecast - by Type
- 10. South America Non-Surgical Aesthetic Devices Market Analysis, Insights and Forecast, 2019-2031
- 10.1. Market Analysis, Insights and Forecast - by Type
- 10.1.1. Laser-based Aesthetic Device
- 10.1.2. Radiofrequency (RF) Based Aesthetic Device
- 10.1.3. Ultrasound Aesthetic Device
- 10.1.4. Intense Pulsed Light Device
- 10.1.5. Other Types
- 10.2. Market Analysis, Insights and Forecast - by Application
- 10.2.1. Skin Resurfacing and Tightening
- 10.2.2. Body Contouring and Cellulite Reduction
- 10.2.3. Hair Removal
- 10.2.4. Tattoo Removal
- 10.2.5. Other Applications
- 10.3. Market Analysis, Insights and Forecast - by End-User
- 10.3.1. Hospital
- 10.3.2. Beauty Clinics
- 10.3.3. Other End-Users
- 10.1. Market Analysis, Insights and Forecast - by Type
- 11. North America Non-Surgical Aesthetic Devices Market Analysis, Insights and Forecast, 2019-2031
- 11.1. Market Analysis, Insights and Forecast - By Country/Sub-region
- 11.1.1 United States
- 11.1.2 Canada
- 11.1.3 Mexico
- 12. Europe Non-Surgical Aesthetic Devices Market Analysis, Insights and Forecast, 2019-2031
- 12.1. Market Analysis, Insights and Forecast - By Country/Sub-region
- 12.1.1 Germany
- 12.1.2 United Kingdom
- 12.1.3 France
- 12.1.4 Italy
- 12.1.5 Spain
- 12.1.6 Rest of Europe
- 13. Asia Pacific Non-Surgical Aesthetic Devices Market Analysis, Insights and Forecast, 2019-2031
- 13.1. Market Analysis, Insights and Forecast - By Country/Sub-region
- 13.1.1 China
- 13.1.2 Japan
- 13.1.3 India
- 13.1.4 Australia
- 13.1.5 South Korea
- 13.1.6 Rest of Asia Pacific
- 14. Middle East and Africa Non-Surgical Aesthetic Devices Market Analysis, Insights and Forecast, 2019-2031
- 14.1. Market Analysis, Insights and Forecast - By Country/Sub-region
- 14.1.1 GCC
- 14.1.2 South Africa
- 14.1.3 Rest of Middle East and Africa
- 15. South America Non-Surgical Aesthetic Devices Market Analysis, Insights and Forecast, 2019-2031
- 15.1. Market Analysis, Insights and Forecast - By Country/Sub-region
- 15.1.1 Brazil
- 15.1.2 Argentina
- 15.1.3 Rest of South America
- 16. Competitive Analysis
- 16.1. Global Market Share Analysis 2024
- 16.2. Company Profiles
- 16.2.1 El En S p A
- 16.2.1.1. Overview
- 16.2.1.2. Products
- 16.2.1.3. SWOT Analysis
- 16.2.1.4. Recent Developments
- 16.2.1.5. Financials (Based on Availability)
- 16.2.2 Sisram Medical (Alma Lasers)
- 16.2.2.1. Overview
- 16.2.2.2. Products
- 16.2.2.3. SWOT Analysis
- 16.2.2.4. Recent Developments
- 16.2.2.5. Financials (Based on Availability)
- 16.2.3 Boston Scientific Corporation (Lumenis Inc )
- 16.2.3.1. Overview
- 16.2.3.2. Products
- 16.2.3.3. SWOT Analysis
- 16.2.3.4. Recent Developments
- 16.2.3.5. Financials (Based on Availability)
- 16.2.4 Bausch & Lomb Incorporated
- 16.2.4.1. Overview
- 16.2.4.2. Products
- 16.2.4.3. SWOT Analysis
- 16.2.4.4. Recent Developments
- 16.2.4.5. Financials (Based on Availability)
- 16.2.5 Lutronic
- 16.2.5.1. Overview
- 16.2.5.2. Products
- 16.2.5.3. SWOT Analysis
- 16.2.5.4. Recent Developments
- 16.2.5.5. Financials (Based on Availability)
- 16.2.6 Fotona
- 16.2.6.1. Overview
- 16.2.6.2. Products
- 16.2.6.3. SWOT Analysis
- 16.2.6.4. Recent Developments
- 16.2.6.5. Financials (Based on Availability)
- 16.2.7 Cutera Inc
- 16.2.7.1. Overview
- 16.2.7.2. Products
- 16.2.7.3. SWOT Analysis
- 16.2.7.4. Recent Developments
- 16.2.7.5. Financials (Based on Availability)
- 16.2.8 STRATA Skin Sciences
- 16.2.8.1. Overview
- 16.2.8.2. Products
- 16.2.8.3. SWOT Analysis
- 16.2.8.4. Recent Developments
- 16.2.8.5. Financials (Based on Availability)
- 16.2.9 Lynton Lasers Ltd
- 16.2.9.1. Overview
- 16.2.9.2. Products
- 16.2.9.3. SWOT Analysis
- 16.2.9.4. Recent Developments
- 16.2.9.5. Financials (Based on Availability)
- 16.2.10 Sciton Inc
- 16.2.10.1. Overview
- 16.2.10.2. Products
- 16.2.10.3. SWOT Analysis
- 16.2.10.4. Recent Developments
- 16.2.10.5. Financials (Based on Availability)
- 16.2.1 El En S p A
List of Figures
- Figure 1: Global Non-Surgical Aesthetic Devices Market Revenue Breakdown (Million, %) by Region 2024 & 2032
- Figure 2: Global Non-Surgical Aesthetic Devices Market Volume Breakdown (K Unit, %) by Region 2024 & 2032
- Figure 3: North America Non-Surgical Aesthetic Devices Market Revenue (Million), by Country 2024 & 2032
- Figure 4: North America Non-Surgical Aesthetic Devices Market Volume (K Unit), by Country 2024 & 2032
- Figure 5: North America Non-Surgical Aesthetic Devices Market Revenue Share (%), by Country 2024 & 2032
- Figure 6: North America Non-Surgical Aesthetic Devices Market Volume Share (%), by Country 2024 & 2032
- Figure 7: Europe Non-Surgical Aesthetic Devices Market Revenue (Million), by Country 2024 & 2032
- Figure 8: Europe Non-Surgical Aesthetic Devices Market Volume (K Unit), by Country 2024 & 2032
- Figure 9: Europe Non-Surgical Aesthetic Devices Market Revenue Share (%), by Country 2024 & 2032
- Figure 10: Europe Non-Surgical Aesthetic Devices Market Volume Share (%), by Country 2024 & 2032
- Figure 11: Asia Pacific Non-Surgical Aesthetic Devices Market Revenue (Million), by Country 2024 & 2032
- Figure 12: Asia Pacific Non-Surgical Aesthetic Devices Market Volume (K Unit), by Country 2024 & 2032
- Figure 13: Asia Pacific Non-Surgical Aesthetic Devices Market Revenue Share (%), by Country 2024 & 2032
- Figure 14: Asia Pacific Non-Surgical Aesthetic Devices Market Volume Share (%), by Country 2024 & 2032
- Figure 15: Middle East and Africa Non-Surgical Aesthetic Devices Market Revenue (Million), by Country 2024 & 2032
- Figure 16: Middle East and Africa Non-Surgical Aesthetic Devices Market Volume (K Unit), by Country 2024 & 2032
- Figure 17: Middle East and Africa Non-Surgical Aesthetic Devices Market Revenue Share (%), by Country 2024 & 2032
- Figure 18: Middle East and Africa Non-Surgical Aesthetic Devices Market Volume Share (%), by Country 2024 & 2032
- Figure 19: South America Non-Surgical Aesthetic Devices Market Revenue (Million), by Country 2024 & 2032
- Figure 20: South America Non-Surgical Aesthetic Devices Market Volume (K Unit), by Country 2024 & 2032
- Figure 21: South America Non-Surgical Aesthetic Devices Market Revenue Share (%), by Country 2024 & 2032
- Figure 22: South America Non-Surgical Aesthetic Devices Market Volume Share (%), by Country 2024 & 2032
- Figure 23: North America Non-Surgical Aesthetic Devices Market Revenue (Million), by Type 2024 & 2032
- Figure 24: North America Non-Surgical Aesthetic Devices Market Volume (K Unit), by Type 2024 & 2032
- Figure 25: North America Non-Surgical Aesthetic Devices Market Revenue Share (%), by Type 2024 & 2032
- Figure 26: North America Non-Surgical Aesthetic Devices Market Volume Share (%), by Type 2024 & 2032
- Figure 27: North America Non-Surgical Aesthetic Devices Market Revenue (Million), by Application 2024 & 2032
- Figure 28: North America Non-Surgical Aesthetic Devices Market Volume (K Unit), by Application 2024 & 2032
- Figure 29: North America Non-Surgical Aesthetic Devices Market Revenue Share (%), by Application 2024 & 2032
- Figure 30: North America Non-Surgical Aesthetic Devices Market Volume Share (%), by Application 2024 & 2032
- Figure 31: North America Non-Surgical Aesthetic Devices Market Revenue (Million), by End-User 2024 & 2032
- Figure 32: North America Non-Surgical Aesthetic Devices Market Volume (K Unit), by End-User 2024 & 2032
- Figure 33: North America Non-Surgical Aesthetic Devices Market Revenue Share (%), by End-User 2024 & 2032
- Figure 34: North America Non-Surgical Aesthetic Devices Market Volume Share (%), by End-User 2024 & 2032
- Figure 35: North America Non-Surgical Aesthetic Devices Market Revenue (Million), by Country 2024 & 2032
- Figure 36: North America Non-Surgical Aesthetic Devices Market Volume (K Unit), by Country 2024 & 2032
- Figure 37: North America Non-Surgical Aesthetic Devices Market Revenue Share (%), by Country 2024 & 2032
- Figure 38: North America Non-Surgical Aesthetic Devices Market Volume Share (%), by Country 2024 & 2032
- Figure 39: Europe Non-Surgical Aesthetic Devices Market Revenue (Million), by Type 2024 & 2032
- Figure 40: Europe Non-Surgical Aesthetic Devices Market Volume (K Unit), by Type 2024 & 2032
- Figure 41: Europe Non-Surgical Aesthetic Devices Market Revenue Share (%), by Type 2024 & 2032
- Figure 42: Europe Non-Surgical Aesthetic Devices Market Volume Share (%), by Type 2024 & 2032
- Figure 43: Europe Non-Surgical Aesthetic Devices Market Revenue (Million), by Application 2024 & 2032
- Figure 44: Europe Non-Surgical Aesthetic Devices Market Volume (K Unit), by Application 2024 & 2032
- Figure 45: Europe Non-Surgical Aesthetic Devices Market Revenue Share (%), by Application 2024 & 2032
- Figure 46: Europe Non-Surgical Aesthetic Devices Market Volume Share (%), by Application 2024 & 2032
- Figure 47: Europe Non-Surgical Aesthetic Devices Market Revenue (Million), by End-User 2024 & 2032
- Figure 48: Europe Non-Surgical Aesthetic Devices Market Volume (K Unit), by End-User 2024 & 2032
- Figure 49: Europe Non-Surgical Aesthetic Devices Market Revenue Share (%), by End-User 2024 & 2032
- Figure 50: Europe Non-Surgical Aesthetic Devices Market Volume Share (%), by End-User 2024 & 2032
- Figure 51: Europe Non-Surgical Aesthetic Devices Market Revenue (Million), by Country 2024 & 2032
- Figure 52: Europe Non-Surgical Aesthetic Devices Market Volume (K Unit), by Country 2024 & 2032
- Figure 53: Europe Non-Surgical Aesthetic Devices Market Revenue Share (%), by Country 2024 & 2032
- Figure 54: Europe Non-Surgical Aesthetic Devices Market Volume Share (%), by Country 2024 & 2032
- Figure 55: Asia Pacific Non-Surgical Aesthetic Devices Market Revenue (Million), by Type 2024 & 2032
- Figure 56: Asia Pacific Non-Surgical Aesthetic Devices Market Volume (K Unit), by Type 2024 & 2032
- Figure 57: Asia Pacific Non-Surgical Aesthetic Devices Market Revenue Share (%), by Type 2024 & 2032
- Figure 58: Asia Pacific Non-Surgical Aesthetic Devices Market Volume Share (%), by Type 2024 & 2032
- Figure 59: Asia Pacific Non-Surgical Aesthetic Devices Market Revenue (Million), by Application 2024 & 2032
- Figure 60: Asia Pacific Non-Surgical Aesthetic Devices Market Volume (K Unit), by Application 2024 & 2032
- Figure 61: Asia Pacific Non-Surgical Aesthetic Devices Market Revenue Share (%), by Application 2024 & 2032
- Figure 62: Asia Pacific Non-Surgical Aesthetic Devices Market Volume Share (%), by Application 2024 & 2032
- Figure 63: Asia Pacific Non-Surgical Aesthetic Devices Market Revenue (Million), by End-User 2024 & 2032
- Figure 64: Asia Pacific Non-Surgical Aesthetic Devices Market Volume (K Unit), by End-User 2024 & 2032
- Figure 65: Asia Pacific Non-Surgical Aesthetic Devices Market Revenue Share (%), by End-User 2024 & 2032
- Figure 66: Asia Pacific Non-Surgical Aesthetic Devices Market Volume Share (%), by End-User 2024 & 2032
- Figure 67: Asia Pacific Non-Surgical Aesthetic Devices Market Revenue (Million), by Country 2024 & 2032
- Figure 68: Asia Pacific Non-Surgical Aesthetic Devices Market Volume (K Unit), by Country 2024 & 2032
- Figure 69: Asia Pacific Non-Surgical Aesthetic Devices Market Revenue Share (%), by Country 2024 & 2032
- Figure 70: Asia Pacific Non-Surgical Aesthetic Devices Market Volume Share (%), by Country 2024 & 2032
- Figure 71: Middle East and Africa Non-Surgical Aesthetic Devices Market Revenue (Million), by Type 2024 & 2032
- Figure 72: Middle East and Africa Non-Surgical Aesthetic Devices Market Volume (K Unit), by Type 2024 & 2032
- Figure 73: Middle East and Africa Non-Surgical Aesthetic Devices Market Revenue Share (%), by Type 2024 & 2032
- Figure 74: Middle East and Africa Non-Surgical Aesthetic Devices Market Volume Share (%), by Type 2024 & 2032
- Figure 75: Middle East and Africa Non-Surgical Aesthetic Devices Market Revenue (Million), by Application 2024 & 2032
- Figure 76: Middle East and Africa Non-Surgical Aesthetic Devices Market Volume (K Unit), by Application 2024 & 2032
- Figure 77: Middle East and Africa Non-Surgical Aesthetic Devices Market Revenue Share (%), by Application 2024 & 2032
- Figure 78: Middle East and Africa Non-Surgical Aesthetic Devices Market Volume Share (%), by Application 2024 & 2032
- Figure 79: Middle East and Africa Non-Surgical Aesthetic Devices Market Revenue (Million), by End-User 2024 & 2032
- Figure 80: Middle East and Africa Non-Surgical Aesthetic Devices Market Volume (K Unit), by End-User 2024 & 2032
- Figure 81: Middle East and Africa Non-Surgical Aesthetic Devices Market Revenue Share (%), by End-User 2024 & 2032
- Figure 82: Middle East and Africa Non-Surgical Aesthetic Devices Market Volume Share (%), by End-User 2024 & 2032
- Figure 83: Middle East and Africa Non-Surgical Aesthetic Devices Market Revenue (Million), by Country 2024 & 2032
- Figure 84: Middle East and Africa Non-Surgical Aesthetic Devices Market Volume (K Unit), by Country 2024 & 2032
- Figure 85: Middle East and Africa Non-Surgical Aesthetic Devices Market Revenue Share (%), by Country 2024 & 2032
- Figure 86: Middle East and Africa Non-Surgical Aesthetic Devices Market Volume Share (%), by Country 2024 & 2032
- Figure 87: South America Non-Surgical Aesthetic Devices Market Revenue (Million), by Type 2024 & 2032
- Figure 88: South America Non-Surgical Aesthetic Devices Market Volume (K Unit), by Type 2024 & 2032
- Figure 89: South America Non-Surgical Aesthetic Devices Market Revenue Share (%), by Type 2024 & 2032
- Figure 90: South America Non-Surgical Aesthetic Devices Market Volume Share (%), by Type 2024 & 2032
- Figure 91: South America Non-Surgical Aesthetic Devices Market Revenue (Million), by Application 2024 & 2032
- Figure 92: South America Non-Surgical Aesthetic Devices Market Volume (K Unit), by Application 2024 & 2032
- Figure 93: South America Non-Surgical Aesthetic Devices Market Revenue Share (%), by Application 2024 & 2032
- Figure 94: South America Non-Surgical Aesthetic Devices Market Volume Share (%), by Application 2024 & 2032
- Figure 95: South America Non-Surgical Aesthetic Devices Market Revenue (Million), by End-User 2024 & 2032
- Figure 96: South America Non-Surgical Aesthetic Devices Market Volume (K Unit), by End-User 2024 & 2032
- Figure 97: South America Non-Surgical Aesthetic Devices Market Revenue Share (%), by End-User 2024 & 2032
- Figure 98: South America Non-Surgical Aesthetic Devices Market Volume Share (%), by End-User 2024 & 2032
- Figure 99: South America Non-Surgical Aesthetic Devices Market Revenue (Million), by Country 2024 & 2032
- Figure 100: South America Non-Surgical Aesthetic Devices Market Volume (K Unit), by Country 2024 & 2032
- Figure 101: South America Non-Surgical Aesthetic Devices Market Revenue Share (%), by Country 2024 & 2032
- Figure 102: South America Non-Surgical Aesthetic Devices Market Volume Share (%), by Country 2024 & 2032
List of Tables
- Table 1: Global Non-Surgical Aesthetic Devices Market Revenue Million Forecast, by Region 2019 & 2032
- Table 2: Global Non-Surgical Aesthetic Devices Market Volume K Unit Forecast, by Region 2019 & 2032
- Table 3: Global Non-Surgical Aesthetic Devices Market Revenue Million Forecast, by Type 2019 & 2032
- Table 4: Global Non-Surgical Aesthetic Devices Market Volume K Unit Forecast, by Type 2019 & 2032
- Table 5: Global Non-Surgical Aesthetic Devices Market Revenue Million Forecast, by Application 2019 & 2032
- Table 6: Global Non-Surgical Aesthetic Devices Market Volume K Unit Forecast, by Application 2019 & 2032
- Table 7: Global Non-Surgical Aesthetic Devices Market Revenue Million Forecast, by End-User 2019 & 2032
- Table 8: Global Non-Surgical Aesthetic Devices Market Volume K Unit Forecast, by End-User 2019 & 2032
- Table 9: Global Non-Surgical Aesthetic Devices Market Revenue Million Forecast, by Region 2019 & 2032
- Table 10: Global Non-Surgical Aesthetic Devices Market Volume K Unit Forecast, by Region 2019 & 2032
- Table 11: Global Non-Surgical Aesthetic Devices Market Revenue Million Forecast, by Country 2019 & 2032
- Table 12: Global Non-Surgical Aesthetic Devices Market Volume K Unit Forecast, by Country 2019 & 2032
- Table 13: United States Non-Surgical Aesthetic Devices Market Revenue (Million) Forecast, by Application 2019 & 2032
- Table 14: United States Non-Surgical Aesthetic Devices Market Volume (K Unit) Forecast, by Application 2019 & 2032
- Table 15: Canada Non-Surgical Aesthetic Devices Market Revenue (Million) Forecast, by Application 2019 & 2032
- Table 16: Canada Non-Surgical Aesthetic Devices Market Volume (K Unit) Forecast, by Application 2019 & 2032
- Table 17: Mexico Non-Surgical Aesthetic Devices Market Revenue (Million) Forecast, by Application 2019 & 2032
- Table 18: Mexico Non-Surgical Aesthetic Devices Market Volume (K Unit) Forecast, by Application 2019 & 2032
- Table 19: Global Non-Surgical Aesthetic Devices Market Revenue Million Forecast, by Country 2019 & 2032
- Table 20: Global Non-Surgical Aesthetic Devices Market Volume K Unit Forecast, by Country 2019 & 2032
- Table 21: Germany Non-Surgical Aesthetic Devices Market Revenue (Million) Forecast, by Application 2019 & 2032
- Table 22: Germany Non-Surgical Aesthetic Devices Market Volume (K Unit) Forecast, by Application 2019 & 2032
- Table 23: United Kingdom Non-Surgical Aesthetic Devices Market Revenue (Million) Forecast, by Application 2019 & 2032
- Table 24: United Kingdom Non-Surgical Aesthetic Devices Market Volume (K Unit) Forecast, by Application 2019 & 2032
- Table 25: France Non-Surgical Aesthetic Devices Market Revenue (Million) Forecast, by Application 2019 & 2032
- Table 26: France Non-Surgical Aesthetic Devices Market Volume (K Unit) Forecast, by Application 2019 & 2032
- Table 27: Italy Non-Surgical Aesthetic Devices Market Revenue (Million) Forecast, by Application 2019 & 2032
- Table 28: Italy Non-Surgical Aesthetic Devices Market Volume (K Unit) Forecast, by Application 2019 & 2032
- Table 29: Spain Non-Surgical Aesthetic Devices Market Revenue (Million) Forecast, by Application 2019 & 2032
- Table 30: Spain Non-Surgical Aesthetic Devices Market Volume (K Unit) Forecast, by Application 2019 & 2032
- Table 31: Rest of Europe Non-Surgical Aesthetic Devices Market Revenue (Million) Forecast, by Application 2019 & 2032
- Table 32: Rest of Europe Non-Surgical Aesthetic Devices Market Volume (K Unit) Forecast, by Application 2019 & 2032
- Table 33: Global Non-Surgical Aesthetic Devices Market Revenue Million Forecast, by Country 2019 & 2032
- Table 34: Global Non-Surgical Aesthetic Devices Market Volume K Unit Forecast, by Country 2019 & 2032
- Table 35: China Non-Surgical Aesthetic Devices Market Revenue (Million) Forecast, by Application 2019 & 2032
- Table 36: China Non-Surgical Aesthetic Devices Market Volume (K Unit) Forecast, by Application 2019 & 2032
- Table 37: Japan Non-Surgical Aesthetic Devices Market Revenue (Million) Forecast, by Application 2019 & 2032
- Table 38: Japan Non-Surgical Aesthetic Devices Market Volume (K Unit) Forecast, by Application 2019 & 2032
- Table 39: India Non-Surgical Aesthetic Devices Market Revenue (Million) Forecast, by Application 2019 & 2032
- Table 40: India Non-Surgical Aesthetic Devices Market Volume (K Unit) Forecast, by Application 2019 & 2032
- Table 41: Australia Non-Surgical Aesthetic Devices Market Revenue (Million) Forecast, by Application 2019 & 2032
- Table 42: Australia Non-Surgical Aesthetic Devices Market Volume (K Unit) Forecast, by Application 2019 & 2032
- Table 43: South Korea Non-Surgical Aesthetic Devices Market Revenue (Million) Forecast, by Application 2019 & 2032
- Table 44: South Korea Non-Surgical Aesthetic Devices Market Volume (K Unit) Forecast, by Application 2019 & 2032
- Table 45: Rest of Asia Pacific Non-Surgical Aesthetic Devices Market Revenue (Million) Forecast, by Application 2019 & 2032
- Table 46: Rest of Asia Pacific Non-Surgical Aesthetic Devices Market Volume (K Unit) Forecast, by Application 2019 & 2032
- Table 47: Global Non-Surgical Aesthetic Devices Market Revenue Million Forecast, by Country 2019 & 2032
- Table 48: Global Non-Surgical Aesthetic Devices Market Volume K Unit Forecast, by Country 2019 & 2032
- Table 49: GCC Non-Surgical Aesthetic Devices Market Revenue (Million) Forecast, by Application 2019 & 2032
- Table 50: GCC Non-Surgical Aesthetic Devices Market Volume (K Unit) Forecast, by Application 2019 & 2032
- Table 51: South Africa Non-Surgical Aesthetic Devices Market Revenue (Million) Forecast, by Application 2019 & 2032
- Table 52: South Africa Non-Surgical Aesthetic Devices Market Volume (K Unit) Forecast, by Application 2019 & 2032
- Table 53: Rest of Middle East and Africa Non-Surgical Aesthetic Devices Market Revenue (Million) Forecast, by Application 2019 & 2032
- Table 54: Rest of Middle East and Africa Non-Surgical Aesthetic Devices Market Volume (K Unit) Forecast, by Application 2019 & 2032
- Table 55: Global Non-Surgical Aesthetic Devices Market Revenue Million Forecast, by Country 2019 & 2032
- Table 56: Global Non-Surgical Aesthetic Devices Market Volume K Unit Forecast, by Country 2019 & 2032
- Table 57: Brazil Non-Surgical Aesthetic Devices Market Revenue (Million) Forecast, by Application 2019 & 2032
- Table 58: Brazil Non-Surgical Aesthetic Devices Market Volume (K Unit) Forecast, by Application 2019 & 2032
- Table 59: Argentina Non-Surgical Aesthetic Devices Market Revenue (Million) Forecast, by Application 2019 & 2032
- Table 60: Argentina Non-Surgical Aesthetic Devices Market Volume (K Unit) Forecast, by Application 2019 & 2032
- Table 61: Rest of South America Non-Surgical Aesthetic Devices Market Revenue (Million) Forecast, by Application 2019 & 2032
- Table 62: Rest of South America Non-Surgical Aesthetic Devices Market Volume (K Unit) Forecast, by Application 2019 & 2032
- Table 63: Global Non-Surgical Aesthetic Devices Market Revenue Million Forecast, by Type 2019 & 2032
- Table 64: Global Non-Surgical Aesthetic Devices Market Volume K Unit Forecast, by Type 2019 & 2032
- Table 65: Global Non-Surgical Aesthetic Devices Market Revenue Million Forecast, by Application 2019 & 2032
- Table 66: Global Non-Surgical Aesthetic Devices Market Volume K Unit Forecast, by Application 2019 & 2032
- Table 67: Global Non-Surgical Aesthetic Devices Market Revenue Million Forecast, by End-User 2019 & 2032
- Table 68: Global Non-Surgical Aesthetic Devices Market Volume K Unit Forecast, by End-User 2019 & 2032
- Table 69: Global Non-Surgical Aesthetic Devices Market Revenue Million Forecast, by Country 2019 & 2032
- Table 70: Global Non-Surgical Aesthetic Devices Market Volume K Unit Forecast, by Country 2019 & 2032
- Table 71: United States Non-Surgical Aesthetic Devices Market Revenue (Million) Forecast, by Application 2019 & 2032
- Table 72: United States Non-Surgical Aesthetic Devices Market Volume (K Unit) Forecast, by Application 2019 & 2032
- Table 73: Canada Non-Surgical Aesthetic Devices Market Revenue (Million) Forecast, by Application 2019 & 2032
- Table 74: Canada Non-Surgical Aesthetic Devices Market Volume (K Unit) Forecast, by Application 2019 & 2032
- Table 75: Mexico Non-Surgical Aesthetic Devices Market Revenue (Million) Forecast, by Application 2019 & 2032
- Table 76: Mexico Non-Surgical Aesthetic Devices Market Volume (K Unit) Forecast, by Application 2019 & 2032
- Table 77: Global Non-Surgical Aesthetic Devices Market Revenue Million Forecast, by Type 2019 & 2032
- Table 78: Global Non-Surgical Aesthetic Devices Market Volume K Unit Forecast, by Type 2019 & 2032
- Table 79: Global Non-Surgical Aesthetic Devices Market Revenue Million Forecast, by Application 2019 & 2032
- Table 80: Global Non-Surgical Aesthetic Devices Market Volume K Unit Forecast, by Application 2019 & 2032
- Table 81: Global Non-Surgical Aesthetic Devices Market Revenue Million Forecast, by End-User 2019 & 2032
- Table 82: Global Non-Surgical Aesthetic Devices Market Volume K Unit Forecast, by End-User 2019 & 2032
- Table 83: Global Non-Surgical Aesthetic Devices Market Revenue Million Forecast, by Country 2019 & 2032
- Table 84: Global Non-Surgical Aesthetic Devices Market Volume K Unit Forecast, by Country 2019 & 2032
- Table 85: Germany Non-Surgical Aesthetic Devices Market Revenue (Million) Forecast, by Application 2019 & 2032
- Table 86: Germany Non-Surgical Aesthetic Devices Market Volume (K Unit) Forecast, by Application 2019 & 2032
- Table 87: United Kingdom Non-Surgical Aesthetic Devices Market Revenue (Million) Forecast, by Application 2019 & 2032
- Table 88: United Kingdom Non-Surgical Aesthetic Devices Market Volume (K Unit) Forecast, by Application 2019 & 2032
- Table 89: France Non-Surgical Aesthetic Devices Market Revenue (Million) Forecast, by Application 2019 & 2032
- Table 90: France Non-Surgical Aesthetic Devices Market Volume (K Unit) Forecast, by Application 2019 & 2032
- Table 91: Italy Non-Surgical Aesthetic Devices Market Revenue (Million) Forecast, by Application 2019 & 2032
- Table 92: Italy Non-Surgical Aesthetic Devices Market Volume (K Unit) Forecast, by Application 2019 & 2032
- Table 93: Spain Non-Surgical Aesthetic Devices Market Revenue (Million) Forecast, by Application 2019 & 2032
- Table 94: Spain Non-Surgical Aesthetic Devices Market Volume (K Unit) Forecast, by Application 2019 & 2032
- Table 95: Rest of Europe Non-Surgical Aesthetic Devices Market Revenue (Million) Forecast, by Application 2019 & 2032
- Table 96: Rest of Europe Non-Surgical Aesthetic Devices Market Volume (K Unit) Forecast, by Application 2019 & 2032
- Table 97: Global Non-Surgical Aesthetic Devices Market Revenue Million Forecast, by Type 2019 & 2032
- Table 98: Global Non-Surgical Aesthetic Devices Market Volume K Unit Forecast, by Type 2019 & 2032
- Table 99: Global Non-Surgical Aesthetic Devices Market Revenue Million Forecast, by Application 2019 & 2032
- Table 100: Global Non-Surgical Aesthetic Devices Market Volume K Unit Forecast, by Application 2019 & 2032
- Table 101: Global Non-Surgical Aesthetic Devices Market Revenue Million Forecast, by End-User 2019 & 2032
- Table 102: Global Non-Surgical Aesthetic Devices Market Volume K Unit Forecast, by End-User 2019 & 2032
- Table 103: Global Non-Surgical Aesthetic Devices Market Revenue Million Forecast, by Country 2019 & 2032
- Table 104: Global Non-Surgical Aesthetic Devices Market Volume K Unit Forecast, by Country 2019 & 2032
- Table 105: China Non-Surgical Aesthetic Devices Market Revenue (Million) Forecast, by Application 2019 & 2032
- Table 106: China Non-Surgical Aesthetic Devices Market Volume (K Unit) Forecast, by Application 2019 & 2032
- Table 107: Japan Non-Surgical Aesthetic Devices Market Revenue (Million) Forecast, by Application 2019 & 2032
- Table 108: Japan Non-Surgical Aesthetic Devices Market Volume (K Unit) Forecast, by Application 2019 & 2032
- Table 109: India Non-Surgical Aesthetic Devices Market Revenue (Million) Forecast, by Application 2019 & 2032
- Table 110: India Non-Surgical Aesthetic Devices Market Volume (K Unit) Forecast, by Application 2019 & 2032
- Table 111: Australia Non-Surgical Aesthetic Devices Market Revenue (Million) Forecast, by Application 2019 & 2032
- Table 112: Australia Non-Surgical Aesthetic Devices Market Volume (K Unit) Forecast, by Application 2019 & 2032
- Table 113: South Korea Non-Surgical Aesthetic Devices Market Revenue (Million) Forecast, by Application 2019 & 2032
- Table 114: South Korea Non-Surgical Aesthetic Devices Market Volume (K Unit) Forecast, by Application 2019 & 2032
- Table 115: Rest of Asia Pacific Non-Surgical Aesthetic Devices Market Revenue (Million) Forecast, by Application 2019 & 2032
- Table 116: Rest of Asia Pacific Non-Surgical Aesthetic Devices Market Volume (K Unit) Forecast, by Application 2019 & 2032
- Table 117: Global Non-Surgical Aesthetic Devices Market Revenue Million Forecast, by Type 2019 & 2032
- Table 118: Global Non-Surgical Aesthetic Devices Market Volume K Unit Forecast, by Type 2019 & 2032
- Table 119: Global Non-Surgical Aesthetic Devices Market Revenue Million Forecast, by Application 2019 & 2032
- Table 120: Global Non-Surgical Aesthetic Devices Market Volume K Unit Forecast, by Application 2019 & 2032
- Table 121: Global Non-Surgical Aesthetic Devices Market Revenue Million Forecast, by End-User 2019 & 2032
- Table 122: Global Non-Surgical Aesthetic Devices Market Volume K Unit Forecast, by End-User 2019 & 2032
- Table 123: Global Non-Surgical Aesthetic Devices Market Revenue Million Forecast, by Country 2019 & 2032
- Table 124: Global Non-Surgical Aesthetic Devices Market Volume K Unit Forecast, by Country 2019 & 2032
- Table 125: GCC Non-Surgical Aesthetic Devices Market Revenue (Million) Forecast, by Application 2019 & 2032
- Table 126: GCC Non-Surgical Aesthetic Devices Market Volume (K Unit) Forecast, by Application 2019 & 2032
- Table 127: South Africa Non-Surgical Aesthetic Devices Market Revenue (Million) Forecast, by Application 2019 & 2032
- Table 128: South Africa Non-Surgical Aesthetic Devices Market Volume (K Unit) Forecast, by Application 2019 & 2032
- Table 129: Rest of Middle East and Africa Non-Surgical Aesthetic Devices Market Revenue (Million) Forecast, by Application 2019 & 2032
- Table 130: Rest of Middle East and Africa Non-Surgical Aesthetic Devices Market Volume (K Unit) Forecast, by Application 2019 & 2032
- Table 131: Global Non-Surgical Aesthetic Devices Market Revenue Million Forecast, by Type 2019 & 2032
- Table 132: Global Non-Surgical Aesthetic Devices Market Volume K Unit Forecast, by Type 2019 & 2032
- Table 133: Global Non-Surgical Aesthetic Devices Market Revenue Million Forecast, by Application 2019 & 2032
- Table 134: Global Non-Surgical Aesthetic Devices Market Volume K Unit Forecast, by Application 2019 & 2032
- Table 135: Global Non-Surgical Aesthetic Devices Market Revenue Million Forecast, by End-User 2019 & 2032
- Table 136: Global Non-Surgical Aesthetic Devices Market Volume K Unit Forecast, by End-User 2019 & 2032
- Table 137: Global Non-Surgical Aesthetic Devices Market Revenue Million Forecast, by Country 2019 & 2032
- Table 138: Global Non-Surgical Aesthetic Devices Market Volume K Unit Forecast, by Country 2019 & 2032
- Table 139: Brazil Non-Surgical Aesthetic Devices Market Revenue (Million) Forecast, by Application 2019 & 2032
- Table 140: Brazil Non-Surgical Aesthetic Devices Market Volume (K Unit) Forecast, by Application 2019 & 2032
- Table 141: Argentina Non-Surgical Aesthetic Devices Market Revenue (Million) Forecast, by Application 2019 & 2032
- Table 142: Argentina Non-Surgical Aesthetic Devices Market Volume (K Unit) Forecast, by Application 2019 & 2032
- Table 143: Rest of South America Non-Surgical Aesthetic Devices Market Revenue (Million) Forecast, by Application 2019 & 2032
- Table 144: Rest of South America Non-Surgical Aesthetic Devices Market Volume (K Unit) Forecast, by Application 2019 & 2032
Frequently Asked Questions
1. What is the projected Compound Annual Growth Rate (CAGR) of the Non-Surgical Aesthetic Devices Market?
The projected CAGR is approximately 7.10%.
2. Which companies are prominent players in the Non-Surgical Aesthetic Devices Market?
Key companies in the market include El En S p A, Sisram Medical (Alma Lasers), Boston Scientific Corporation (Lumenis Inc ), Bausch & Lomb Incorporated, Lutronic, Fotona, Cutera Inc, STRATA Skin Sciences, Lynton Lasers Ltd, Sciton Inc.
3. What are the main segments of the Non-Surgical Aesthetic Devices Market?
The market segments include Type, Application, End-User.
4. Can you provide details about the market size?
The market size is estimated to be USD XX Million as of 2022.
5. What are some drivers contributing to market growth?
Increasing Demand for Non-surgical Aesthetics Procedures; Technological Advancements in Non-surgical Aesthetic Devices.
6. What are the notable trends driving market growth?
Skin Resurfacing and Tightening is Expected to Hold the Significant Market Share Over the Forecast period..
7. Are there any restraints impacting market growth?
High Cost of the Devices.
8. Can you provide examples of recent developments in the market?
October 2022: Sensus Healthcare launched a portable hair removal laser system named Silk Laser Hair Removal System in the United States.
9. What pricing options are available for accessing the report?
Pricing options include single-user, multi-user, and enterprise licenses priced at USD 4750, USD 5250, and USD 8750 respectively.
10. Is the market size provided in terms of value or volume?
The market size is provided in terms of value, measured in Million and volume, measured in K Unit.
11. Are there any specific market keywords associated with the report?
Yes, the market keyword associated with the report is "Non-Surgical Aesthetic Devices Market," which aids in identifying and referencing the specific market segment covered.
12. How do I determine which pricing option suits my needs best?
The pricing options vary based on user requirements and access needs. Individual users may opt for single-user licenses, while businesses requiring broader access may choose multi-user or enterprise licenses for cost-effective access to the report.
13. Are there any additional resources or data provided in the Non-Surgical Aesthetic Devices Market report?
While the report offers comprehensive insights, it's advisable to review the specific contents or supplementary materials provided to ascertain if additional resources or data are available.
14. How can I stay updated on further developments or reports in the Non-Surgical Aesthetic Devices Market?
To stay informed about further developments, trends, and reports in the Non-Surgical Aesthetic Devices Market, consider subscribing to industry newsletters, following relevant companies and organizations, or regularly checking reputable industry news sources and publications.
Methodology
Step 1 - Identification of Relevant Samples Size from Population Database


Step 2 - Approaches for Defining Global Market Size (Value, Volume* & Price*)

Note*: In applicable scenarios
Step 3 - Data Sources
Primary Research
- Web Analytics
- Survey Reports
- Research Institute
- Latest Research Reports
- Opinion Leaders
Secondary Research
- Annual Reports
- White Paper
- Latest Press Release
- Industry Association
- Paid Database
- Investor Presentations

Step 4 - Data Triangulation
Involves using different sources of information in order to increase the validity of a study
These sources are likely to be stakeholders in a program - participants, other researchers, program staff, other community members, and so on.
Then we put all data in single framework & apply various statistical tools to find out the dynamic on the market.
During the analysis stage, feedback from the stakeholder groups would be compared to determine areas of agreement as well as areas of divergence


