

Key Insights
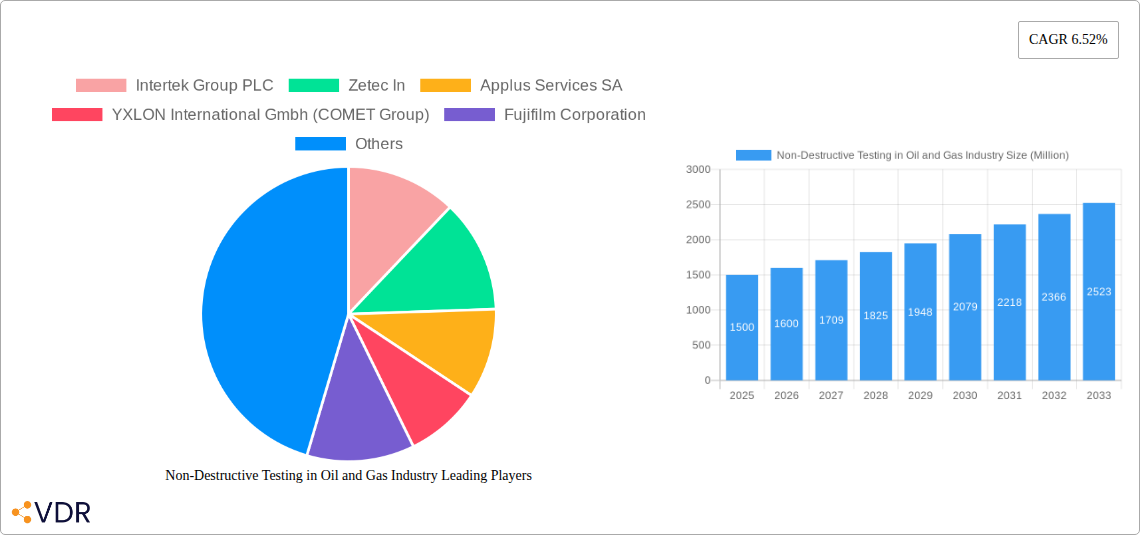
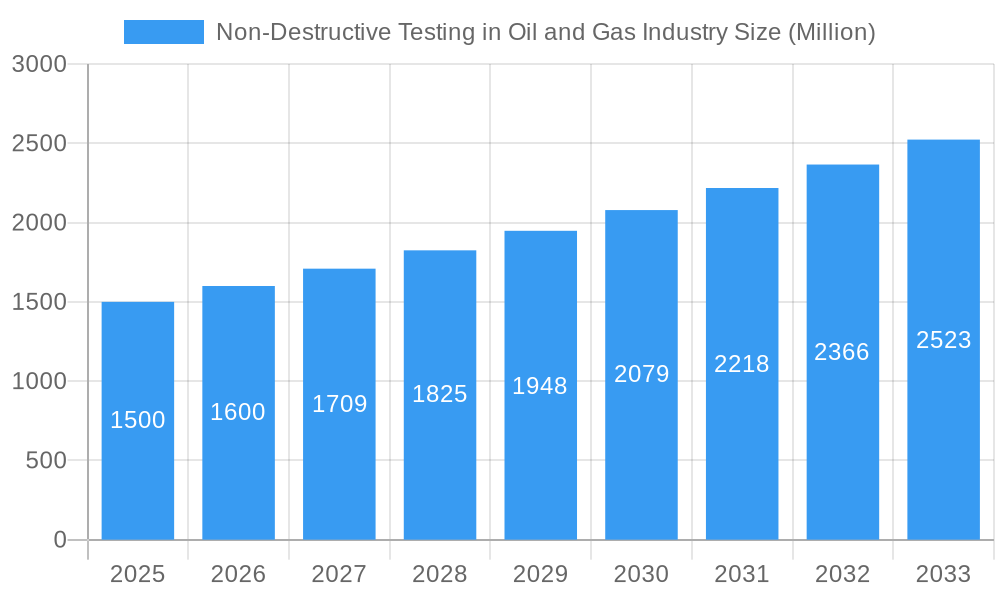
The Non-Destructive Testing (NDT) market in the oil and gas industry is experiencing robust growth, driven by stringent safety regulations, increasing demand for enhanced asset integrity management, and the need to minimize operational downtime and environmental risks. The market, valued at approximately $XX million in 2025, is projected to expand at a Compound Annual Growth Rate (CAGR) of 6.52% from 2025 to 2033. This growth is fueled by several key factors. Firstly, the aging infrastructure within the oil and gas sector necessitates regular and comprehensive NDT inspections to prevent catastrophic failures and ensure operational efficiency. Secondly, advancements in NDT techniques, such as ultrasonic testing and advanced radiography, are enabling more accurate and efficient inspections, leading to increased adoption. Thirdly, the growing emphasis on environmental protection and minimizing the environmental impact of oil and gas operations is pushing for more frequent and rigorous NDT inspections to detect and prevent potential leaks or spills. The market is segmented by type (equipment, services, upstream, midstream, downstream) and technique (ultrasonic, radiography, visual inspection, liquid penetrant, others like magnetic particle and eddy current). While the equipment segment currently holds a significant market share, the services segment is projected to experience faster growth due to the increasing outsourcing of NDT services by oil and gas companies.
Non-Destructive Testing in Oil and Gas Industry Market Size (In Billion)
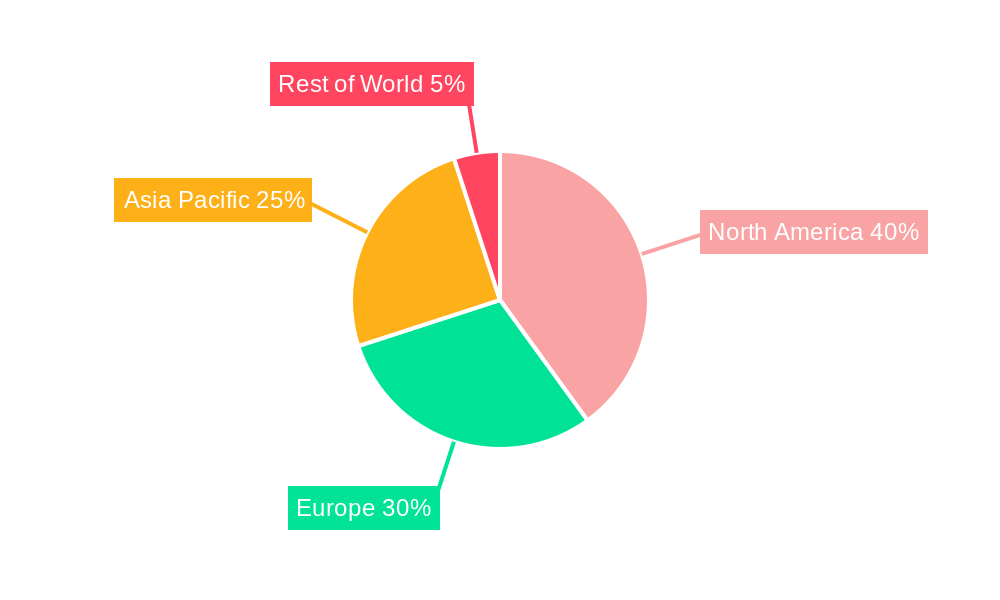
Geographical distribution shows a significant presence across North America, Europe, and the Asia-Pacific region, with North America currently holding the largest market share, attributable to the robust oil and gas infrastructure and stringent regulatory frameworks. However, the Asia-Pacific region is anticipated to showcase the highest growth rate over the forecast period, driven by substantial investments in oil and gas exploration and production activities within the region. Major players like Intertek Group PLC, Zetec Inc., Applus Services SA, and others are actively driving innovation and expanding their service portfolios to cater to the evolving market demands. While increasing inspection costs and the need for skilled personnel represent potential restraints, the overall market outlook remains positive, driven by the sustained growth in the oil and gas industry and the imperative for reliable and safe operations.
Non-Destructive Testing in Oil and Gas Industry Company Market Share
Non-Destructive Testing (NDT) in the Oil & Gas Industry: Market Report 2019-2033
This comprehensive report provides an in-depth analysis of the Non-Destructive Testing (NDT) market within the oil and gas industry, covering the period 2019-2033. It offers invaluable insights for industry professionals, investors, and strategic decision-makers seeking to understand this crucial sector. The report segments the market by type (Equipment, Services), by application (Upstream, Midstream, Downstream), and by technique (Ultrasonic, Radiography, Visual Inspection, Liquid Penetrant, Others), providing a granular view of market dynamics and growth potential. The market is projected to reach xx Million by 2033.
Non-Destructive Testing in Oil and Gas Industry Market Dynamics & Structure
The NDT market in the oil and gas sector is characterized by moderate concentration, with several key players vying for market share. Technological innovation, driven by the need for enhanced safety, efficiency, and reduced operational costs, is a significant growth driver. Stringent regulatory frameworks, demanding ever-higher levels of safety and environmental compliance, also shape market dynamics. The industry witnesses consistent M&A activity as larger players seek to consolidate their market presence and expand their service offerings. Substitute technologies are limited, given the critical need for reliable and accurate NDT methods.
- Market Concentration: Moderately concentrated, with top 10 players holding approximately 60% market share in 2024.
- Technological Innovation: Focus on automation, AI-powered analysis, and miniaturization of equipment.
- Regulatory Landscape: Stringent regulations governing safety and environmental impact drive demand for advanced NDT solutions.
- M&A Activity: An average of 15-20 M&A deals annually in the past 5 years, with a total transaction value exceeding 500 Million.
- End-User Demographics: Predominantly large multinational oil and gas companies, along with an increasing number of smaller, specialized service providers.
Non-Destructive Testing in Oil and Gas Industry Growth Trends & Insights
The global NDT market in the oil and gas industry has experienced consistent growth from 2019 to 2024, driven by increasing exploration and production activities, coupled with a rising focus on asset integrity management. The market is projected to grow at a CAGR of xx% from 2025 to 2033. This growth is fueled by technological advancements, including the adoption of advanced imaging techniques and automation, leading to higher accuracy and efficiency. Furthermore, the increasing demand for enhanced safety and reliability in oil and gas operations continues to drive market expansion. The adoption rate of advanced NDT techniques is steadily increasing, with ultrasonic and radiography remaining dominant, while newer techniques like eddy current testing are gaining traction.
Dominant Regions, Countries, or Segments in Non-Destructive Testing in Oil and Gas Industry
The North American and European markets currently dominate the global NDT market in the oil and gas industry, driven by stringent regulatory frameworks and a high concentration of major oil and gas companies. The Upstream segment is the largest, given the need for NDT across exploration, drilling, and production. Ultrasonic and radiography techniques hold significant market share, owing to their reliability and wide applicability.
- Leading Regions: North America and Europe.
- Dominant Segment (by type): Services (representing approximately 55% of the market in 2024)
- Dominant Segment (by technique): Ultrasonic testing (approximately 35% market share in 2024)
- Key Drivers: Stringent safety regulations, increasing exploration & production activities, growing focus on asset integrity management.
Non-Destructive Testing in Oil and Gas Industry Product Landscape
The NDT product landscape comprises a diverse range of equipment and services, encompassing portable and stationary systems, advanced imaging technologies, and specialized software for data analysis. Key innovations focus on improving image resolution, enhancing data analysis capabilities through AI, and developing more user-friendly interfaces. Products are differentiated based on their accuracy, portability, ease of use, and cost-effectiveness. The market sees a continuous stream of new equipment offering improved sensitivity and higher throughput.
Key Drivers, Barriers & Challenges in Non-Destructive Testing in Oil and Gas Industry
Key Drivers: Increased focus on asset integrity management to avoid costly downtime and environmental disasters; stringent safety and regulatory requirements; technological advancements, offering more efficient and accurate inspection methods; growth in exploration and production activities in emerging markets.
Challenges & Restraints: High initial investment costs associated with advanced NDT equipment; skilled labor shortages, creating a need for comprehensive training programs; fluctuating oil and gas prices impacting capital expenditure; complexities in integrating new technologies into existing workflows.
Emerging Opportunities in Non-Destructive Testing in Oil and Gas Industry
Opportunities abound in emerging markets with significant oil and gas reserves, but lacking robust NDT infrastructure. Furthermore, the integration of AI and machine learning in NDT data analysis presents opportunities to significantly improve inspection efficiency and accuracy. The development of environmentally friendly and sustainable NDT technologies represents a major growth area. The adoption of robotic and automated NDT solutions is also gaining momentum.
Growth Accelerators in the Non-Destructive Testing in Oil and Gas Industry Industry
Long-term growth in the NDT market will be driven by technological innovation, specifically focusing on the development of faster, more accurate, and more portable inspection equipment. Strategic alliances between equipment manufacturers and service providers are creating an increasingly integrated ecosystem. Expansion into new markets, particularly in developing regions, will provide significant growth opportunities.
Key Players Shaping the Non-Destructive Testing in Oil and Gas Industry Market
- Intertek Group PLC
- Zetec Inc
- Applus Services SA
- YXLON International GmbH (COMET Group)
- Fujifilm Corporation
- GE Measurement and Control (Baker Hughes)
- Karl Storz Ndtec GmbH
- Bureau Veritas SA
- Olympus Corporation
- Magnaflux Corp
- Magnetic Analysis Corporation
Notable Milestones in Non-Destructive Testing in Oil and Gas Industry Sector
- September 2022: Waygate Technologies introduced the Ruby|plate 240 calibration phantom for industrial computed tomography (CT), improving calibration accuracy and efficiency.
- October 2022: Videray Technologies Inc. launched PX Ultra, a handheld backscatter X-ray imager, enabling faster and more convenient inspections.
In-Depth Non-Destructive Testing in Oil and Gas Industry Market Outlook
The future of the NDT market in the oil and gas sector is bright, fueled by continuous technological advancements, stricter safety regulations, and increasing exploration activities globally. Strategic partnerships and investments in R&D will further enhance the capabilities of existing technologies and drive the adoption of innovative solutions. The market presents significant opportunities for companies that can deliver cost-effective, highly accurate, and user-friendly NDT solutions tailored to specific industry needs.
Non-Destructive Testing in Oil and Gas Industry Segmentation
-
1. Type
- 1.1. Equipment
- 1.2. Services
-
2. Type
- 2.1. Upstream
- 2.2. Midstream
- 2.3. Downstream
-
3. Technique
- 3.1. Ultrasonic
- 3.2. Radiography
- 3.3. Visual Inspection
- 3.4. Liquid Penetrant
- 3.5. Others (Magnetic Particle & Eddy Current)
Non-Destructive Testing in Oil and Gas Industry Segmentation By Geography
- 1. North America
- 2. Europe
- 3. Asia Pacific
- 4. Rest of the World
Non-Destructive Testing in Oil and Gas Industry Regional Market Share
Geographic Coverage of Non-Destructive Testing in Oil and Gas Industry
Non-Destructive Testing in Oil and Gas Industry REPORT HIGHLIGHTS
| Aspects | Details |
|---|---|
| Study Period | 2020-2034 |
| Base Year | 2025 |
| Estimated Year | 2026 |
| Forecast Period | 2026-2034 |
| Historical Period | 2020-2025 |
| Growth Rate | CAGR of 8.8% from 2020-2034 |
| Segmentation |
|
Table of Contents
- 1. Introduction
- 1.1. Research Scope
- 1.2. Market Segmentation
- 1.3. Research Objective
- 1.4. Definitions and Assumptions
- 2. Executive Summary
- 2.1. Market Snapshot
- 3. Market Dynamics
- 3.1. Market Drivers
- 3.2. Market Restrains
- 3.3. Market Trends
- 3.4. Market Opportunities
- 4. Market Factor Analysis
- 4.1. Porters Five Forces
- 4.1.1. Bargaining Power of Suppliers
- 4.1.2. Bargaining Power of Buyers
- 4.1.3. Threat of New Entrants
- 4.1.4. Threat of Substitutes
- 4.1.5. Competitive Rivalry
- 4.2. PESTEL analysis
- 4.3. BCG Analysis
- 4.3.1. Stars (High Growth, High Market Share)
- 4.3.2. Cash Cows (Low Growth, High Market Share)
- 4.3.3. Question Mark (High Growth, Low Market Share)
- 4.3.4. Dogs (Low Growth, Low Market Share)
- 4.4. Ansoff Matrix Analysis
- 4.5. Supply Chain Analysis
- 4.6. Regulatory Landscape
- 4.7. Current Market Potential and Opportunity Assessment (TAM–SAM–SOM Framework)
- 4.8. VDR Analyst Note
- 4.1. Porters Five Forces
- 5. Market Analysis, Insights and Forecast 2021-2033
- 5.1. Market Analysis, Insights and Forecast - by Type
- 5.1.1. Equipment
- 5.1.2. Services
- 5.2. Market Analysis, Insights and Forecast - by Type
- 5.2.1. Upstream
- 5.2.2. Midstream
- 5.2.3. Downstream
- 5.3. Market Analysis, Insights and Forecast - by Technique
- 5.3.1. Ultrasonic
- 5.3.2. Radiography
- 5.3.3. Visual Inspection
- 5.3.4. Liquid Penetrant
- 5.3.5. Others (Magnetic Particle & Eddy Current)
- 5.4. Market Analysis, Insights and Forecast - by Region
- 5.4.1. North America
- 5.4.2. Europe
- 5.4.3. Asia Pacific
- 5.4.4. Rest of the World
- 5.1. Market Analysis, Insights and Forecast - by Type
- 6. Global Non-Destructive Testing in Oil and Gas Industry Analysis, Insights and Forecast, 2021-2033
- 6.1. Market Analysis, Insights and Forecast - by Type
- 6.1.1. Equipment
- 6.1.2. Services
- 6.2. Market Analysis, Insights and Forecast - by Type
- 6.2.1. Upstream
- 6.2.2. Midstream
- 6.2.3. Downstream
- 6.3. Market Analysis, Insights and Forecast - by Technique
- 6.3.1. Ultrasonic
- 6.3.2. Radiography
- 6.3.3. Visual Inspection
- 6.3.4. Liquid Penetrant
- 6.3.5. Others (Magnetic Particle & Eddy Current)
- 6.1. Market Analysis, Insights and Forecast - by Type
- 7. North America Non-Destructive Testing in Oil and Gas Industry Analysis, Insights and Forecast, 2021-2033
- 7.1. Market Analysis, Insights and Forecast - by Type
- 7.1.1. Equipment
- 7.1.2. Services
- 7.2. Market Analysis, Insights and Forecast - by Type
- 7.2.1. Upstream
- 7.2.2. Midstream
- 7.2.3. Downstream
- 7.3. Market Analysis, Insights and Forecast - by Technique
- 7.3.1. Ultrasonic
- 7.3.2. Radiography
- 7.3.3. Visual Inspection
- 7.3.4. Liquid Penetrant
- 7.3.5. Others (Magnetic Particle & Eddy Current)
- 7.1. Market Analysis, Insights and Forecast - by Type
- 8. Europe Non-Destructive Testing in Oil and Gas Industry Analysis, Insights and Forecast, 2021-2033
- 8.1. Market Analysis, Insights and Forecast - by Type
- 8.1.1. Equipment
- 8.1.2. Services
- 8.2. Market Analysis, Insights and Forecast - by Type
- 8.2.1. Upstream
- 8.2.2. Midstream
- 8.2.3. Downstream
- 8.3. Market Analysis, Insights and Forecast - by Technique
- 8.3.1. Ultrasonic
- 8.3.2. Radiography
- 8.3.3. Visual Inspection
- 8.3.4. Liquid Penetrant
- 8.3.5. Others (Magnetic Particle & Eddy Current)
- 8.1. Market Analysis, Insights and Forecast - by Type
- 9. Asia Pacific Non-Destructive Testing in Oil and Gas Industry Analysis, Insights and Forecast, 2021-2033
- 9.1. Market Analysis, Insights and Forecast - by Type
- 9.1.1. Equipment
- 9.1.2. Services
- 9.2. Market Analysis, Insights and Forecast - by Type
- 9.2.1. Upstream
- 9.2.2. Midstream
- 9.2.3. Downstream
- 9.3. Market Analysis, Insights and Forecast - by Technique
- 9.3.1. Ultrasonic
- 9.3.2. Radiography
- 9.3.3. Visual Inspection
- 9.3.4. Liquid Penetrant
- 9.3.5. Others (Magnetic Particle & Eddy Current)
- 9.1. Market Analysis, Insights and Forecast - by Type
- 10. Rest of the World Non-Destructive Testing in Oil and Gas Industry Analysis, Insights and Forecast, 2021-2033
- 10.1. Market Analysis, Insights and Forecast - by Type
- 10.1.1. Equipment
- 10.1.2. Services
- 10.2. Market Analysis, Insights and Forecast - by Type
- 10.2.1. Upstream
- 10.2.2. Midstream
- 10.2.3. Downstream
- 10.3. Market Analysis, Insights and Forecast - by Technique
- 10.3.1. Ultrasonic
- 10.3.2. Radiography
- 10.3.3. Visual Inspection
- 10.3.4. Liquid Penetrant
- 10.3.5. Others (Magnetic Particle & Eddy Current)
- 10.1. Market Analysis, Insights and Forecast - by Type
- 11. Competitive Analysis
- 11.1. Company Profiles
- 11.1.1 Intertek Group PLC
- 11.1.1.1. Company Overview
- 11.1.1.2. Products
- 11.1.1.3. Company Financials
- 11.1.1.4. SWOT Analysis
- 11.1.2 Zetec In
- 11.1.2.1. Company Overview
- 11.1.2.2. Products
- 11.1.2.3. Company Financials
- 11.1.2.4. SWOT Analysis
- 11.1.3 Applus Services SA
- 11.1.3.1. Company Overview
- 11.1.3.2. Products
- 11.1.3.3. Company Financials
- 11.1.3.4. SWOT Analysis
- 11.1.4 YXLON International Gmbh (COMET Group)
- 11.1.4.1. Company Overview
- 11.1.4.2. Products
- 11.1.4.3. Company Financials
- 11.1.4.4. SWOT Analysis
- 11.1.5 Fujifilm Corporation
- 11.1.5.1. Company Overview
- 11.1.5.2. Products
- 11.1.5.3. Company Financials
- 11.1.5.4. SWOT Analysis
- 11.1.6 GE Measurement and Control (Baker Hughes)
- 11.1.6.1. Company Overview
- 11.1.6.2. Products
- 11.1.6.3. Company Financials
- 11.1.6.4. SWOT Analysis
- 11.1.7 Karl Storz Ndtec Gmbh
- 11.1.7.1. Company Overview
- 11.1.7.2. Products
- 11.1.7.3. Company Financials
- 11.1.7.4. SWOT Analysis
- 11.1.8 Bureau Veritas SA
- 11.1.8.1. Company Overview
- 11.1.8.2. Products
- 11.1.8.3. Company Financials
- 11.1.8.4. SWOT Analysis
- 11.1.9 Olympus Corporation
- 11.1.9.1. Company Overview
- 11.1.9.2. Products
- 11.1.9.3. Company Financials
- 11.1.9.4. SWOT Analysis
- 11.1.10 Magnaflux Corp
- 11.1.10.1. Company Overview
- 11.1.10.2. Products
- 11.1.10.3. Company Financials
- 11.1.10.4. SWOT Analysis
- 11.1.11 Magnetic Analysis Corporation
- 11.1.11.1. Company Overview
- 11.1.11.2. Products
- 11.1.11.3. Company Financials
- 11.1.11.4. SWOT Analysis
- 11.1.1 Intertek Group PLC
- 11.2. Market Entropy
- 11.2.1 Company's Key Areas Served
- 11.2.2 Recent Developments
- 11.3. Company Market Share Analysis 2025
- 11.3.1 Top 5 Companies Market Share Analysis
- 11.3.2 Top 3 Companies Market Share Analysis
- 11.4. List of Potential Customers
- 12. Research Methodology
List of Figures
- Figure 1: Global Non-Destructive Testing in Oil and Gas Industry Revenue Breakdown (billion, %) by Region 2025 & 2033
- Figure 2: North America Non-Destructive Testing in Oil and Gas Industry Revenue (billion), by Type 2025 & 2033
- Figure 3: North America Non-Destructive Testing in Oil and Gas Industry Revenue Share (%), by Type 2025 & 2033
- Figure 4: North America Non-Destructive Testing in Oil and Gas Industry Revenue (billion), by Type 2025 & 2033
- Figure 5: North America Non-Destructive Testing in Oil and Gas Industry Revenue Share (%), by Type 2025 & 2033
- Figure 6: North America Non-Destructive Testing in Oil and Gas Industry Revenue (billion), by Technique 2025 & 2033
- Figure 7: North America Non-Destructive Testing in Oil and Gas Industry Revenue Share (%), by Technique 2025 & 2033
- Figure 8: North America Non-Destructive Testing in Oil and Gas Industry Revenue (billion), by Country 2025 & 2033
- Figure 9: North America Non-Destructive Testing in Oil and Gas Industry Revenue Share (%), by Country 2025 & 2033
- Figure 10: Europe Non-Destructive Testing in Oil and Gas Industry Revenue (billion), by Type 2025 & 2033
- Figure 11: Europe Non-Destructive Testing in Oil and Gas Industry Revenue Share (%), by Type 2025 & 2033
- Figure 12: Europe Non-Destructive Testing in Oil and Gas Industry Revenue (billion), by Type 2025 & 2033
- Figure 13: Europe Non-Destructive Testing in Oil and Gas Industry Revenue Share (%), by Type 2025 & 2033
- Figure 14: Europe Non-Destructive Testing in Oil and Gas Industry Revenue (billion), by Technique 2025 & 2033
- Figure 15: Europe Non-Destructive Testing in Oil and Gas Industry Revenue Share (%), by Technique 2025 & 2033
- Figure 16: Europe Non-Destructive Testing in Oil and Gas Industry Revenue (billion), by Country 2025 & 2033
- Figure 17: Europe Non-Destructive Testing in Oil and Gas Industry Revenue Share (%), by Country 2025 & 2033
- Figure 18: Asia Pacific Non-Destructive Testing in Oil and Gas Industry Revenue (billion), by Type 2025 & 2033
- Figure 19: Asia Pacific Non-Destructive Testing in Oil and Gas Industry Revenue Share (%), by Type 2025 & 2033
- Figure 20: Asia Pacific Non-Destructive Testing in Oil and Gas Industry Revenue (billion), by Type 2025 & 2033
- Figure 21: Asia Pacific Non-Destructive Testing in Oil and Gas Industry Revenue Share (%), by Type 2025 & 2033
- Figure 22: Asia Pacific Non-Destructive Testing in Oil and Gas Industry Revenue (billion), by Technique 2025 & 2033
- Figure 23: Asia Pacific Non-Destructive Testing in Oil and Gas Industry Revenue Share (%), by Technique 2025 & 2033
- Figure 24: Asia Pacific Non-Destructive Testing in Oil and Gas Industry Revenue (billion), by Country 2025 & 2033
- Figure 25: Asia Pacific Non-Destructive Testing in Oil and Gas Industry Revenue Share (%), by Country 2025 & 2033
- Figure 26: Rest of the World Non-Destructive Testing in Oil and Gas Industry Revenue (billion), by Type 2025 & 2033
- Figure 27: Rest of the World Non-Destructive Testing in Oil and Gas Industry Revenue Share (%), by Type 2025 & 2033
- Figure 28: Rest of the World Non-Destructive Testing in Oil and Gas Industry Revenue (billion), by Type 2025 & 2033
- Figure 29: Rest of the World Non-Destructive Testing in Oil and Gas Industry Revenue Share (%), by Type 2025 & 2033
- Figure 30: Rest of the World Non-Destructive Testing in Oil and Gas Industry Revenue (billion), by Technique 2025 & 2033
- Figure 31: Rest of the World Non-Destructive Testing in Oil and Gas Industry Revenue Share (%), by Technique 2025 & 2033
- Figure 32: Rest of the World Non-Destructive Testing in Oil and Gas Industry Revenue (billion), by Country 2025 & 2033
- Figure 33: Rest of the World Non-Destructive Testing in Oil and Gas Industry Revenue Share (%), by Country 2025 & 2033
List of Tables
- Table 1: Global Non-Destructive Testing in Oil and Gas Industry Revenue billion Forecast, by Type 2020 & 2033
- Table 2: Global Non-Destructive Testing in Oil and Gas Industry Revenue billion Forecast, by Type 2020 & 2033
- Table 3: Global Non-Destructive Testing in Oil and Gas Industry Revenue billion Forecast, by Technique 2020 & 2033
- Table 4: Global Non-Destructive Testing in Oil and Gas Industry Revenue billion Forecast, by Region 2020 & 2033
- Table 5: Global Non-Destructive Testing in Oil and Gas Industry Revenue billion Forecast, by Type 2020 & 2033
- Table 6: Global Non-Destructive Testing in Oil and Gas Industry Revenue billion Forecast, by Type 2020 & 2033
- Table 7: Global Non-Destructive Testing in Oil and Gas Industry Revenue billion Forecast, by Technique 2020 & 2033
- Table 8: Global Non-Destructive Testing in Oil and Gas Industry Revenue billion Forecast, by Country 2020 & 2033
- Table 9: Global Non-Destructive Testing in Oil and Gas Industry Revenue billion Forecast, by Type 2020 & 2033
- Table 10: Global Non-Destructive Testing in Oil and Gas Industry Revenue billion Forecast, by Type 2020 & 2033
- Table 11: Global Non-Destructive Testing in Oil and Gas Industry Revenue billion Forecast, by Technique 2020 & 2033
- Table 12: Global Non-Destructive Testing in Oil and Gas Industry Revenue billion Forecast, by Country 2020 & 2033
- Table 13: Global Non-Destructive Testing in Oil and Gas Industry Revenue billion Forecast, by Type 2020 & 2033
- Table 14: Global Non-Destructive Testing in Oil and Gas Industry Revenue billion Forecast, by Type 2020 & 2033
- Table 15: Global Non-Destructive Testing in Oil and Gas Industry Revenue billion Forecast, by Technique 2020 & 2033
- Table 16: Global Non-Destructive Testing in Oil and Gas Industry Revenue billion Forecast, by Country 2020 & 2033
- Table 17: Global Non-Destructive Testing in Oil and Gas Industry Revenue billion Forecast, by Type 2020 & 2033
- Table 18: Global Non-Destructive Testing in Oil and Gas Industry Revenue billion Forecast, by Type 2020 & 2033
- Table 19: Global Non-Destructive Testing in Oil and Gas Industry Revenue billion Forecast, by Technique 2020 & 2033
- Table 20: Global Non-Destructive Testing in Oil and Gas Industry Revenue billion Forecast, by Country 2020 & 2033
Frequently Asked Questions
1. What is the projected Compound Annual Growth Rate (CAGR) of the Non-Destructive Testing in Oil and Gas Industry?
The projected CAGR is approximately 8.8%.
2. Which companies are prominent players in the Non-Destructive Testing in Oil and Gas Industry?
Key companies in the market include Intertek Group PLC, Zetec In, Applus Services SA, YXLON International Gmbh (COMET Group), Fujifilm Corporation, GE Measurement and Control (Baker Hughes), Karl Storz Ndtec Gmbh, Bureau Veritas SA, Olympus Corporation, Magnaflux Corp, Magnetic Analysis Corporation.
3. What are the main segments of the Non-Destructive Testing in Oil and Gas Industry?
The market segments include Type, Type, Technique.
4. Can you provide details about the market size?
The market size is estimated to be USD 4.06 billion as of 2022.
5. What are some drivers contributing to market growth?
Rising need to run refinery assets at full cap; Upstream sector expected to gain momentum in key markets.
6. What are the notable trends driving market growth?
The Rising Usage of Drones in the Market.
7. Are there any restraints impacting market growth?
; High Initial Cost During First Time Setup is Challenging the Market Growth.
8. Can you provide examples of recent developments in the market?
September 2022 : Waygate Technologies introduced the Ruby|plate 240 calibration phantom for industrial computed tomography (CT). Features high-resolution insights and captures extremely accurate and effective calibration bodies to determine the exact voxel size and allows operators to detect any deviation quickly and non-destructively in geometry.
9. What pricing options are available for accessing the report?
Pricing options include single-user, multi-user, and enterprise licenses priced at USD 4750, USD 5250, and USD 8750 respectively.
10. Is the market size provided in terms of value or volume?
The market size is provided in terms of value, measured in billion.
11. Are there any specific market keywords associated with the report?
Yes, the market keyword associated with the report is "Non-Destructive Testing in Oil and Gas Industry," which aids in identifying and referencing the specific market segment covered.
12. How do I determine which pricing option suits my needs best?
The pricing options vary based on user requirements and access needs. Individual users may opt for single-user licenses, while businesses requiring broader access may choose multi-user or enterprise licenses for cost-effective access to the report.
13. Are there any additional resources or data provided in the Non-Destructive Testing in Oil and Gas Industry report?
While the report offers comprehensive insights, it's advisable to review the specific contents or supplementary materials provided to ascertain if additional resources or data are available.
14. How can I stay updated on further developments or reports in the Non-Destructive Testing in Oil and Gas Industry?
To stay informed about further developments, trends, and reports in the Non-Destructive Testing in Oil and Gas Industry, consider subscribing to industry newsletters, following relevant companies and organizations, or regularly checking reputable industry news sources and publications.
Methodology
Step 1 - Identification of Relevant Samples Size from Population Database


Step 2 - Approaches for Defining Global Market Size (Value, Volume* & Price*)

Note*: In applicable scenarios
Step 3 - Data Sources
Primary Research
- Web Analytics
- Survey Reports
- Research Institute
- Latest Research Reports
- Opinion Leaders
Secondary Research
- Annual Reports
- White Paper
- Latest Press Release
- Industry Association
- Paid Database
- Investor Presentations

Step 4 - Data Triangulation
Involves using different sources of information in order to increase the validity of a study
These sources are likely to be stakeholders in a program - participants, other researchers, program staff, other community members, and so on.
Then we put all data in single framework & apply various statistical tools to find out the dynamic on the market.
During the analysis stage, feedback from the stakeholder groups would be compared to determine areas of agreement as well as areas of divergence