
Key Insights
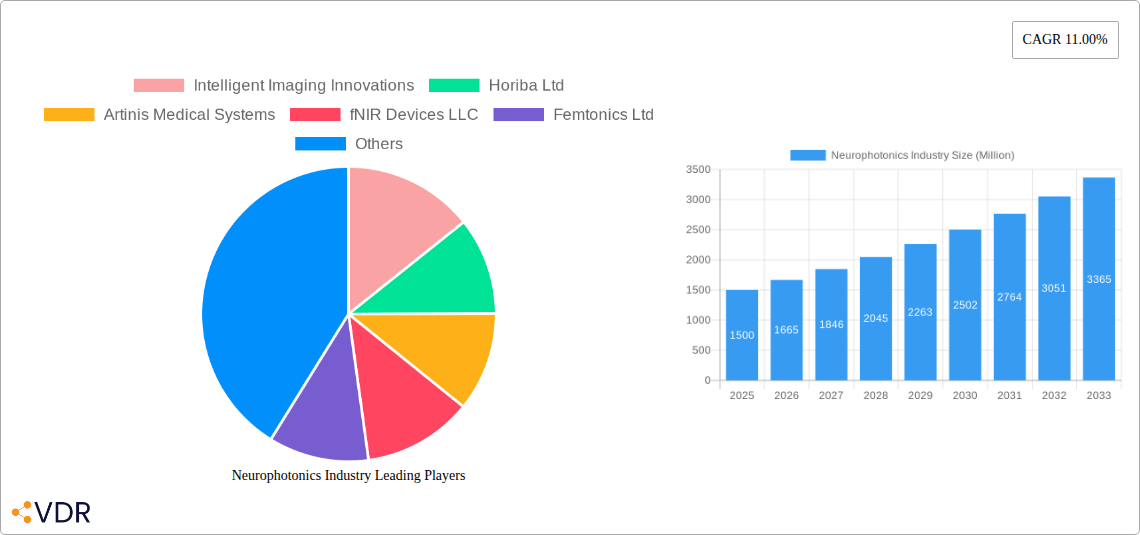
The neurophotonics market, valued at approximately $1.5 billion in 2025, is experiencing robust growth, projected to reach over $4 billion by 2033, driven by a compound annual growth rate (CAGR) of 11%. This expansion is fueled by several key factors. Firstly, the increasing prevalence of neurological disorders, such as Alzheimer's disease, Parkinson's disease, and traumatic brain injuries, is creating a significant demand for advanced diagnostic and therapeutic tools. Neurophotonics offers non-invasive, high-resolution imaging techniques, enabling earlier and more accurate diagnosis, leading to improved treatment outcomes. Secondly, technological advancements in optical imaging and spectroscopy are continuously enhancing the sensitivity, resolution, and speed of neurophotonics devices. Miniaturization and improved portability are making these technologies more accessible for clinical applications, particularly in point-of-care diagnostics. The development of multimodal imaging systems, integrating various optical techniques, is further driving market growth by providing more comprehensive neurological data. Finally, significant investments in research and development by both public and private entities are fostering innovation and accelerating the commercialization of novel neurophotonics technologies. This includes the development of novel contrast agents, improved data analysis algorithms, and integration with artificial intelligence for faster and more accurate image interpretation.
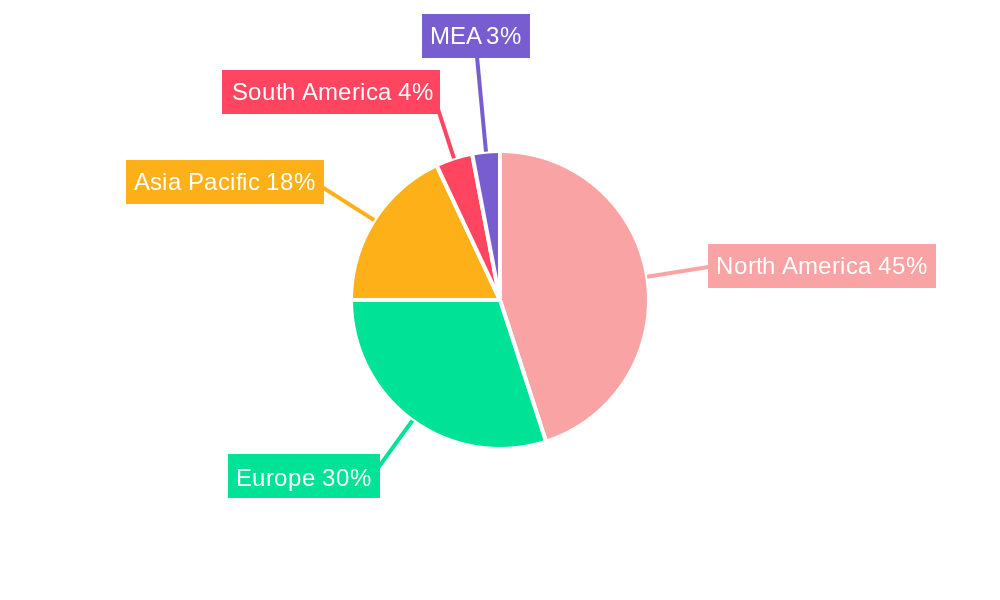
The market segmentation reveals a strong focus on research applications, reflecting the substantial ongoing efforts to understand brain function and disease mechanisms. However, the diagnostics and therapeutics segments are expected to witness the fastest growth in the coming years. North America currently holds a dominant market share, owing to a strong research infrastructure, high healthcare expenditure, and early adoption of advanced medical technologies. However, the Asia Pacific region is anticipated to exhibit significant growth potential, driven by rising healthcare awareness, increasing disposable incomes, and a growing geriatric population. Competitive forces within the industry are shaping the market landscape, with established players like Carl Zeiss AG and Leica Microsystems alongside innovative startups like Intelligent Imaging Innovations driving technological innovation and expanding market access. The main restraints to the market growth includes the high cost of equipment and procedures, regulatory hurdles related to approval and reimbursement policies, and the need for specialized expertise to operate and interpret the complex data generated.
Neurophotonics Industry Market Report: 2019-2033
This comprehensive report provides an in-depth analysis of the Neurophotonics Industry, encompassing market dynamics, growth trends, competitive landscape, and future outlook. The study period covers 2019-2033, with a base year of 2025 and a forecast period of 2025-2033. The report segments the market by system type (Microscopy, Spectroscopy, Multimodal, Other) and application (Research, Diagnostics, Therapeutics), offering granular insights into key market drivers and challenges. The total market size in 2025 is estimated at xx Million.
Neurophotonics Industry Market Dynamics & Structure
The Neurophotonics market, valued at xx Million in 2025, is characterized by moderate concentration, with a few dominant players and several smaller, specialized firms. Technological innovation, particularly in advanced imaging and sensing technologies, is a key driver, alongside increasing research funding for neurological disorders. Regulatory frameworks, especially those governing medical devices, significantly impact market growth. Competitive pressures stem from the emergence of substitute technologies and the entry of new players. M&A activity in the sector has been moderate, with xx deals recorded between 2019 and 2024. End-user demographics are primarily driven by research institutions, hospitals, and pharmaceutical companies.
- Market Concentration: Moderately concentrated, with top 5 players holding approximately xx% market share in 2025.
- Technological Innovation: Significant advancements in microscopy, spectroscopy, and multimodal imaging are driving market expansion.
- Regulatory Landscape: Stringent regulatory approvals for medical devices pose a significant barrier to entry and market penetration.
- Competitive Substitutes: Alternative neuroimaging techniques (e.g., fMRI, EEG) pose competitive pressure.
- M&A Activity: xx M&A deals between 2019 and 2024, indicating a moderate level of consolidation.
- End-User Demographics: Primarily research institutions (xx%), hospitals (xx%), and pharmaceutical companies (xx%).
Neurophotonics Industry Growth Trends & Insights
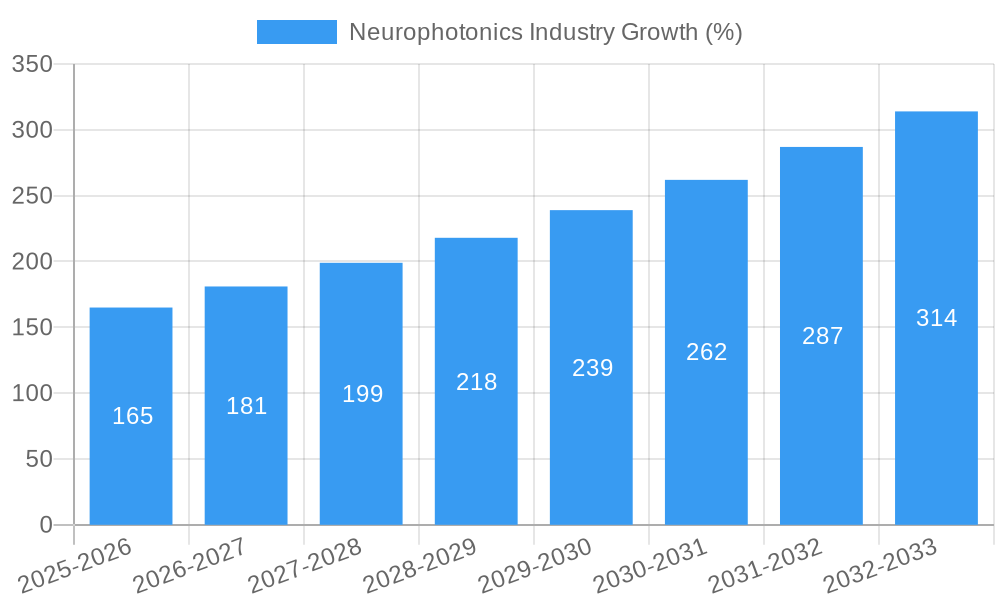
The Neurophotonics market has witnessed significant growth over the past few years, driven by factors such as the rising prevalence of neurological disorders, increased research funding, and technological advancements. The market size experienced a CAGR of xx% during the historical period (2019-2024) and is projected to grow at a CAGR of xx% during the forecast period (2025-2033), reaching xx Million by 2033. This growth is fueled by the increasing adoption of advanced neurophotonics technologies in research and clinical settings, coupled with a growing understanding of their potential for diagnostics and therapeutics. Market penetration is currently highest in research applications but is steadily increasing in diagnostics and therapeutics as technology matures and regulatory approvals are obtained. Technological disruptions, such as the development of miniaturized and portable devices, are further accelerating market expansion.
Dominant Regions, Countries, or Segments in Neurophotonics Industry
North America currently dominates the Neurophotonics market, holding approximately xx% market share in 2025, followed by Europe at xx% and Asia-Pacific at xx%. This dominance is primarily attributed to robust research infrastructure, high healthcare expenditure, and a significant number of key players based in these regions. Within system types, Microscopy holds the largest share at xx%, followed by Spectroscopy at xx%. Research applications currently dominate the market, accounting for approximately xx% of total revenue, owing to substantial government funding and the pursuit of fundamental discoveries.
- North America: Strong research base, high healthcare expenditure, presence of major players.
- Europe: Well-established healthcare infrastructure, significant government funding for research.
- Asia-Pacific: Growing healthcare sector, increasing research investments, rising prevalence of neurological disorders.
- Microscopy: High demand for high-resolution imaging in research and diagnostics.
- Spectroscopy: Increasing applications in functional neuroimaging and disease monitoring.
- Research Applications: Largest segment due to high research funding and scientific advancements.
Neurophotonics Industry Product Landscape
The Neurophotonics product landscape encompasses a wide range of advanced imaging and sensing systems, including high-resolution microscopes, sophisticated spectrometers, and multimodal imaging platforms. These systems offer improved sensitivity, resolution, and speed compared to traditional neuroimaging methods. Key features include advanced data processing algorithms, miniaturization for improved accessibility, and integration with other imaging modalities. Recent innovations focus on enhancing portability, lowering costs, and improving user-friendliness.
Key Drivers, Barriers & Challenges in Neurophotonics Industry
Key Drivers: The rising prevalence of neurological disorders, increasing R&D investments, technological advancements in imaging and sensing technologies, and growing demand for minimally invasive diagnostic and therapeutic tools are the key drivers of market growth. Government funding initiatives focused on neuroscience research further fuel this market.
Challenges: High initial investment costs, complex regulatory pathways for medical device approvals, the emergence of competitive technologies (e.g., fMRI, EEG), and a skilled workforce shortage are significant challenges hindering wider adoption.
Emerging Opportunities in Neurophotonics Industry
Emerging opportunities lie in the development of portable and wearable neurophotonics devices, advanced data analytics tools for improved image interpretation, and the integration of neurophotonics with other therapeutic modalities. The expansion into untapped markets, such as home healthcare and point-of-care diagnostics, presents further growth potential.
Growth Accelerators in the Neurophotonics Industry
Strategic partnerships between technology providers and healthcare institutions, coupled with ongoing technological advancements in miniaturization, AI-driven data analysis, and improved user-friendliness, are key catalysts for long-term market growth. Expanding applications in personalized medicine and early disease detection also promise significant growth.
Key Players Shaping the Neurophotonics Industry Market
- Intelligent Imaging Innovations
- Horiba Ltd
- Artinis Medical Systems
- fNIR Devices LLC
- Femtonics Ltd
- Cairn Research
- Hitachi Ltd
- Carl Zeiss AG
- Leica Microsystems
- HemoPhotonics
Notable Milestones in Neurophotonics Industry Sector
- 2020: FDA approval of a novel neurophotonics-based diagnostic device for Alzheimer's disease.
- 2022: Launch of a miniaturized, wearable neuroimaging system for remote patient monitoring.
- 2023: Strategic partnership between a major pharmaceutical company and a neurophotonics technology provider to develop novel therapeutics.
In-Depth Neurophotonics Industry Market Outlook
The Neurophotonics market is poised for significant growth driven by continued technological innovation, increasing healthcare spending, and a growing need for advanced neuroimaging tools. The focus on developing cost-effective, user-friendly, and portable devices will further drive market expansion. Strategic collaborations and the development of novel applications in personalized medicine and early disease detection will shape the future of this dynamic sector.
Neurophotonics Industry Segmentation
-
1. System Type
- 1.1. Microscopy
- 1.2. Spectroscopy
- 1.3. Multimodal
- 1.4. Other System Type
-
2. Application
- 2.1. Research
- 2.2. Diagnostics
- 2.3. Therapeutics
Neurophotonics Industry Segmentation By Geography
- 1. North America
- 2. Europe
- 3. Asia Pacific
- 4. Rest of World
Neurophotonics Industry REPORT HIGHLIGHTS
| Aspects | Details |
|---|---|
| Study Period | 2019-2033 |
| Base Year | 2024 |
| Estimated Year | 2025 |
| Forecast Period | 2025-2033 |
| Historical Period | 2019-2024 |
| Growth Rate | CAGR of 11.00% from 2019-2033 |
| Segmentation |
|
Table of Contents
- 1. Introduction
- 1.1. Research Scope
- 1.2. Market Segmentation
- 1.3. Research Methodology
- 1.4. Definitions and Assumptions
- 2. Executive Summary
- 2.1. Introduction
- 3. Market Dynamics
- 3.1. Introduction
- 3.2. Market Drivers
- 3.2.1. ; Increasing Government Initiative for Research and Development; Technological Advancement in Pain Detection Technology
- 3.3. Market Restrains
- 3.3.1. ; Accessing the Human Brain in Live Individuals is Difficult
- 3.4. Market Trends
- 3.4.1. Increasing Research Activities Offers Potential Growth
- 4. Market Factor Analysis
- 4.1. Porters Five Forces
- 4.2. Supply/Value Chain
- 4.3. PESTEL analysis
- 4.4. Market Entropy
- 4.5. Patent/Trademark Analysis
- 5. Global Neurophotonics Industry Analysis, Insights and Forecast, 2019-2031
- 5.1. Market Analysis, Insights and Forecast - by System Type
- 5.1.1. Microscopy
- 5.1.2. Spectroscopy
- 5.1.3. Multimodal
- 5.1.4. Other System Type
- 5.2. Market Analysis, Insights and Forecast - by Application
- 5.2.1. Research
- 5.2.2. Diagnostics
- 5.2.3. Therapeutics
- 5.3. Market Analysis, Insights and Forecast - by Region
- 5.3.1. North America
- 5.3.2. Europe
- 5.3.3. Asia Pacific
- 5.3.4. Rest of World
- 5.1. Market Analysis, Insights and Forecast - by System Type
- 6. North America Neurophotonics Industry Analysis, Insights and Forecast, 2019-2031
- 6.1. Market Analysis, Insights and Forecast - by System Type
- 6.1.1. Microscopy
- 6.1.2. Spectroscopy
- 6.1.3. Multimodal
- 6.1.4. Other System Type
- 6.2. Market Analysis, Insights and Forecast - by Application
- 6.2.1. Research
- 6.2.2. Diagnostics
- 6.2.3. Therapeutics
- 6.1. Market Analysis, Insights and Forecast - by System Type
- 7. Europe Neurophotonics Industry Analysis, Insights and Forecast, 2019-2031
- 7.1. Market Analysis, Insights and Forecast - by System Type
- 7.1.1. Microscopy
- 7.1.2. Spectroscopy
- 7.1.3. Multimodal
- 7.1.4. Other System Type
- 7.2. Market Analysis, Insights and Forecast - by Application
- 7.2.1. Research
- 7.2.2. Diagnostics
- 7.2.3. Therapeutics
- 7.1. Market Analysis, Insights and Forecast - by System Type
- 8. Asia Pacific Neurophotonics Industry Analysis, Insights and Forecast, 2019-2031
- 8.1. Market Analysis, Insights and Forecast - by System Type
- 8.1.1. Microscopy
- 8.1.2. Spectroscopy
- 8.1.3. Multimodal
- 8.1.4. Other System Type
- 8.2. Market Analysis, Insights and Forecast - by Application
- 8.2.1. Research
- 8.2.2. Diagnostics
- 8.2.3. Therapeutics
- 8.1. Market Analysis, Insights and Forecast - by System Type
- 9. Rest of World Neurophotonics Industry Analysis, Insights and Forecast, 2019-2031
- 9.1. Market Analysis, Insights and Forecast - by System Type
- 9.1.1. Microscopy
- 9.1.2. Spectroscopy
- 9.1.3. Multimodal
- 9.1.4. Other System Type
- 9.2. Market Analysis, Insights and Forecast - by Application
- 9.2.1. Research
- 9.2.2. Diagnostics
- 9.2.3. Therapeutics
- 9.1. Market Analysis, Insights and Forecast - by System Type
- 10. North America Neurophotonics Industry Analysis, Insights and Forecast, 2019-2031
- 10.1. Market Analysis, Insights and Forecast - By Country/Sub-region
- 10.1.1. undefined
- 11. Europe Neurophotonics Industry Analysis, Insights and Forecast, 2019-2031
- 11.1. Market Analysis, Insights and Forecast - By Country/Sub-region
- 11.1.1. undefined
- 12. Asia Pacific Neurophotonics Industry Analysis, Insights and Forecast, 2019-2031
- 12.1. Market Analysis, Insights and Forecast - By Country/Sub-region
- 12.1.1. undefined
- 13. South America Neurophotonics Industry Analysis, Insights and Forecast, 2019-2031
- 13.1. Market Analysis, Insights and Forecast - By Country/Sub-region
- 13.1.1. undefined
- 14. North America Neurophotonics Industry Analysis, Insights and Forecast, 2019-2031
- 14.1. Market Analysis, Insights and Forecast - By Country/Sub-region
- 14.1.1. undefined
- 15. MEA Neurophotonics Industry Analysis, Insights and Forecast, 2019-2031
- 15.1. Market Analysis, Insights and Forecast - By Country/Sub-region
- 15.1.1. undefined
- 16. Competitive Analysis
- 16.1. Global Market Share Analysis 2024
- 16.2. Company Profiles
- 16.2.1 Intelligent Imaging Innovations
- 16.2.1.1. Overview
- 16.2.1.2. Products
- 16.2.1.3. SWOT Analysis
- 16.2.1.4. Recent Developments
- 16.2.1.5. Financials (Based on Availability)
- 16.2.2 Horiba Ltd
- 16.2.2.1. Overview
- 16.2.2.2. Products
- 16.2.2.3. SWOT Analysis
- 16.2.2.4. Recent Developments
- 16.2.2.5. Financials (Based on Availability)
- 16.2.3 Artinis Medical Systems
- 16.2.3.1. Overview
- 16.2.3.2. Products
- 16.2.3.3. SWOT Analysis
- 16.2.3.4. Recent Developments
- 16.2.3.5. Financials (Based on Availability)
- 16.2.4 fNIR Devices LLC
- 16.2.4.1. Overview
- 16.2.4.2. Products
- 16.2.4.3. SWOT Analysis
- 16.2.4.4. Recent Developments
- 16.2.4.5. Financials (Based on Availability)
- 16.2.5 Femtonics Ltd
- 16.2.5.1. Overview
- 16.2.5.2. Products
- 16.2.5.3. SWOT Analysis
- 16.2.5.4. Recent Developments
- 16.2.5.5. Financials (Based on Availability)
- 16.2.6 Cairn Research
- 16.2.6.1. Overview
- 16.2.6.2. Products
- 16.2.6.3. SWOT Analysis
- 16.2.6.4. Recent Developments
- 16.2.6.5. Financials (Based on Availability)
- 16.2.7 Hitachi Ltd
- 16.2.7.1. Overview
- 16.2.7.2. Products
- 16.2.7.3. SWOT Analysis
- 16.2.7.4. Recent Developments
- 16.2.7.5. Financials (Based on Availability)
- 16.2.8 Carl Zeiss AG
- 16.2.8.1. Overview
- 16.2.8.2. Products
- 16.2.8.3. SWOT Analysis
- 16.2.8.4. Recent Developments
- 16.2.8.5. Financials (Based on Availability)
- 16.2.9 Leica Microsystems
- 16.2.9.1. Overview
- 16.2.9.2. Products
- 16.2.9.3. SWOT Analysis
- 16.2.9.4. Recent Developments
- 16.2.9.5. Financials (Based on Availability)
- 16.2.10 HemoPhotonics
- 16.2.10.1. Overview
- 16.2.10.2. Products
- 16.2.10.3. SWOT Analysis
- 16.2.10.4. Recent Developments
- 16.2.10.5. Financials (Based on Availability)
- 16.2.1 Intelligent Imaging Innovations
List of Figures
- Figure 1: Global Neurophotonics Industry Revenue Breakdown (Million, %) by Region 2024 & 2032
- Figure 2: Global Neurophotonics Industry Volume Breakdown (K Unit, %) by Region 2024 & 2032
- Figure 3: North America Neurophotonics Industry Revenue (Million), by Country 2024 & 2032
- Figure 4: North America Neurophotonics Industry Volume (K Unit), by Country 2024 & 2032
- Figure 5: North America Neurophotonics Industry Revenue Share (%), by Country 2024 & 2032
- Figure 6: North America Neurophotonics Industry Volume Share (%), by Country 2024 & 2032
- Figure 7: Europe Neurophotonics Industry Revenue (Million), by Country 2024 & 2032
- Figure 8: Europe Neurophotonics Industry Volume (K Unit), by Country 2024 & 2032
- Figure 9: Europe Neurophotonics Industry Revenue Share (%), by Country 2024 & 2032
- Figure 10: Europe Neurophotonics Industry Volume Share (%), by Country 2024 & 2032
- Figure 11: Asia Pacific Neurophotonics Industry Revenue (Million), by Country 2024 & 2032
- Figure 12: Asia Pacific Neurophotonics Industry Volume (K Unit), by Country 2024 & 2032
- Figure 13: Asia Pacific Neurophotonics Industry Revenue Share (%), by Country 2024 & 2032
- Figure 14: Asia Pacific Neurophotonics Industry Volume Share (%), by Country 2024 & 2032
- Figure 15: South America Neurophotonics Industry Revenue (Million), by Country 2024 & 2032
- Figure 16: South America Neurophotonics Industry Volume (K Unit), by Country 2024 & 2032
- Figure 17: South America Neurophotonics Industry Revenue Share (%), by Country 2024 & 2032
- Figure 18: South America Neurophotonics Industry Volume Share (%), by Country 2024 & 2032
- Figure 19: North America Neurophotonics Industry Revenue (Million), by Country 2024 & 2032
- Figure 20: North America Neurophotonics Industry Volume (K Unit), by Country 2024 & 2032
- Figure 21: North America Neurophotonics Industry Revenue Share (%), by Country 2024 & 2032
- Figure 22: North America Neurophotonics Industry Volume Share (%), by Country 2024 & 2032
- Figure 23: MEA Neurophotonics Industry Revenue (Million), by Country 2024 & 2032
- Figure 24: MEA Neurophotonics Industry Volume (K Unit), by Country 2024 & 2032
- Figure 25: MEA Neurophotonics Industry Revenue Share (%), by Country 2024 & 2032
- Figure 26: MEA Neurophotonics Industry Volume Share (%), by Country 2024 & 2032
- Figure 27: North America Neurophotonics Industry Revenue (Million), by System Type 2024 & 2032
- Figure 28: North America Neurophotonics Industry Volume (K Unit), by System Type 2024 & 2032
- Figure 29: North America Neurophotonics Industry Revenue Share (%), by System Type 2024 & 2032
- Figure 30: North America Neurophotonics Industry Volume Share (%), by System Type 2024 & 2032
- Figure 31: North America Neurophotonics Industry Revenue (Million), by Application 2024 & 2032
- Figure 32: North America Neurophotonics Industry Volume (K Unit), by Application 2024 & 2032
- Figure 33: North America Neurophotonics Industry Revenue Share (%), by Application 2024 & 2032
- Figure 34: North America Neurophotonics Industry Volume Share (%), by Application 2024 & 2032
- Figure 35: North America Neurophotonics Industry Revenue (Million), by Country 2024 & 2032
- Figure 36: North America Neurophotonics Industry Volume (K Unit), by Country 2024 & 2032
- Figure 37: North America Neurophotonics Industry Revenue Share (%), by Country 2024 & 2032
- Figure 38: North America Neurophotonics Industry Volume Share (%), by Country 2024 & 2032
- Figure 39: Europe Neurophotonics Industry Revenue (Million), by System Type 2024 & 2032
- Figure 40: Europe Neurophotonics Industry Volume (K Unit), by System Type 2024 & 2032
- Figure 41: Europe Neurophotonics Industry Revenue Share (%), by System Type 2024 & 2032
- Figure 42: Europe Neurophotonics Industry Volume Share (%), by System Type 2024 & 2032
- Figure 43: Europe Neurophotonics Industry Revenue (Million), by Application 2024 & 2032
- Figure 44: Europe Neurophotonics Industry Volume (K Unit), by Application 2024 & 2032
- Figure 45: Europe Neurophotonics Industry Revenue Share (%), by Application 2024 & 2032
- Figure 46: Europe Neurophotonics Industry Volume Share (%), by Application 2024 & 2032
- Figure 47: Europe Neurophotonics Industry Revenue (Million), by Country 2024 & 2032
- Figure 48: Europe Neurophotonics Industry Volume (K Unit), by Country 2024 & 2032
- Figure 49: Europe Neurophotonics Industry Revenue Share (%), by Country 2024 & 2032
- Figure 50: Europe Neurophotonics Industry Volume Share (%), by Country 2024 & 2032
- Figure 51: Asia Pacific Neurophotonics Industry Revenue (Million), by System Type 2024 & 2032
- Figure 52: Asia Pacific Neurophotonics Industry Volume (K Unit), by System Type 2024 & 2032
- Figure 53: Asia Pacific Neurophotonics Industry Revenue Share (%), by System Type 2024 & 2032
- Figure 54: Asia Pacific Neurophotonics Industry Volume Share (%), by System Type 2024 & 2032
- Figure 55: Asia Pacific Neurophotonics Industry Revenue (Million), by Application 2024 & 2032
- Figure 56: Asia Pacific Neurophotonics Industry Volume (K Unit), by Application 2024 & 2032
- Figure 57: Asia Pacific Neurophotonics Industry Revenue Share (%), by Application 2024 & 2032
- Figure 58: Asia Pacific Neurophotonics Industry Volume Share (%), by Application 2024 & 2032
- Figure 59: Asia Pacific Neurophotonics Industry Revenue (Million), by Country 2024 & 2032
- Figure 60: Asia Pacific Neurophotonics Industry Volume (K Unit), by Country 2024 & 2032
- Figure 61: Asia Pacific Neurophotonics Industry Revenue Share (%), by Country 2024 & 2032
- Figure 62: Asia Pacific Neurophotonics Industry Volume Share (%), by Country 2024 & 2032
- Figure 63: Rest of World Neurophotonics Industry Revenue (Million), by System Type 2024 & 2032
- Figure 64: Rest of World Neurophotonics Industry Volume (K Unit), by System Type 2024 & 2032
- Figure 65: Rest of World Neurophotonics Industry Revenue Share (%), by System Type 2024 & 2032
- Figure 66: Rest of World Neurophotonics Industry Volume Share (%), by System Type 2024 & 2032
- Figure 67: Rest of World Neurophotonics Industry Revenue (Million), by Application 2024 & 2032
- Figure 68: Rest of World Neurophotonics Industry Volume (K Unit), by Application 2024 & 2032
- Figure 69: Rest of World Neurophotonics Industry Revenue Share (%), by Application 2024 & 2032
- Figure 70: Rest of World Neurophotonics Industry Volume Share (%), by Application 2024 & 2032
- Figure 71: Rest of World Neurophotonics Industry Revenue (Million), by Country 2024 & 2032
- Figure 72: Rest of World Neurophotonics Industry Volume (K Unit), by Country 2024 & 2032
- Figure 73: Rest of World Neurophotonics Industry Revenue Share (%), by Country 2024 & 2032
- Figure 74: Rest of World Neurophotonics Industry Volume Share (%), by Country 2024 & 2032
List of Tables
- Table 1: Global Neurophotonics Industry Revenue Million Forecast, by Region 2019 & 2032
- Table 2: Global Neurophotonics Industry Volume K Unit Forecast, by Region 2019 & 2032
- Table 3: Global Neurophotonics Industry Revenue Million Forecast, by System Type 2019 & 2032
- Table 4: Global Neurophotonics Industry Volume K Unit Forecast, by System Type 2019 & 2032
- Table 5: Global Neurophotonics Industry Revenue Million Forecast, by Application 2019 & 2032
- Table 6: Global Neurophotonics Industry Volume K Unit Forecast, by Application 2019 & 2032
- Table 7: Global Neurophotonics Industry Revenue Million Forecast, by Region 2019 & 2032
- Table 8: Global Neurophotonics Industry Volume K Unit Forecast, by Region 2019 & 2032
- Table 9: Global Neurophotonics Industry Revenue Million Forecast, by Country 2019 & 2032
- Table 10: Global Neurophotonics Industry Volume K Unit Forecast, by Country 2019 & 2032
- Table 11: Global Neurophotonics Industry Revenue Million Forecast, by Country 2019 & 2032
- Table 12: Global Neurophotonics Industry Volume K Unit Forecast, by Country 2019 & 2032
- Table 13: Global Neurophotonics Industry Revenue Million Forecast, by Country 2019 & 2032
- Table 14: Global Neurophotonics Industry Volume K Unit Forecast, by Country 2019 & 2032
- Table 15: Global Neurophotonics Industry Revenue Million Forecast, by Country 2019 & 2032
- Table 16: Global Neurophotonics Industry Volume K Unit Forecast, by Country 2019 & 2032
- Table 17: Global Neurophotonics Industry Revenue Million Forecast, by Country 2019 & 2032
- Table 18: Global Neurophotonics Industry Volume K Unit Forecast, by Country 2019 & 2032
- Table 19: Global Neurophotonics Industry Revenue Million Forecast, by Country 2019 & 2032
- Table 20: Global Neurophotonics Industry Volume K Unit Forecast, by Country 2019 & 2032
- Table 21: Global Neurophotonics Industry Revenue Million Forecast, by System Type 2019 & 2032
- Table 22: Global Neurophotonics Industry Volume K Unit Forecast, by System Type 2019 & 2032
- Table 23: Global Neurophotonics Industry Revenue Million Forecast, by Application 2019 & 2032
- Table 24: Global Neurophotonics Industry Volume K Unit Forecast, by Application 2019 & 2032
- Table 25: Global Neurophotonics Industry Revenue Million Forecast, by Country 2019 & 2032
- Table 26: Global Neurophotonics Industry Volume K Unit Forecast, by Country 2019 & 2032
- Table 27: Global Neurophotonics Industry Revenue Million Forecast, by System Type 2019 & 2032
- Table 28: Global Neurophotonics Industry Volume K Unit Forecast, by System Type 2019 & 2032
- Table 29: Global Neurophotonics Industry Revenue Million Forecast, by Application 2019 & 2032
- Table 30: Global Neurophotonics Industry Volume K Unit Forecast, by Application 2019 & 2032
- Table 31: Global Neurophotonics Industry Revenue Million Forecast, by Country 2019 & 2032
- Table 32: Global Neurophotonics Industry Volume K Unit Forecast, by Country 2019 & 2032
- Table 33: Global Neurophotonics Industry Revenue Million Forecast, by System Type 2019 & 2032
- Table 34: Global Neurophotonics Industry Volume K Unit Forecast, by System Type 2019 & 2032
- Table 35: Global Neurophotonics Industry Revenue Million Forecast, by Application 2019 & 2032
- Table 36: Global Neurophotonics Industry Volume K Unit Forecast, by Application 2019 & 2032
- Table 37: Global Neurophotonics Industry Revenue Million Forecast, by Country 2019 & 2032
- Table 38: Global Neurophotonics Industry Volume K Unit Forecast, by Country 2019 & 2032
- Table 39: Global Neurophotonics Industry Revenue Million Forecast, by System Type 2019 & 2032
- Table 40: Global Neurophotonics Industry Volume K Unit Forecast, by System Type 2019 & 2032
- Table 41: Global Neurophotonics Industry Revenue Million Forecast, by Application 2019 & 2032
- Table 42: Global Neurophotonics Industry Volume K Unit Forecast, by Application 2019 & 2032
- Table 43: Global Neurophotonics Industry Revenue Million Forecast, by Country 2019 & 2032
- Table 44: Global Neurophotonics Industry Volume K Unit Forecast, by Country 2019 & 2032
Frequently Asked Questions
1. What is the projected Compound Annual Growth Rate (CAGR) of the Neurophotonics Industry?
The projected CAGR is approximately 11.00%.
2. Which companies are prominent players in the Neurophotonics Industry?
Key companies in the market include Intelligent Imaging Innovations, Horiba Ltd, Artinis Medical Systems, fNIR Devices LLC, Femtonics Ltd, Cairn Research, Hitachi Ltd , Carl Zeiss AG, Leica Microsystems, HemoPhotonics.
3. What are the main segments of the Neurophotonics Industry?
The market segments include System Type, Application.
4. Can you provide details about the market size?
The market size is estimated to be USD XX Million as of 2022.
5. What are some drivers contributing to market growth?
; Increasing Government Initiative for Research and Development; Technological Advancement in Pain Detection Technology.
6. What are the notable trends driving market growth?
Increasing Research Activities Offers Potential Growth.
7. Are there any restraints impacting market growth?
; Accessing the Human Brain in Live Individuals is Difficult.
8. Can you provide examples of recent developments in the market?
N/A
9. What pricing options are available for accessing the report?
Pricing options include single-user, multi-user, and enterprise licenses priced at USD 4750, USD 5250, and USD 8750 respectively.
10. Is the market size provided in terms of value or volume?
The market size is provided in terms of value, measured in Million and volume, measured in K Unit.
11. Are there any specific market keywords associated with the report?
Yes, the market keyword associated with the report is "Neurophotonics Industry," which aids in identifying and referencing the specific market segment covered.
12. How do I determine which pricing option suits my needs best?
The pricing options vary based on user requirements and access needs. Individual users may opt for single-user licenses, while businesses requiring broader access may choose multi-user or enterprise licenses for cost-effective access to the report.
13. Are there any additional resources or data provided in the Neurophotonics Industry report?
While the report offers comprehensive insights, it's advisable to review the specific contents or supplementary materials provided to ascertain if additional resources or data are available.
14. How can I stay updated on further developments or reports in the Neurophotonics Industry?
To stay informed about further developments, trends, and reports in the Neurophotonics Industry, consider subscribing to industry newsletters, following relevant companies and organizations, or regularly checking reputable industry news sources and publications.
Methodology
Step 1 - Identification of Relevant Samples Size from Population Database


Step 2 - Approaches for Defining Global Market Size (Value, Volume* & Price*)

Note*: In applicable scenarios
Step 3 - Data Sources
Primary Research
- Web Analytics
- Survey Reports
- Research Institute
- Latest Research Reports
- Opinion Leaders
Secondary Research
- Annual Reports
- White Paper
- Latest Press Release
- Industry Association
- Paid Database
- Investor Presentations

Step 4 - Data Triangulation
Involves using different sources of information in order to increase the validity of a study
These sources are likely to be stakeholders in a program - participants, other researchers, program staff, other community members, and so on.
Then we put all data in single framework & apply various statistical tools to find out the dynamic on the market.
During the analysis stage, feedback from the stakeholder groups would be compared to determine areas of agreement as well as areas of divergence


