
Key Insights
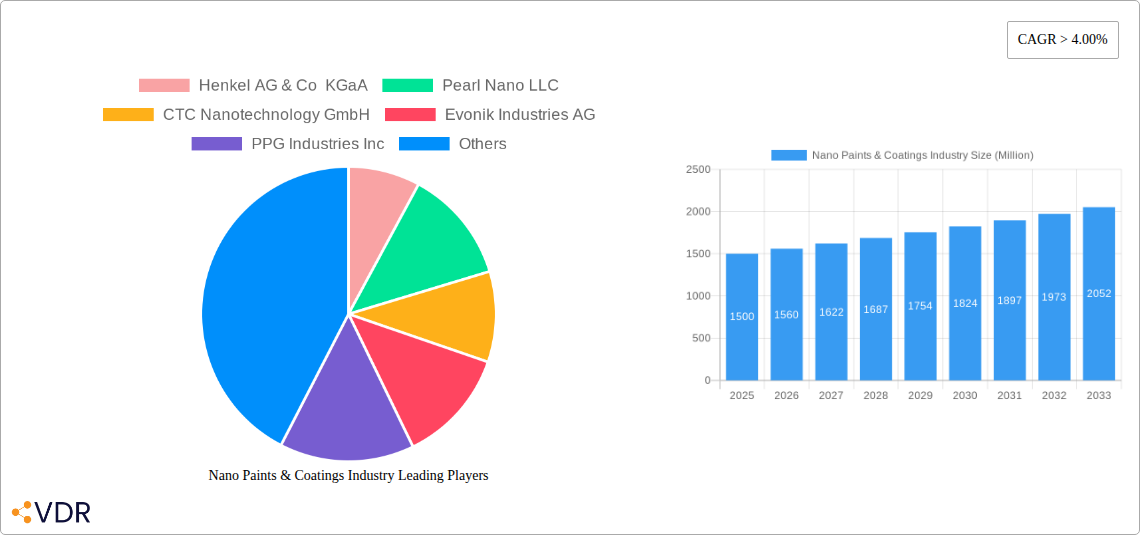
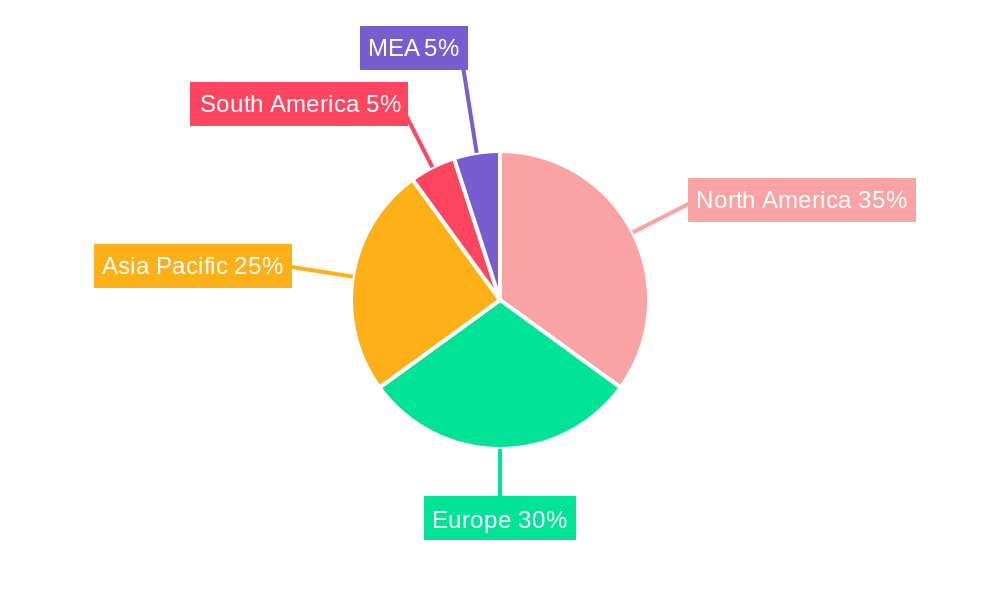
The global nano paints and coatings market is experiencing robust growth, driven by increasing demand across diverse sectors. A compound annual growth rate (CAGR) exceeding 4% indicates a significant expansion, projected to reach substantial value over the forecast period (2025-2033). Key drivers include the enhanced properties offered by nano-coatings, such as improved durability, corrosion resistance, and antimicrobial characteristics. These advantages translate to significant cost savings and performance benefits for end-users across various industries. The market is segmented by resin type (graphene, carbon nanotubes, nano-SiO2, nano-silver, nano-TiO2, nano-ZnO), application method (electrospray, electrospinning, CVD, PVD, ALD, aerosol coating, self-assembly, sol-gel), and end-user industry (biomedical, food & packaging, aerospace & defense, marine, electronics & optics, automobile, oil & gas, others). North America and Europe currently hold significant market shares, but the Asia-Pacific region is poised for rapid growth, fueled by increasing industrialization and infrastructure development. Competition within the market is intense, with a mix of large multinational corporations and specialized nanotechnology firms vying for market share. Technological advancements in nano-material synthesis and application methods will continue to shape the market landscape, driving further innovation and expansion.
The market's segmentation reveals significant opportunities. For instance, the biomedical sector's demand for biocompatible and antimicrobial coatings is driving innovation in nano-silver and nano-TiO2-based products. Similarly, the growing automotive industry necessitates coatings with enhanced scratch resistance and UV protection, boosting the demand for graphene and carbon nanotube-based solutions. The aerospace & defense industry demands high-performance coatings with exceptional durability and corrosion resistance, making this sector a key growth driver. While the high initial cost of nano-coatings remains a restraint, ongoing research and development efforts are focusing on cost-effective production methods, making nano-coatings increasingly accessible to a wider range of applications. Further research into the long-term environmental impact and potential health effects associated with some nano-materials will also influence market dynamics. The overall outlook for the nano paints and coatings market remains positive, with substantial growth potential across various segments and geographical regions.
Nano Paints & Coatings Industry Market Report: 2019-2033
This comprehensive report provides an in-depth analysis of the Nano Paints & Coatings industry, offering invaluable insights for industry professionals, investors, and strategic decision-makers. The study covers the period 2019-2033, with a focus on the forecast period 2025-2033, using 2025 as the base year and estimated year. The report segments the market by resin type, application method, and end-user industry, providing a granular understanding of market dynamics and growth potential. The total market value in 2025 is estimated at xx Million.
Keywords: Nano Paints, Coatings, Graphene, Carbon Nanotubes, Nano-SiO2, Nano Silver, Nano-TiO2, Nano-ZNO, Electrospray, Electrospinning, CVD, PVD, ALD, Aerosol Coating, Self-assembly, Sol-gel, Biomedical, Food & Packaging, Aerospace & Defense, Marine, Electronics, Optics, Automobile, Oil & Gas, Market Analysis, Market Size, Market Share, Growth Forecast, Industry Trends, Competitive Landscape, Henkel, PPG Industries, Evonik.
Nano Paints & Coatings Industry Market Dynamics & Structure
The Nano Paints & Coatings market is characterized by moderate concentration, with a few major players holding significant market share, while numerous smaller companies focus on niche applications. Technological innovation is a key driver, particularly in developing novel nano-materials with enhanced properties. Stringent regulatory frameworks regarding environmental impact and safety are shaping the industry, leading to increased R&D investment in eco-friendly solutions. The market faces competition from traditional coatings, but the unique advantages of nano-coatings, such as enhanced durability and functionality, are driving adoption. Mergers and acquisitions are relatively frequent, reflecting industry consolidation and expansion strategies.
- Market Concentration: Moderately concentrated, with the top 5 players holding an estimated xx% market share in 2025.
- Technological Innovation: Focus on developing high-performance, sustainable nano-materials and advanced application techniques.
- Regulatory Landscape: Stringent regulations on VOC emissions and material safety driving the adoption of environmentally friendly solutions.
- Competitive Substitutes: Traditional coatings pose a competitive threat, but nano-coatings offer superior properties.
- M&A Activity: Moderate level of mergers and acquisitions, driven by expansion strategies and technological integration. Estimated xx deals between 2019-2024.
- Innovation Barriers: High R&D costs and complexities in scaling up production.
Nano Paints & Coatings Industry Growth Trends & Insights
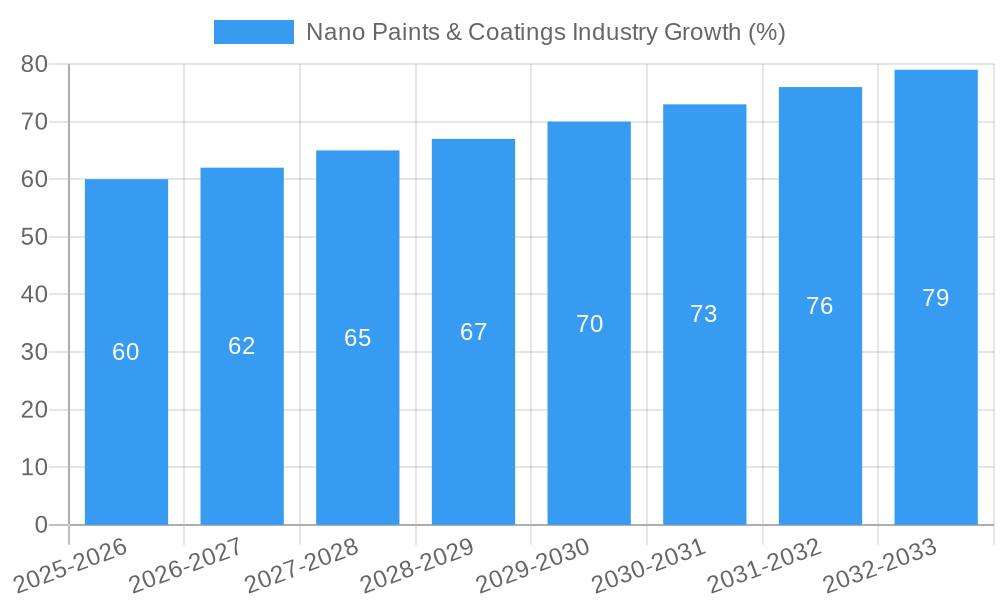
The Nano Paints & Coatings market is experiencing robust growth, driven by increasing demand from diverse end-user industries. The market size expanded from xx Million in 2019 to an estimated xx Million in 2025, exhibiting a CAGR of xx% during the historical period. This growth is attributed to several factors, including rising awareness of the benefits of enhanced performance and durability, increasing investments in R&D, and technological advancements. The adoption rate of nano-coatings is steadily increasing across various sectors, with significant potential for future growth in emerging applications. Consumer behavior is also shifting towards environmentally friendly products, promoting the development of sustainable nano-coatings. The market is projected to reach xx Million by 2033, with a forecast CAGR of xx%. Technological disruptions, such as the development of novel nano-materials and advanced application techniques, will further accelerate market growth.
Dominant Regions, Countries, or Segments in Nano Paints & Coatings Industry
North America and Europe currently dominate the Nano Paints & Coatings market, owing to established industries, significant R&D investments, and stringent environmental regulations. However, Asia-Pacific is projected to witness the fastest growth during the forecast period, driven by rapid industrialization, increasing infrastructure development, and growing demand from emerging economies.
Leading Segments:
- Resin Type: Nano-TiO2 (Titanium Dioxide) holds the largest market share due to its widespread applications in various industries. Graphene and Carbon Nanotubes are showing rapid growth due to their unique properties.
- Method: Aerosol Coating and Sol-gel methods currently dominate due to their cost-effectiveness and scalability. ALD and CVD are expected to show significant growth due to their ability to create highly uniform and thin coatings.
- End-user Industry: The Automotive and Aerospace & Defense sectors are major consumers of nano-coatings, while the Biomedical and Electronics sectors are witnessing rapid growth.
Key Drivers by Region:
- North America: Strong presence of key players, high R&D spending, and stringent environmental regulations.
- Europe: Similar to North America, with a focus on innovation and sustainability.
- Asia-Pacific: Rapid industrialization, increasing infrastructure investments, and a growing middle class driving demand.
Nano Paints & Coatings Industry Product Landscape
The nano paints and coatings market offers a wide range of products tailored to specific applications. These products boast enhanced properties such as superior durability, scratch resistance, corrosion protection, and UV resistance, exceeding the capabilities of traditional coatings. Key innovations include self-cleaning coatings, anti-fog coatings, and coatings with improved thermal conductivity. These advancements are driven by the development of new nano-materials and advanced application techniques, creating unique selling propositions and pushing technological boundaries.
Key Drivers, Barriers & Challenges in Nano Paints & Coatings Industry
Key Drivers:
- Increasing demand from various industries for enhanced performance and durability.
- Technological advancements leading to the development of novel nano-materials and improved application methods.
- Stringent environmental regulations promoting the adoption of eco-friendly coatings.
Key Barriers & Challenges:
- High R&D costs and complexities associated with scaling up production.
- Potential health and environmental concerns associated with certain nano-materials.
- Competition from traditional coatings and the need to demonstrate clear value propositions.
- Supply chain complexities and the availability of high-quality raw materials. Estimated xx% supply chain disruptions in 2024.
Emerging Opportunities in Nano Paints & Coatings Industry
Untapped markets in developing countries present significant opportunities for growth. Innovative applications in areas such as flexible electronics, energy storage, and water purification offer promising avenues for expansion. Evolving consumer preferences towards sustainable and eco-friendly products create a demand for bio-based and recyclable nano-coatings.
Growth Accelerators in the Nano Paints & Coatings Industry
Technological breakthroughs in nano-material synthesis and application techniques are key growth accelerators. Strategic partnerships between nano-material manufacturers and coatings companies facilitate the development and commercialization of innovative products. Market expansion strategies targeting emerging economies and new applications will further drive industry growth.
Key Players Shaping the Nano Paints & Coatings Industry Market
- Henkel AG & Co KGaA
- Pearl Nano LLC
- CTC Nanotechnology GmbH
- Evonik Industries AG
- PPG Industries Inc
- NanoShine Ltd
- Starshield Technologies Pvt Ltd
- icannanopaints.com (Innovation Center for Applied Nanotechnology)
- Nano-Z Coating Ltd
- Nanovere Technologies LLC
- Artekya Teknoloji
Notable Milestones in Nano Paints & Coatings Industry Sector
- 2020: Launch of a novel self-cleaning nano-coating by PPG Industries.
- 2021: Henkel acquires a leading nano-material manufacturer, expanding its product portfolio.
- 2022: Evonik introduces a new range of sustainable nano-coatings for automotive applications.
- 2023: Several key players invest heavily in R&D for advanced nano-coating technologies.
- 2024: Regulatory changes in Europe regarding nano-material labeling impact market dynamics.
In-Depth Nano Paints & Coatings Industry Market Outlook
The Nano Paints & Coatings market is poised for significant growth over the coming years, driven by technological advancements, increasing demand from diverse industries, and the development of new applications. Strategic partnerships and investments in R&D will further fuel innovation and market expansion. The focus on sustainability and eco-friendly solutions will also shape the future of the industry, offering both challenges and opportunities for market players. The market is expected to exhibit robust growth, driven by technological innovations and expansion into emerging markets.
Nano Paints & Coatings Industry Segmentation
-
1. Resin Type
- 1.1. Graphene
- 1.2. Carbon Nanotubes
- 1.3. Nano-SiO2 (Silicon Dioxide)
- 1.4. Nano Silver
- 1.5. Nano-TiO2 (Titanium Dioxide)
- 1.6. Nano-ZNO
-
2. Method
- 2.1. Electrospray and Electro Spinning
- 2.2. Chemical Vapor Deposition (CVD)
- 2.3. Physical Vapor Deposition (PVD)
- 2.4. Atomic Layer Deposition (ALD)
- 2.5. Aerosol Coating
- 2.6. Self-assembly
- 2.7. Sol-gel
-
3. End-user Industry
- 3.1. Biomedical
- 3.2. Food & Packaging
- 3.3. Aerospace & Defense
- 3.4. Marine
- 3.5. Electronics & Optics
- 3.6. Automobile
- 3.7. Oil & Gas
- 3.8. Others
Nano Paints & Coatings Industry Segmentation By Geography
-
1. Asia Pacific
- 1.1. China
- 1.2. India
- 1.3. Japan
- 1.4. South Korea
- 1.5. Rest of Asia Pacific
-
2. North America
- 2.1. United States
- 2.2. Canada
- 2.3. Mexico
-
3. Europe
- 3.1. Germany
- 3.2. United Kingdom
- 3.3. Italy
- 3.4. France
- 3.5. Rest of Europe
-
4. Rest of the World
- 4.1. South America
- 4.2. Middle East
Nano Paints & Coatings Industry REPORT HIGHLIGHTS
| Aspects | Details |
|---|---|
| Study Period | 2019-2033 |
| Base Year | 2024 |
| Estimated Year | 2025 |
| Forecast Period | 2025-2033 |
| Historical Period | 2019-2024 |
| Growth Rate | CAGR of > 4.00% from 2019-2033 |
| Segmentation |
|
Table of Contents
- 1. Introduction
- 1.1. Research Scope
- 1.2. Market Segmentation
- 1.3. Research Methodology
- 1.4. Definitions and Assumptions
- 2. Executive Summary
- 2.1. Introduction
- 3. Market Dynamics
- 3.1. Introduction
- 3.2. Market Drivers
- 3.2.1. ; Growing Demand from the Aerospace & Defense Industry; Other Drivers
- 3.3. Market Restrains
- 3.3.1. ; High Price Bar of Conductive Textile Made Products; Other Restraints
- 3.4. Market Trends
- 3.4.1. Graphene to Dominate the Market
- 4. Market Factor Analysis
- 4.1. Porters Five Forces
- 4.2. Supply/Value Chain
- 4.3. PESTEL analysis
- 4.4. Market Entropy
- 4.5. Patent/Trademark Analysis
- 5. Global Nano Paints & Coatings Industry Analysis, Insights and Forecast, 2019-2031
- 5.1. Market Analysis, Insights and Forecast - by Resin Type
- 5.1.1. Graphene
- 5.1.2. Carbon Nanotubes
- 5.1.3. Nano-SiO2 (Silicon Dioxide)
- 5.1.4. Nano Silver
- 5.1.5. Nano-TiO2 (Titanium Dioxide)
- 5.1.6. Nano-ZNO
- 5.2. Market Analysis, Insights and Forecast - by Method
- 5.2.1. Electrospray and Electro Spinning
- 5.2.2. Chemical Vapor Deposition (CVD)
- 5.2.3. Physical Vapor Deposition (PVD)
- 5.2.4. Atomic Layer Deposition (ALD)
- 5.2.5. Aerosol Coating
- 5.2.6. Self-assembly
- 5.2.7. Sol-gel
- 5.3. Market Analysis, Insights and Forecast - by End-user Industry
- 5.3.1. Biomedical
- 5.3.2. Food & Packaging
- 5.3.3. Aerospace & Defense
- 5.3.4. Marine
- 5.3.5. Electronics & Optics
- 5.3.6. Automobile
- 5.3.7. Oil & Gas
- 5.3.8. Others
- 5.4. Market Analysis, Insights and Forecast - by Region
- 5.4.1. Asia Pacific
- 5.4.2. North America
- 5.4.3. Europe
- 5.4.4. Rest of the World
- 5.1. Market Analysis, Insights and Forecast - by Resin Type
- 6. Asia Pacific Nano Paints & Coatings Industry Analysis, Insights and Forecast, 2019-2031
- 6.1. Market Analysis, Insights and Forecast - by Resin Type
- 6.1.1. Graphene
- 6.1.2. Carbon Nanotubes
- 6.1.3. Nano-SiO2 (Silicon Dioxide)
- 6.1.4. Nano Silver
- 6.1.5. Nano-TiO2 (Titanium Dioxide)
- 6.1.6. Nano-ZNO
- 6.2. Market Analysis, Insights and Forecast - by Method
- 6.2.1. Electrospray and Electro Spinning
- 6.2.2. Chemical Vapor Deposition (CVD)
- 6.2.3. Physical Vapor Deposition (PVD)
- 6.2.4. Atomic Layer Deposition (ALD)
- 6.2.5. Aerosol Coating
- 6.2.6. Self-assembly
- 6.2.7. Sol-gel
- 6.3. Market Analysis, Insights and Forecast - by End-user Industry
- 6.3.1. Biomedical
- 6.3.2. Food & Packaging
- 6.3.3. Aerospace & Defense
- 6.3.4. Marine
- 6.3.5. Electronics & Optics
- 6.3.6. Automobile
- 6.3.7. Oil & Gas
- 6.3.8. Others
- 6.1. Market Analysis, Insights and Forecast - by Resin Type
- 7. North America Nano Paints & Coatings Industry Analysis, Insights and Forecast, 2019-2031
- 7.1. Market Analysis, Insights and Forecast - by Resin Type
- 7.1.1. Graphene
- 7.1.2. Carbon Nanotubes
- 7.1.3. Nano-SiO2 (Silicon Dioxide)
- 7.1.4. Nano Silver
- 7.1.5. Nano-TiO2 (Titanium Dioxide)
- 7.1.6. Nano-ZNO
- 7.2. Market Analysis, Insights and Forecast - by Method
- 7.2.1. Electrospray and Electro Spinning
- 7.2.2. Chemical Vapor Deposition (CVD)
- 7.2.3. Physical Vapor Deposition (PVD)
- 7.2.4. Atomic Layer Deposition (ALD)
- 7.2.5. Aerosol Coating
- 7.2.6. Self-assembly
- 7.2.7. Sol-gel
- 7.3. Market Analysis, Insights and Forecast - by End-user Industry
- 7.3.1. Biomedical
- 7.3.2. Food & Packaging
- 7.3.3. Aerospace & Defense
- 7.3.4. Marine
- 7.3.5. Electronics & Optics
- 7.3.6. Automobile
- 7.3.7. Oil & Gas
- 7.3.8. Others
- 7.1. Market Analysis, Insights and Forecast - by Resin Type
- 8. Europe Nano Paints & Coatings Industry Analysis, Insights and Forecast, 2019-2031
- 8.1. Market Analysis, Insights and Forecast - by Resin Type
- 8.1.1. Graphene
- 8.1.2. Carbon Nanotubes
- 8.1.3. Nano-SiO2 (Silicon Dioxide)
- 8.1.4. Nano Silver
- 8.1.5. Nano-TiO2 (Titanium Dioxide)
- 8.1.6. Nano-ZNO
- 8.2. Market Analysis, Insights and Forecast - by Method
- 8.2.1. Electrospray and Electro Spinning
- 8.2.2. Chemical Vapor Deposition (CVD)
- 8.2.3. Physical Vapor Deposition (PVD)
- 8.2.4. Atomic Layer Deposition (ALD)
- 8.2.5. Aerosol Coating
- 8.2.6. Self-assembly
- 8.2.7. Sol-gel
- 8.3. Market Analysis, Insights and Forecast - by End-user Industry
- 8.3.1. Biomedical
- 8.3.2. Food & Packaging
- 8.3.3. Aerospace & Defense
- 8.3.4. Marine
- 8.3.5. Electronics & Optics
- 8.3.6. Automobile
- 8.3.7. Oil & Gas
- 8.3.8. Others
- 8.1. Market Analysis, Insights and Forecast - by Resin Type
- 9. Rest of the World Nano Paints & Coatings Industry Analysis, Insights and Forecast, 2019-2031
- 9.1. Market Analysis, Insights and Forecast - by Resin Type
- 9.1.1. Graphene
- 9.1.2. Carbon Nanotubes
- 9.1.3. Nano-SiO2 (Silicon Dioxide)
- 9.1.4. Nano Silver
- 9.1.5. Nano-TiO2 (Titanium Dioxide)
- 9.1.6. Nano-ZNO
- 9.2. Market Analysis, Insights and Forecast - by Method
- 9.2.1. Electrospray and Electro Spinning
- 9.2.2. Chemical Vapor Deposition (CVD)
- 9.2.3. Physical Vapor Deposition (PVD)
- 9.2.4. Atomic Layer Deposition (ALD)
- 9.2.5. Aerosol Coating
- 9.2.6. Self-assembly
- 9.2.7. Sol-gel
- 9.3. Market Analysis, Insights and Forecast - by End-user Industry
- 9.3.1. Biomedical
- 9.3.2. Food & Packaging
- 9.3.3. Aerospace & Defense
- 9.3.4. Marine
- 9.3.5. Electronics & Optics
- 9.3.6. Automobile
- 9.3.7. Oil & Gas
- 9.3.8. Others
- 9.1. Market Analysis, Insights and Forecast - by Resin Type
- 10. North America Nano Paints & Coatings Industry Analysis, Insights and Forecast, 2019-2031
- 10.1. Market Analysis, Insights and Forecast - By Country/Sub-region
- 10.1.1 United States
- 10.1.2 Canada
- 10.1.3 Mexico
- 11. Europe Nano Paints & Coatings Industry Analysis, Insights and Forecast, 2019-2031
- 11.1. Market Analysis, Insights and Forecast - By Country/Sub-region
- 11.1.1 Germany
- 11.1.2 United Kingdom
- 11.1.3 France
- 11.1.4 Spain
- 11.1.5 Italy
- 11.1.6 Spain
- 11.1.7 Belgium
- 11.1.8 Netherland
- 11.1.9 Nordics
- 11.1.10 Rest of Europe
- 12. Asia Pacific Nano Paints & Coatings Industry Analysis, Insights and Forecast, 2019-2031
- 12.1. Market Analysis, Insights and Forecast - By Country/Sub-region
- 12.1.1 China
- 12.1.2 Japan
- 12.1.3 India
- 12.1.4 South Korea
- 12.1.5 Southeast Asia
- 12.1.6 Australia
- 12.1.7 Indonesia
- 12.1.8 Phillipes
- 12.1.9 Singapore
- 12.1.10 Thailandc
- 12.1.11 Rest of Asia Pacific
- 13. South America Nano Paints & Coatings Industry Analysis, Insights and Forecast, 2019-2031
- 13.1. Market Analysis, Insights and Forecast - By Country/Sub-region
- 13.1.1 Brazil
- 13.1.2 Argentina
- 13.1.3 Peru
- 13.1.4 Chile
- 13.1.5 Colombia
- 13.1.6 Ecuador
- 13.1.7 Venezuela
- 13.1.8 Rest of South America
- 14. North America Nano Paints & Coatings Industry Analysis, Insights and Forecast, 2019-2031
- 14.1. Market Analysis, Insights and Forecast - By Country/Sub-region
- 14.1.1 United States
- 14.1.2 Canada
- 14.1.3 Mexico
- 15. MEA Nano Paints & Coatings Industry Analysis, Insights and Forecast, 2019-2031
- 15.1. Market Analysis, Insights and Forecast - By Country/Sub-region
- 15.1.1 United Arab Emirates
- 15.1.2 Saudi Arabia
- 15.1.3 South Africa
- 15.1.4 Rest of Middle East and Africa
- 16. Competitive Analysis
- 16.1. Global Market Share Analysis 2024
- 16.2. Company Profiles
- 16.2.1 Henkel AG & Co KGaA
- 16.2.1.1. Overview
- 16.2.1.2. Products
- 16.2.1.3. SWOT Analysis
- 16.2.1.4. Recent Developments
- 16.2.1.5. Financials (Based on Availability)
- 16.2.2 Pearl Nano LLC
- 16.2.2.1. Overview
- 16.2.2.2. Products
- 16.2.2.3. SWOT Analysis
- 16.2.2.4. Recent Developments
- 16.2.2.5. Financials (Based on Availability)
- 16.2.3 CTC Nanotechnology GmbH
- 16.2.3.1. Overview
- 16.2.3.2. Products
- 16.2.3.3. SWOT Analysis
- 16.2.3.4. Recent Developments
- 16.2.3.5. Financials (Based on Availability)
- 16.2.4 Evonik Industries AG
- 16.2.4.1. Overview
- 16.2.4.2. Products
- 16.2.4.3. SWOT Analysis
- 16.2.4.4. Recent Developments
- 16.2.4.5. Financials (Based on Availability)
- 16.2.5 PPG Industries Inc
- 16.2.5.1. Overview
- 16.2.5.2. Products
- 16.2.5.3. SWOT Analysis
- 16.2.5.4. Recent Developments
- 16.2.5.5. Financials (Based on Availability)
- 16.2.6 NanoShine Ltd
- 16.2.6.1. Overview
- 16.2.6.2. Products
- 16.2.6.3. SWOT Analysis
- 16.2.6.4. Recent Developments
- 16.2.6.5. Financials (Based on Availability)
- 16.2.7 Starshield Technologies Pvt Ltd*List Not Exhaustive
- 16.2.7.1. Overview
- 16.2.7.2. Products
- 16.2.7.3. SWOT Analysis
- 16.2.7.4. Recent Developments
- 16.2.7.5. Financials (Based on Availability)
- 16.2.8 icannanopaints com ( Innovation Center for Applied Nanotechnology)
- 16.2.8.1. Overview
- 16.2.8.2. Products
- 16.2.8.3. SWOT Analysis
- 16.2.8.4. Recent Developments
- 16.2.8.5. Financials (Based on Availability)
- 16.2.9 Nano-Z Coating Ltd
- 16.2.9.1. Overview
- 16.2.9.2. Products
- 16.2.9.3. SWOT Analysis
- 16.2.9.4. Recent Developments
- 16.2.9.5. Financials (Based on Availability)
- 16.2.10 Nanovere Technologies LLC
- 16.2.10.1. Overview
- 16.2.10.2. Products
- 16.2.10.3. SWOT Analysis
- 16.2.10.4. Recent Developments
- 16.2.10.5. Financials (Based on Availability)
- 16.2.11 Artekya Teknoloji
- 16.2.11.1. Overview
- 16.2.11.2. Products
- 16.2.11.3. SWOT Analysis
- 16.2.11.4. Recent Developments
- 16.2.11.5. Financials (Based on Availability)
- 16.2.1 Henkel AG & Co KGaA
List of Figures
- Figure 1: Global Nano Paints & Coatings Industry Revenue Breakdown (Million, %) by Region 2024 & 2032
- Figure 2: North America Nano Paints & Coatings Industry Revenue (Million), by Country 2024 & 2032
- Figure 3: North America Nano Paints & Coatings Industry Revenue Share (%), by Country 2024 & 2032
- Figure 4: Europe Nano Paints & Coatings Industry Revenue (Million), by Country 2024 & 2032
- Figure 5: Europe Nano Paints & Coatings Industry Revenue Share (%), by Country 2024 & 2032
- Figure 6: Asia Pacific Nano Paints & Coatings Industry Revenue (Million), by Country 2024 & 2032
- Figure 7: Asia Pacific Nano Paints & Coatings Industry Revenue Share (%), by Country 2024 & 2032
- Figure 8: South America Nano Paints & Coatings Industry Revenue (Million), by Country 2024 & 2032
- Figure 9: South America Nano Paints & Coatings Industry Revenue Share (%), by Country 2024 & 2032
- Figure 10: North America Nano Paints & Coatings Industry Revenue (Million), by Country 2024 & 2032
- Figure 11: North America Nano Paints & Coatings Industry Revenue Share (%), by Country 2024 & 2032
- Figure 12: MEA Nano Paints & Coatings Industry Revenue (Million), by Country 2024 & 2032
- Figure 13: MEA Nano Paints & Coatings Industry Revenue Share (%), by Country 2024 & 2032
- Figure 14: Asia Pacific Nano Paints & Coatings Industry Revenue (Million), by Resin Type 2024 & 2032
- Figure 15: Asia Pacific Nano Paints & Coatings Industry Revenue Share (%), by Resin Type 2024 & 2032
- Figure 16: Asia Pacific Nano Paints & Coatings Industry Revenue (Million), by Method 2024 & 2032
- Figure 17: Asia Pacific Nano Paints & Coatings Industry Revenue Share (%), by Method 2024 & 2032
- Figure 18: Asia Pacific Nano Paints & Coatings Industry Revenue (Million), by End-user Industry 2024 & 2032
- Figure 19: Asia Pacific Nano Paints & Coatings Industry Revenue Share (%), by End-user Industry 2024 & 2032
- Figure 20: Asia Pacific Nano Paints & Coatings Industry Revenue (Million), by Country 2024 & 2032
- Figure 21: Asia Pacific Nano Paints & Coatings Industry Revenue Share (%), by Country 2024 & 2032
- Figure 22: North America Nano Paints & Coatings Industry Revenue (Million), by Resin Type 2024 & 2032
- Figure 23: North America Nano Paints & Coatings Industry Revenue Share (%), by Resin Type 2024 & 2032
- Figure 24: North America Nano Paints & Coatings Industry Revenue (Million), by Method 2024 & 2032
- Figure 25: North America Nano Paints & Coatings Industry Revenue Share (%), by Method 2024 & 2032
- Figure 26: North America Nano Paints & Coatings Industry Revenue (Million), by End-user Industry 2024 & 2032
- Figure 27: North America Nano Paints & Coatings Industry Revenue Share (%), by End-user Industry 2024 & 2032
- Figure 28: North America Nano Paints & Coatings Industry Revenue (Million), by Country 2024 & 2032
- Figure 29: North America Nano Paints & Coatings Industry Revenue Share (%), by Country 2024 & 2032
- Figure 30: Europe Nano Paints & Coatings Industry Revenue (Million), by Resin Type 2024 & 2032
- Figure 31: Europe Nano Paints & Coatings Industry Revenue Share (%), by Resin Type 2024 & 2032
- Figure 32: Europe Nano Paints & Coatings Industry Revenue (Million), by Method 2024 & 2032
- Figure 33: Europe Nano Paints & Coatings Industry Revenue Share (%), by Method 2024 & 2032
- Figure 34: Europe Nano Paints & Coatings Industry Revenue (Million), by End-user Industry 2024 & 2032
- Figure 35: Europe Nano Paints & Coatings Industry Revenue Share (%), by End-user Industry 2024 & 2032
- Figure 36: Europe Nano Paints & Coatings Industry Revenue (Million), by Country 2024 & 2032
- Figure 37: Europe Nano Paints & Coatings Industry Revenue Share (%), by Country 2024 & 2032
- Figure 38: Rest of the World Nano Paints & Coatings Industry Revenue (Million), by Resin Type 2024 & 2032
- Figure 39: Rest of the World Nano Paints & Coatings Industry Revenue Share (%), by Resin Type 2024 & 2032
- Figure 40: Rest of the World Nano Paints & Coatings Industry Revenue (Million), by Method 2024 & 2032
- Figure 41: Rest of the World Nano Paints & Coatings Industry Revenue Share (%), by Method 2024 & 2032
- Figure 42: Rest of the World Nano Paints & Coatings Industry Revenue (Million), by End-user Industry 2024 & 2032
- Figure 43: Rest of the World Nano Paints & Coatings Industry Revenue Share (%), by End-user Industry 2024 & 2032
- Figure 44: Rest of the World Nano Paints & Coatings Industry Revenue (Million), by Country 2024 & 2032
- Figure 45: Rest of the World Nano Paints & Coatings Industry Revenue Share (%), by Country 2024 & 2032
List of Tables
- Table 1: Global Nano Paints & Coatings Industry Revenue Million Forecast, by Region 2019 & 2032
- Table 2: Global Nano Paints & Coatings Industry Revenue Million Forecast, by Resin Type 2019 & 2032
- Table 3: Global Nano Paints & Coatings Industry Revenue Million Forecast, by Method 2019 & 2032
- Table 4: Global Nano Paints & Coatings Industry Revenue Million Forecast, by End-user Industry 2019 & 2032
- Table 5: Global Nano Paints & Coatings Industry Revenue Million Forecast, by Region 2019 & 2032
- Table 6: Global Nano Paints & Coatings Industry Revenue Million Forecast, by Country 2019 & 2032
- Table 7: United States Nano Paints & Coatings Industry Revenue (Million) Forecast, by Application 2019 & 2032
- Table 8: Canada Nano Paints & Coatings Industry Revenue (Million) Forecast, by Application 2019 & 2032
- Table 9: Mexico Nano Paints & Coatings Industry Revenue (Million) Forecast, by Application 2019 & 2032
- Table 10: Global Nano Paints & Coatings Industry Revenue Million Forecast, by Country 2019 & 2032
- Table 11: Germany Nano Paints & Coatings Industry Revenue (Million) Forecast, by Application 2019 & 2032
- Table 12: United Kingdom Nano Paints & Coatings Industry Revenue (Million) Forecast, by Application 2019 & 2032
- Table 13: France Nano Paints & Coatings Industry Revenue (Million) Forecast, by Application 2019 & 2032
- Table 14: Spain Nano Paints & Coatings Industry Revenue (Million) Forecast, by Application 2019 & 2032
- Table 15: Italy Nano Paints & Coatings Industry Revenue (Million) Forecast, by Application 2019 & 2032
- Table 16: Spain Nano Paints & Coatings Industry Revenue (Million) Forecast, by Application 2019 & 2032
- Table 17: Belgium Nano Paints & Coatings Industry Revenue (Million) Forecast, by Application 2019 & 2032
- Table 18: Netherland Nano Paints & Coatings Industry Revenue (Million) Forecast, by Application 2019 & 2032
- Table 19: Nordics Nano Paints & Coatings Industry Revenue (Million) Forecast, by Application 2019 & 2032
- Table 20: Rest of Europe Nano Paints & Coatings Industry Revenue (Million) Forecast, by Application 2019 & 2032
- Table 21: Global Nano Paints & Coatings Industry Revenue Million Forecast, by Country 2019 & 2032
- Table 22: China Nano Paints & Coatings Industry Revenue (Million) Forecast, by Application 2019 & 2032
- Table 23: Japan Nano Paints & Coatings Industry Revenue (Million) Forecast, by Application 2019 & 2032
- Table 24: India Nano Paints & Coatings Industry Revenue (Million) Forecast, by Application 2019 & 2032
- Table 25: South Korea Nano Paints & Coatings Industry Revenue (Million) Forecast, by Application 2019 & 2032
- Table 26: Southeast Asia Nano Paints & Coatings Industry Revenue (Million) Forecast, by Application 2019 & 2032
- Table 27: Australia Nano Paints & Coatings Industry Revenue (Million) Forecast, by Application 2019 & 2032
- Table 28: Indonesia Nano Paints & Coatings Industry Revenue (Million) Forecast, by Application 2019 & 2032
- Table 29: Phillipes Nano Paints & Coatings Industry Revenue (Million) Forecast, by Application 2019 & 2032
- Table 30: Singapore Nano Paints & Coatings Industry Revenue (Million) Forecast, by Application 2019 & 2032
- Table 31: Thailandc Nano Paints & Coatings Industry Revenue (Million) Forecast, by Application 2019 & 2032
- Table 32: Rest of Asia Pacific Nano Paints & Coatings Industry Revenue (Million) Forecast, by Application 2019 & 2032
- Table 33: Global Nano Paints & Coatings Industry Revenue Million Forecast, by Country 2019 & 2032
- Table 34: Brazil Nano Paints & Coatings Industry Revenue (Million) Forecast, by Application 2019 & 2032
- Table 35: Argentina Nano Paints & Coatings Industry Revenue (Million) Forecast, by Application 2019 & 2032
- Table 36: Peru Nano Paints & Coatings Industry Revenue (Million) Forecast, by Application 2019 & 2032
- Table 37: Chile Nano Paints & Coatings Industry Revenue (Million) Forecast, by Application 2019 & 2032
- Table 38: Colombia Nano Paints & Coatings Industry Revenue (Million) Forecast, by Application 2019 & 2032
- Table 39: Ecuador Nano Paints & Coatings Industry Revenue (Million) Forecast, by Application 2019 & 2032
- Table 40: Venezuela Nano Paints & Coatings Industry Revenue (Million) Forecast, by Application 2019 & 2032
- Table 41: Rest of South America Nano Paints & Coatings Industry Revenue (Million) Forecast, by Application 2019 & 2032
- Table 42: Global Nano Paints & Coatings Industry Revenue Million Forecast, by Country 2019 & 2032
- Table 43: United States Nano Paints & Coatings Industry Revenue (Million) Forecast, by Application 2019 & 2032
- Table 44: Canada Nano Paints & Coatings Industry Revenue (Million) Forecast, by Application 2019 & 2032
- Table 45: Mexico Nano Paints & Coatings Industry Revenue (Million) Forecast, by Application 2019 & 2032
- Table 46: Global Nano Paints & Coatings Industry Revenue Million Forecast, by Country 2019 & 2032
- Table 47: United Arab Emirates Nano Paints & Coatings Industry Revenue (Million) Forecast, by Application 2019 & 2032
- Table 48: Saudi Arabia Nano Paints & Coatings Industry Revenue (Million) Forecast, by Application 2019 & 2032
- Table 49: South Africa Nano Paints & Coatings Industry Revenue (Million) Forecast, by Application 2019 & 2032
- Table 50: Rest of Middle East and Africa Nano Paints & Coatings Industry Revenue (Million) Forecast, by Application 2019 & 2032
- Table 51: Global Nano Paints & Coatings Industry Revenue Million Forecast, by Resin Type 2019 & 2032
- Table 52: Global Nano Paints & Coatings Industry Revenue Million Forecast, by Method 2019 & 2032
- Table 53: Global Nano Paints & Coatings Industry Revenue Million Forecast, by End-user Industry 2019 & 2032
- Table 54: Global Nano Paints & Coatings Industry Revenue Million Forecast, by Country 2019 & 2032
- Table 55: China Nano Paints & Coatings Industry Revenue (Million) Forecast, by Application 2019 & 2032
- Table 56: India Nano Paints & Coatings Industry Revenue (Million) Forecast, by Application 2019 & 2032
- Table 57: Japan Nano Paints & Coatings Industry Revenue (Million) Forecast, by Application 2019 & 2032
- Table 58: South Korea Nano Paints & Coatings Industry Revenue (Million) Forecast, by Application 2019 & 2032
- Table 59: Rest of Asia Pacific Nano Paints & Coatings Industry Revenue (Million) Forecast, by Application 2019 & 2032
- Table 60: Global Nano Paints & Coatings Industry Revenue Million Forecast, by Resin Type 2019 & 2032
- Table 61: Global Nano Paints & Coatings Industry Revenue Million Forecast, by Method 2019 & 2032
- Table 62: Global Nano Paints & Coatings Industry Revenue Million Forecast, by End-user Industry 2019 & 2032
- Table 63: Global Nano Paints & Coatings Industry Revenue Million Forecast, by Country 2019 & 2032
- Table 64: United States Nano Paints & Coatings Industry Revenue (Million) Forecast, by Application 2019 & 2032
- Table 65: Canada Nano Paints & Coatings Industry Revenue (Million) Forecast, by Application 2019 & 2032
- Table 66: Mexico Nano Paints & Coatings Industry Revenue (Million) Forecast, by Application 2019 & 2032
- Table 67: Global Nano Paints & Coatings Industry Revenue Million Forecast, by Resin Type 2019 & 2032
- Table 68: Global Nano Paints & Coatings Industry Revenue Million Forecast, by Method 2019 & 2032
- Table 69: Global Nano Paints & Coatings Industry Revenue Million Forecast, by End-user Industry 2019 & 2032
- Table 70: Global Nano Paints & Coatings Industry Revenue Million Forecast, by Country 2019 & 2032
- Table 71: Germany Nano Paints & Coatings Industry Revenue (Million) Forecast, by Application 2019 & 2032
- Table 72: United Kingdom Nano Paints & Coatings Industry Revenue (Million) Forecast, by Application 2019 & 2032
- Table 73: Italy Nano Paints & Coatings Industry Revenue (Million) Forecast, by Application 2019 & 2032
- Table 74: France Nano Paints & Coatings Industry Revenue (Million) Forecast, by Application 2019 & 2032
- Table 75: Rest of Europe Nano Paints & Coatings Industry Revenue (Million) Forecast, by Application 2019 & 2032
- Table 76: Global Nano Paints & Coatings Industry Revenue Million Forecast, by Resin Type 2019 & 2032
- Table 77: Global Nano Paints & Coatings Industry Revenue Million Forecast, by Method 2019 & 2032
- Table 78: Global Nano Paints & Coatings Industry Revenue Million Forecast, by End-user Industry 2019 & 2032
- Table 79: Global Nano Paints & Coatings Industry Revenue Million Forecast, by Country 2019 & 2032
- Table 80: South America Nano Paints & Coatings Industry Revenue (Million) Forecast, by Application 2019 & 2032
- Table 81: Middle East Nano Paints & Coatings Industry Revenue (Million) Forecast, by Application 2019 & 2032
Frequently Asked Questions
1. What is the projected Compound Annual Growth Rate (CAGR) of the Nano Paints & Coatings Industry?
The projected CAGR is approximately > 4.00%.
2. Which companies are prominent players in the Nano Paints & Coatings Industry?
Key companies in the market include Henkel AG & Co KGaA, Pearl Nano LLC, CTC Nanotechnology GmbH, Evonik Industries AG, PPG Industries Inc, NanoShine Ltd, Starshield Technologies Pvt Ltd*List Not Exhaustive, icannanopaints com ( Innovation Center for Applied Nanotechnology), Nano-Z Coating Ltd, Nanovere Technologies LLC, Artekya Teknoloji.
3. What are the main segments of the Nano Paints & Coatings Industry?
The market segments include Resin Type, Method, End-user Industry.
4. Can you provide details about the market size?
The market size is estimated to be USD XX Million as of 2022.
5. What are some drivers contributing to market growth?
; Growing Demand from the Aerospace & Defense Industry; Other Drivers.
6. What are the notable trends driving market growth?
Graphene to Dominate the Market.
7. Are there any restraints impacting market growth?
; High Price Bar of Conductive Textile Made Products; Other Restraints.
8. Can you provide examples of recent developments in the market?
N/A
9. What pricing options are available for accessing the report?
Pricing options include single-user, multi-user, and enterprise licenses priced at USD 4750, USD 5250, and USD 8750 respectively.
10. Is the market size provided in terms of value or volume?
The market size is provided in terms of value, measured in Million.
11. Are there any specific market keywords associated with the report?
Yes, the market keyword associated with the report is "Nano Paints & Coatings Industry," which aids in identifying and referencing the specific market segment covered.
12. How do I determine which pricing option suits my needs best?
The pricing options vary based on user requirements and access needs. Individual users may opt for single-user licenses, while businesses requiring broader access may choose multi-user or enterprise licenses for cost-effective access to the report.
13. Are there any additional resources or data provided in the Nano Paints & Coatings Industry report?
While the report offers comprehensive insights, it's advisable to review the specific contents or supplementary materials provided to ascertain if additional resources or data are available.
14. How can I stay updated on further developments or reports in the Nano Paints & Coatings Industry?
To stay informed about further developments, trends, and reports in the Nano Paints & Coatings Industry, consider subscribing to industry newsletters, following relevant companies and organizations, or regularly checking reputable industry news sources and publications.
Methodology
Step 1 - Identification of Relevant Samples Size from Population Database


Step 2 - Approaches for Defining Global Market Size (Value, Volume* & Price*)

Note*: In applicable scenarios
Step 3 - Data Sources
Primary Research
- Web Analytics
- Survey Reports
- Research Institute
- Latest Research Reports
- Opinion Leaders
Secondary Research
- Annual Reports
- White Paper
- Latest Press Release
- Industry Association
- Paid Database
- Investor Presentations

Step 4 - Data Triangulation
Involves using different sources of information in order to increase the validity of a study
These sources are likely to be stakeholders in a program - participants, other researchers, program staff, other community members, and so on.
Then we put all data in single framework & apply various statistical tools to find out the dynamic on the market.
During the analysis stage, feedback from the stakeholder groups would be compared to determine areas of agreement as well as areas of divergence


