

Key Insights
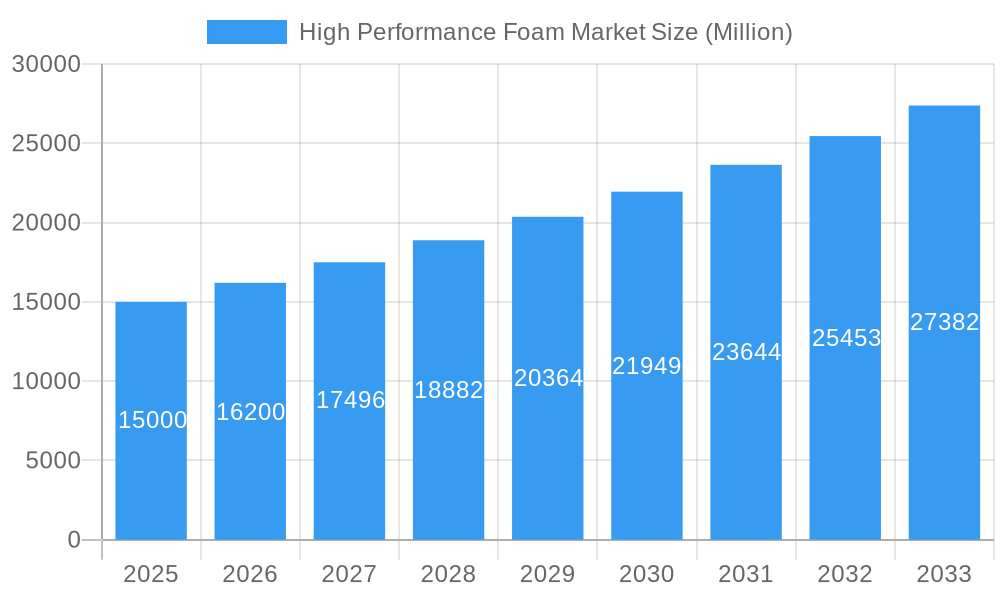
The high-performance foam market is experiencing robust growth, projected to maintain a CAGR exceeding 8% from 2025 to 2033. This expansion is driven by several key factors. Increasing demand across diverse end-use industries, particularly construction (for insulation and lightweighting), transportation (in automotive and aerospace for noise reduction and impact absorption), and electrical and electronics (for thermal management), is a major catalyst. Furthermore, advancements in material science are leading to the development of foams with enhanced properties like superior thermal insulation, improved acoustic dampening, and greater strength-to-weight ratios. This innovation is attracting new applications and expanding market penetration. The market is segmented by type (silicone, polyurethane, polyamide, polyethylene, and others) and end-user industry, with polyurethane currently holding a significant share due to its versatility and cost-effectiveness. However, silicone foams are gaining traction due to their superior performance in high-temperature applications. Geographically, Asia Pacific, particularly China and India, represent significant growth opportunities due to rapid industrialization and infrastructure development. North America and Europe also contribute substantially, driven by existing robust industrial sectors and adoption of advanced technologies. While raw material price fluctuations and environmental concerns present some challenges, the overall market outlook remains positive, supported by continuous innovation and the growing demand for lightweight, high-performance materials.
High Performance Foam Market Market Size (In Billion)
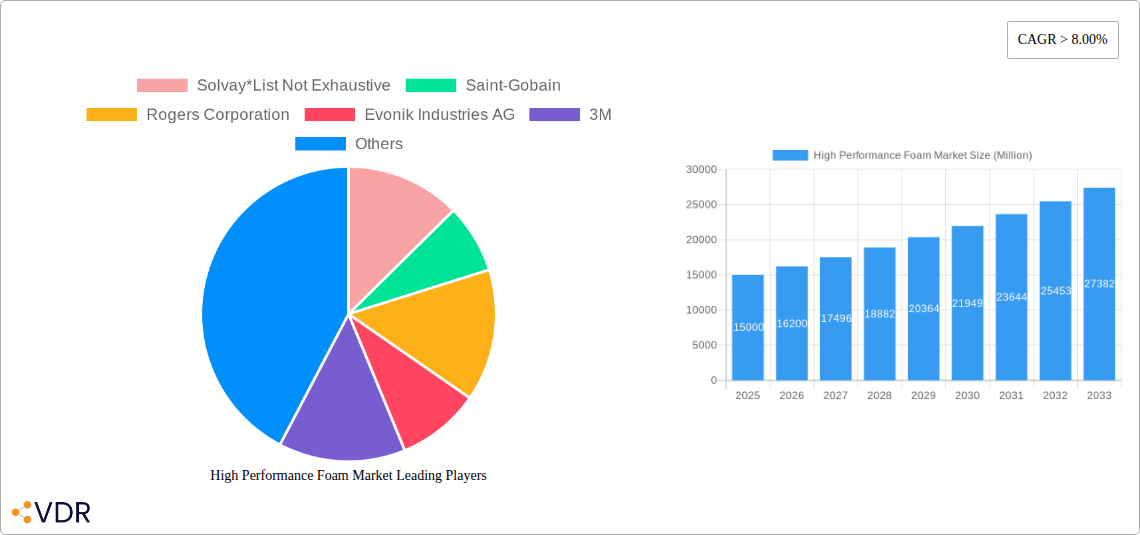
The competitive landscape is characterized by the presence of established global players like Solvay, Saint-Gobain, Rogers Corporation, Evonik Industries AG, 3M, Armacell, BASF SE, SABIC, DuPont, Zotefoams Plc, and Sekisui Alveo. These companies are actively investing in R&D to develop innovative products and expand their market share. Strategic partnerships, mergers, and acquisitions are also likely to shape the competitive dynamics in the coming years. The market is expected to witness increased consolidation as companies seek to enhance their product portfolio and geographical reach. The focus on sustainability and the development of eco-friendly high-performance foams will further influence market trends. The market's future trajectory will be shaped by technological advancements, evolving regulatory landscapes, and the adoption of sustainable practices within various end-use industries.
High Performance Foam Market Company Market Share
High Performance Foam Market Report: 2019-2033
This comprehensive report provides an in-depth analysis of the High Performance Foam Market, encompassing market dynamics, growth trends, regional segmentation, product landscape, and key player strategies. The study covers the period 2019-2033, with a focus on the forecast period 2025-2033 and a base year of 2025. This report is crucial for businesses involved in silicone foam, polyurethane foam, polyamide foam, polyethylene foam, and other types of high-performance foams targeting the construction, transportation, electronics, packaging, and healthcare sectors.
High Performance Foam Market Market Dynamics & Structure
This section analyzes the market concentration, technological advancements, regulatory landscape, competitive substitutes, end-user demographics, and mergers & acquisitions (M&A) activity within the high-performance foam industry. The global market size in 2025 is estimated at XX Million units.
- Market Concentration: The market exhibits a moderately concentrated structure with key players holding significant market share. The top five players account for approximately xx% of the total market, while smaller players dominate niche segments.
- Technological Innovation: Continuous R&D efforts drive innovation in material composition, processing techniques, and product functionalities, leading to the development of lighter, stronger, and more sustainable foams. Key innovations include advancements in nanotechnology and bio-based foams.
- Regulatory Frameworks: Stringent environmental regulations related to VOC emissions and material recyclability influence product development and manufacturing processes. Compliance costs and standards vary across different regions, creating a complex regulatory landscape.
- Competitive Product Substitutes: High-performance foams compete with alternative materials like composites, plastics, and metals in certain applications. The choice depends on factors such as performance requirements, cost, and sustainability considerations. The market share of substitutes is estimated at xx%.
- End-User Demographics: The construction industry accounts for the largest share of high-performance foam consumption, followed by the transportation and electrical and electronics sectors. Changing demographic trends (e.g., urbanization and aging population) influence demand patterns.
- M&A Trends: The number of M&A deals in the high-performance foam sector averaged xx deals per year during the historical period (2019-2024). These transactions aim to expand product portfolios, enhance geographical reach, and secure access to advanced technologies.
High Performance Foam Market Growth Trends & Insights
The High Performance Foam Market is experiencing robust growth driven by increasing demand from diverse end-user industries. The market exhibited a CAGR of xx% during the historical period (2019-2024) and is projected to maintain a CAGR of xx% during the forecast period (2025-2033), reaching XX Million units by 2033. This growth is fueled by several key factors, including:
- Rising construction activities: Global infrastructure development and urbanization drive significant demand for high-performance foams in building insulation and construction materials.
- Advancements in lightweighting technologies: The transportation industry’s focus on fuel efficiency and reduced emissions boosts the adoption of lightweight high-performance foams in automotive and aerospace applications.
- Technological disruptions: Innovations in foam technology, such as the development of bio-based and recycled foams, are creating new growth opportunities.
- Consumer behavior shifts: Growing awareness of energy efficiency and sustainability is increasing the demand for eco-friendly high-performance foams. The market penetration of eco-friendly options is expected to increase from xx% in 2025 to xx% by 2033.
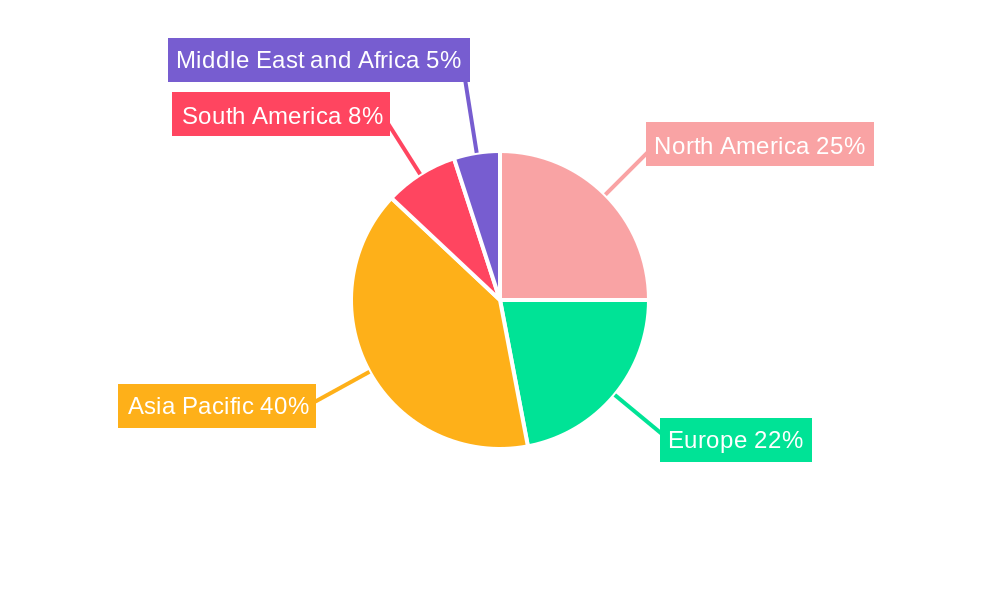
Dominant Regions, Countries, or Segments in High Performance Foam Market
North America currently dominates the high-performance foam market, followed by Europe and Asia-Pacific. This dominance is driven by several factors:
- North America: Strong construction activity, a robust automotive industry, and early adoption of advanced technologies contribute to the region's leading position.
- Europe: Stringent environmental regulations and a focus on sustainable building practices fuel the demand for high-performance foams in the region.
- Asia-Pacific: Rapid urbanization, industrialization, and economic growth are driving significant market expansion in this region. However, the market is still fragmented with several smaller players, although countries such as China and Japan show substantial growth.
Dominant Segments:
- By Type: Polyurethane foams currently hold the largest market share among different types, driven by their versatility, cost-effectiveness, and excellent performance characteristics. However, silicone foams are expected to exhibit a higher growth rate during the forecast period due to its unique properties in specific applications.
- By End-user Industry: The construction industry commands the largest market share, followed by transportation and electrical and electronics, but the healthcare sector demonstrates promising growth potential.
High Performance Foam Market Product Landscape
High-performance foams are characterized by a wide range of properties tailored to specific applications. Innovations focus on enhancing thermal insulation, sound absorption, shock absorption, and lightweighting capabilities. Products are differentiated by density, cell structure, material composition (open-cell vs closed-cell), and surface treatments. Unique selling propositions often involve improved durability, fire resistance, and recyclability. Technological advancements include the development of nano-structured foams and bio-based alternatives.
Key Drivers, Barriers & Challenges in High Performance Foam Market
Key Drivers:
- Increasing demand from the construction and transportation sectors.
- Rising need for energy-efficient building materials.
- Growing awareness of lightweighting technologies for fuel efficiency.
- Government initiatives promoting sustainable building materials.
Challenges & Restraints:
- Fluctuations in raw material prices, particularly for petrochemical-based foams, can impact profitability.
- Stringent environmental regulations increase manufacturing costs and complexity.
- Intense competition from established players and new entrants. This leads to price pressure and the need for continuous innovation. The competitive landscape is further complicated by the entry of new players in niche markets and regions.
Emerging Opportunities in High Performance Foam Market
- Expanding into untapped markets in developing economies.
- Development of high-performance foams with improved sustainability features (e.g., bio-based foams, recycled content).
- Exploration of new applications in emerging sectors like renewable energy and aerospace.
- Leveraging digital technologies for improved product design, manufacturing, and supply chain management.
Growth Accelerators in the High Performance Foam Market Industry
Strategic collaborations between foam manufacturers and end-user industries are accelerating market growth. Technological advancements such as additive manufacturing and the development of specialized foams with enhanced functionalities are driving innovation and expanding application possibilities. Market expansion into emerging economies and increased investment in R&D are further fueling growth.
Notable Milestones in High Performance Foam Market Sector
- 2020: Introduction of a new bio-based polyurethane foam by X company (hypothetical).
- 2022: Merger between two major players in the high-performance foam industry (hypothetical).
- 2023: Launch of a novel silicone foam with enhanced fire resistance properties by Y company (hypothetical).
In-Depth High Performance Foam Market Market Outlook
The high-performance foam market is poised for significant growth in the coming years, driven by technological innovation, expanding applications, and supportive government policies. Strategic investments in R&D, strategic partnerships, and expansion into new markets are key factors that will shape the future of the industry. The focus on sustainable and eco-friendly products will continue to influence product development and market trends, leading to new opportunities and challenges for market players.
High Performance Foam Market Segmentation
-
1. Type
- 1.1. Silicone
- 1.2. Polyurethane
- 1.3. Polyamide
- 1.4. Polyethylene
- 1.5. Other Types
-
2. End-user Industry
- 2.1. Construction
- 2.2. Transportation
- 2.3. Electrical and Electronics
- 2.4. Packaging
- 2.5. Healthcare
- 2.6. Other End-user Industries
High Performance Foam Market Segmentation By Geography
-
1. Asia Pacific
- 1.1. China
- 1.2. India
- 1.3. Japan
- 1.4. South Korea
- 1.5. ASEAN Countries
- 1.6. Rest of Asia Pacific
-
2. North America
- 2.1. United States
- 2.2. Canada
- 2.3. Mexico
-
3. Europe
- 3.1. Germany
- 3.2. United Kingdom
- 3.3. Italy
- 3.4. France
- 3.5. Spain
- 3.6. Rest of Europe
-
4. South America
- 4.1. Brazil
- 4.2. Argentina
- 4.3. Rest of South America
-
5. Middle East and Africa
- 5.1. Saudi Arabia
- 5.2. South Africa
- 5.3. Rest of Middle East and Africa
High Performance Foam Market Regional Market Share
Geographic Coverage of High Performance Foam Market
High Performance Foam Market REPORT HIGHLIGHTS
| Aspects | Details |
|---|---|
| Study Period | 2020-2034 |
| Base Year | 2025 |
| Estimated Year | 2026 |
| Forecast Period | 2026-2034 |
| Historical Period | 2020-2025 |
| Growth Rate | CAGR of > 8.00% from 2020-2034 |
| Segmentation |
|
Table of Contents
- 1. Introduction
- 1.1. Research Scope
- 1.2. Market Segmentation
- 1.3. Research Objective
- 1.4. Definitions and Assumptions
- 2. Executive Summary
- 2.1. Market Snapshot
- 3. Market Dynamics
- 3.1. Market Drivers
- 3.2. Market Restrains
- 3.3. Market Trends
- 3.4. Market Opportunities
- 4. Market Factor Analysis
- 4.1. Porters Five Forces
- 4.1.1. Bargaining Power of Suppliers
- 4.1.2. Bargaining Power of Buyers
- 4.1.3. Threat of New Entrants
- 4.1.4. Threat of Substitutes
- 4.1.5. Competitive Rivalry
- 4.2. PESTEL analysis
- 4.3. BCG Analysis
- 4.3.1. Stars (High Growth, High Market Share)
- 4.3.2. Cash Cows (Low Growth, High Market Share)
- 4.3.3. Question Mark (High Growth, Low Market Share)
- 4.3.4. Dogs (Low Growth, Low Market Share)
- 4.4. Ansoff Matrix Analysis
- 4.5. Supply Chain Analysis
- 4.6. Regulatory Landscape
- 4.7. Current Market Potential and Opportunity Assessment (TAM–SAM–SOM Framework)
- 4.8. VDR Analyst Note
- 4.1. Porters Five Forces
- 5. Market Analysis, Insights and Forecast 2021-2033
- 5.1. Market Analysis, Insights and Forecast - by Type
- 5.1.1. Silicone
- 5.1.2. Polyurethane
- 5.1.3. Polyamide
- 5.1.4. Polyethylene
- 5.1.5. Other Types
- 5.2. Market Analysis, Insights and Forecast - by End-user Industry
- 5.2.1. Construction
- 5.2.2. Transportation
- 5.2.3. Electrical and Electronics
- 5.2.4. Packaging
- 5.2.5. Healthcare
- 5.2.6. Other End-user Industries
- 5.3. Market Analysis, Insights and Forecast - by Region
- 5.3.1. Asia Pacific
- 5.3.2. North America
- 5.3.3. Europe
- 5.3.4. South America
- 5.3.5. Middle East and Africa
- 5.1. Market Analysis, Insights and Forecast - by Type
- 6. Global High Performance Foam Market Analysis, Insights and Forecast, 2021-2033
- 6.1. Market Analysis, Insights and Forecast - by Type
- 6.1.1. Silicone
- 6.1.2. Polyurethane
- 6.1.3. Polyamide
- 6.1.4. Polyethylene
- 6.1.5. Other Types
- 6.2. Market Analysis, Insights and Forecast - by End-user Industry
- 6.2.1. Construction
- 6.2.2. Transportation
- 6.2.3. Electrical and Electronics
- 6.2.4. Packaging
- 6.2.5. Healthcare
- 6.2.6. Other End-user Industries
- 6.1. Market Analysis, Insights and Forecast - by Type
- 7. Asia Pacific High Performance Foam Market Analysis, Insights and Forecast, 2021-2033
- 7.1. Market Analysis, Insights and Forecast - by Type
- 7.1.1. Silicone
- 7.1.2. Polyurethane
- 7.1.3. Polyamide
- 7.1.4. Polyethylene
- 7.1.5. Other Types
- 7.2. Market Analysis, Insights and Forecast - by End-user Industry
- 7.2.1. Construction
- 7.2.2. Transportation
- 7.2.3. Electrical and Electronics
- 7.2.4. Packaging
- 7.2.5. Healthcare
- 7.2.6. Other End-user Industries
- 7.1. Market Analysis, Insights and Forecast - by Type
- 8. North America High Performance Foam Market Analysis, Insights and Forecast, 2021-2033
- 8.1. Market Analysis, Insights and Forecast - by Type
- 8.1.1. Silicone
- 8.1.2. Polyurethane
- 8.1.3. Polyamide
- 8.1.4. Polyethylene
- 8.1.5. Other Types
- 8.2. Market Analysis, Insights and Forecast - by End-user Industry
- 8.2.1. Construction
- 8.2.2. Transportation
- 8.2.3. Electrical and Electronics
- 8.2.4. Packaging
- 8.2.5. Healthcare
- 8.2.6. Other End-user Industries
- 8.1. Market Analysis, Insights and Forecast - by Type
- 9. Europe High Performance Foam Market Analysis, Insights and Forecast, 2021-2033
- 9.1. Market Analysis, Insights and Forecast - by Type
- 9.1.1. Silicone
- 9.1.2. Polyurethane
- 9.1.3. Polyamide
- 9.1.4. Polyethylene
- 9.1.5. Other Types
- 9.2. Market Analysis, Insights and Forecast - by End-user Industry
- 9.2.1. Construction
- 9.2.2. Transportation
- 9.2.3. Electrical and Electronics
- 9.2.4. Packaging
- 9.2.5. Healthcare
- 9.2.6. Other End-user Industries
- 9.1. Market Analysis, Insights and Forecast - by Type
- 10. South America High Performance Foam Market Analysis, Insights and Forecast, 2021-2033
- 10.1. Market Analysis, Insights and Forecast - by Type
- 10.1.1. Silicone
- 10.1.2. Polyurethane
- 10.1.3. Polyamide
- 10.1.4. Polyethylene
- 10.1.5. Other Types
- 10.2. Market Analysis, Insights and Forecast - by End-user Industry
- 10.2.1. Construction
- 10.2.2. Transportation
- 10.2.3. Electrical and Electronics
- 10.2.4. Packaging
- 10.2.5. Healthcare
- 10.2.6. Other End-user Industries
- 10.1. Market Analysis, Insights and Forecast - by Type
- 11. Middle East and Africa High Performance Foam Market Analysis, Insights and Forecast, 2021-2033
- 11.1. Market Analysis, Insights and Forecast - by Type
- 11.1.1. Silicone
- 11.1.2. Polyurethane
- 11.1.3. Polyamide
- 11.1.4. Polyethylene
- 11.1.5. Other Types
- 11.2. Market Analysis, Insights and Forecast - by End-user Industry
- 11.2.1. Construction
- 11.2.2. Transportation
- 11.2.3. Electrical and Electronics
- 11.2.4. Packaging
- 11.2.5. Healthcare
- 11.2.6. Other End-user Industries
- 11.1. Market Analysis, Insights and Forecast - by Type
- 12. Competitive Analysis
- 12.1. Company Profiles
- 12.1.1 Solvay*List Not Exhaustive
- 12.1.1.1. Company Overview
- 12.1.1.2. Products
- 12.1.1.3. Company Financials
- 12.1.1.4. SWOT Analysis
- 12.1.2 Saint-Gobain
- 12.1.2.1. Company Overview
- 12.1.2.2. Products
- 12.1.2.3. Company Financials
- 12.1.2.4. SWOT Analysis
- 12.1.3 Rogers Corporation
- 12.1.3.1. Company Overview
- 12.1.3.2. Products
- 12.1.3.3. Company Financials
- 12.1.3.4. SWOT Analysis
- 12.1.4 Evonik Industries AG
- 12.1.4.1. Company Overview
- 12.1.4.2. Products
- 12.1.4.3. Company Financials
- 12.1.4.4. SWOT Analysis
- 12.1.5 3M
- 12.1.5.1. Company Overview
- 12.1.5.2. Products
- 12.1.5.3. Company Financials
- 12.1.5.4. SWOT Analysis
- 12.1.6 Armacell
- 12.1.6.1. Company Overview
- 12.1.6.2. Products
- 12.1.6.3. Company Financials
- 12.1.6.4. SWOT Analysis
- 12.1.7 BASF SE
- 12.1.7.1. Company Overview
- 12.1.7.2. Products
- 12.1.7.3. Company Financials
- 12.1.7.4. SWOT Analysis
- 12.1.8 SABIC
- 12.1.8.1. Company Overview
- 12.1.8.2. Products
- 12.1.8.3. Company Financials
- 12.1.8.4. SWOT Analysis
- 12.1.9 DuPont
- 12.1.9.1. Company Overview
- 12.1.9.2. Products
- 12.1.9.3. Company Financials
- 12.1.9.4. SWOT Analysis
- 12.1.10 Zotefoams Plc
- 12.1.10.1. Company Overview
- 12.1.10.2. Products
- 12.1.10.3. Company Financials
- 12.1.10.4. SWOT Analysis
- 12.1.11 Sekisui Alveo
- 12.1.11.1. Company Overview
- 12.1.11.2. Products
- 12.1.11.3. Company Financials
- 12.1.11.4. SWOT Analysis
- 12.1.1 Solvay*List Not Exhaustive
- 12.2. Market Entropy
- 12.2.1 Company's Key Areas Served
- 12.2.2 Recent Developments
- 12.3. Company Market Share Analysis 2025
- 12.3.1 Top 5 Companies Market Share Analysis
- 12.3.2 Top 3 Companies Market Share Analysis
- 12.4. List of Potential Customers
- 13. Research Methodology
List of Figures
- Figure 1: Global High Performance Foam Market Revenue Breakdown (Million, %) by Region 2025 & 2033
- Figure 2: Asia Pacific High Performance Foam Market Revenue (Million), by Type 2025 & 2033
- Figure 3: Asia Pacific High Performance Foam Market Revenue Share (%), by Type 2025 & 2033
- Figure 4: Asia Pacific High Performance Foam Market Revenue (Million), by End-user Industry 2025 & 2033
- Figure 5: Asia Pacific High Performance Foam Market Revenue Share (%), by End-user Industry 2025 & 2033
- Figure 6: Asia Pacific High Performance Foam Market Revenue (Million), by Country 2025 & 2033
- Figure 7: Asia Pacific High Performance Foam Market Revenue Share (%), by Country 2025 & 2033
- Figure 8: North America High Performance Foam Market Revenue (Million), by Type 2025 & 2033
- Figure 9: North America High Performance Foam Market Revenue Share (%), by Type 2025 & 2033
- Figure 10: North America High Performance Foam Market Revenue (Million), by End-user Industry 2025 & 2033
- Figure 11: North America High Performance Foam Market Revenue Share (%), by End-user Industry 2025 & 2033
- Figure 12: North America High Performance Foam Market Revenue (Million), by Country 2025 & 2033
- Figure 13: North America High Performance Foam Market Revenue Share (%), by Country 2025 & 2033
- Figure 14: Europe High Performance Foam Market Revenue (Million), by Type 2025 & 2033
- Figure 15: Europe High Performance Foam Market Revenue Share (%), by Type 2025 & 2033
- Figure 16: Europe High Performance Foam Market Revenue (Million), by End-user Industry 2025 & 2033
- Figure 17: Europe High Performance Foam Market Revenue Share (%), by End-user Industry 2025 & 2033
- Figure 18: Europe High Performance Foam Market Revenue (Million), by Country 2025 & 2033
- Figure 19: Europe High Performance Foam Market Revenue Share (%), by Country 2025 & 2033
- Figure 20: South America High Performance Foam Market Revenue (Million), by Type 2025 & 2033
- Figure 21: South America High Performance Foam Market Revenue Share (%), by Type 2025 & 2033
- Figure 22: South America High Performance Foam Market Revenue (Million), by End-user Industry 2025 & 2033
- Figure 23: South America High Performance Foam Market Revenue Share (%), by End-user Industry 2025 & 2033
- Figure 24: South America High Performance Foam Market Revenue (Million), by Country 2025 & 2033
- Figure 25: South America High Performance Foam Market Revenue Share (%), by Country 2025 & 2033
- Figure 26: Middle East and Africa High Performance Foam Market Revenue (Million), by Type 2025 & 2033
- Figure 27: Middle East and Africa High Performance Foam Market Revenue Share (%), by Type 2025 & 2033
- Figure 28: Middle East and Africa High Performance Foam Market Revenue (Million), by End-user Industry 2025 & 2033
- Figure 29: Middle East and Africa High Performance Foam Market Revenue Share (%), by End-user Industry 2025 & 2033
- Figure 30: Middle East and Africa High Performance Foam Market Revenue (Million), by Country 2025 & 2033
- Figure 31: Middle East and Africa High Performance Foam Market Revenue Share (%), by Country 2025 & 2033
List of Tables
- Table 1: Global High Performance Foam Market Revenue Million Forecast, by Type 2020 & 2033
- Table 2: Global High Performance Foam Market Revenue Million Forecast, by End-user Industry 2020 & 2033
- Table 3: Global High Performance Foam Market Revenue Million Forecast, by Region 2020 & 2033
- Table 4: Global High Performance Foam Market Revenue Million Forecast, by Type 2020 & 2033
- Table 5: Global High Performance Foam Market Revenue Million Forecast, by End-user Industry 2020 & 2033
- Table 6: Global High Performance Foam Market Revenue Million Forecast, by Country 2020 & 2033
- Table 7: China High Performance Foam Market Revenue (Million) Forecast, by Application 2020 & 2033
- Table 8: India High Performance Foam Market Revenue (Million) Forecast, by Application 2020 & 2033
- Table 9: Japan High Performance Foam Market Revenue (Million) Forecast, by Application 2020 & 2033
- Table 10: South Korea High Performance Foam Market Revenue (Million) Forecast, by Application 2020 & 2033
- Table 11: ASEAN Countries High Performance Foam Market Revenue (Million) Forecast, by Application 2020 & 2033
- Table 12: Rest of Asia Pacific High Performance Foam Market Revenue (Million) Forecast, by Application 2020 & 2033
- Table 13: Global High Performance Foam Market Revenue Million Forecast, by Type 2020 & 2033
- Table 14: Global High Performance Foam Market Revenue Million Forecast, by End-user Industry 2020 & 2033
- Table 15: Global High Performance Foam Market Revenue Million Forecast, by Country 2020 & 2033
- Table 16: United States High Performance Foam Market Revenue (Million) Forecast, by Application 2020 & 2033
- Table 17: Canada High Performance Foam Market Revenue (Million) Forecast, by Application 2020 & 2033
- Table 18: Mexico High Performance Foam Market Revenue (Million) Forecast, by Application 2020 & 2033
- Table 19: Global High Performance Foam Market Revenue Million Forecast, by Type 2020 & 2033
- Table 20: Global High Performance Foam Market Revenue Million Forecast, by End-user Industry 2020 & 2033
- Table 21: Global High Performance Foam Market Revenue Million Forecast, by Country 2020 & 2033
- Table 22: Germany High Performance Foam Market Revenue (Million) Forecast, by Application 2020 & 2033
- Table 23: United Kingdom High Performance Foam Market Revenue (Million) Forecast, by Application 2020 & 2033
- Table 24: Italy High Performance Foam Market Revenue (Million) Forecast, by Application 2020 & 2033
- Table 25: France High Performance Foam Market Revenue (Million) Forecast, by Application 2020 & 2033
- Table 26: Spain High Performance Foam Market Revenue (Million) Forecast, by Application 2020 & 2033
- Table 27: Rest of Europe High Performance Foam Market Revenue (Million) Forecast, by Application 2020 & 2033
- Table 28: Global High Performance Foam Market Revenue Million Forecast, by Type 2020 & 2033
- Table 29: Global High Performance Foam Market Revenue Million Forecast, by End-user Industry 2020 & 2033
- Table 30: Global High Performance Foam Market Revenue Million Forecast, by Country 2020 & 2033
- Table 31: Brazil High Performance Foam Market Revenue (Million) Forecast, by Application 2020 & 2033
- Table 32: Argentina High Performance Foam Market Revenue (Million) Forecast, by Application 2020 & 2033
- Table 33: Rest of South America High Performance Foam Market Revenue (Million) Forecast, by Application 2020 & 2033
- Table 34: Global High Performance Foam Market Revenue Million Forecast, by Type 2020 & 2033
- Table 35: Global High Performance Foam Market Revenue Million Forecast, by End-user Industry 2020 & 2033
- Table 36: Global High Performance Foam Market Revenue Million Forecast, by Country 2020 & 2033
- Table 37: Saudi Arabia High Performance Foam Market Revenue (Million) Forecast, by Application 2020 & 2033
- Table 38: South Africa High Performance Foam Market Revenue (Million) Forecast, by Application 2020 & 2033
- Table 39: Rest of Middle East and Africa High Performance Foam Market Revenue (Million) Forecast, by Application 2020 & 2033
Frequently Asked Questions
1. What is the projected Compound Annual Growth Rate (CAGR) of the High Performance Foam Market?
The projected CAGR is approximately > 8.00%.
2. Which companies are prominent players in the High Performance Foam Market?
Key companies in the market include Solvay*List Not Exhaustive, Saint-Gobain, Rogers Corporation, Evonik Industries AG, 3M, Armacell, BASF SE, SABIC, DuPont, Zotefoams Plc, Sekisui Alveo.
3. What are the main segments of the High Performance Foam Market?
The market segments include Type, End-user Industry.
4. Can you provide details about the market size?
The market size is estimated to be USD XX Million as of 2022.
5. What are some drivers contributing to market growth?
; Increasing Usage in the Automotive Industry; Increasing Demand from Healthcare Sector for Dressing Wounds.
6. What are the notable trends driving market growth?
Increasing Usage in the Automotive Industry.
7. Are there any restraints impacting market growth?
; High Initial Investment; Impact of COVID-19 Pandemic.
8. Can you provide examples of recent developments in the market?
N/A
9. What pricing options are available for accessing the report?
Pricing options include single-user, multi-user, and enterprise licenses priced at USD 4750, USD 5250, and USD 8750 respectively.
10. Is the market size provided in terms of value or volume?
The market size is provided in terms of value, measured in Million.
11. Are there any specific market keywords associated with the report?
Yes, the market keyword associated with the report is "High Performance Foam Market," which aids in identifying and referencing the specific market segment covered.
12. How do I determine which pricing option suits my needs best?
The pricing options vary based on user requirements and access needs. Individual users may opt for single-user licenses, while businesses requiring broader access may choose multi-user or enterprise licenses for cost-effective access to the report.
13. Are there any additional resources or data provided in the High Performance Foam Market report?
While the report offers comprehensive insights, it's advisable to review the specific contents or supplementary materials provided to ascertain if additional resources or data are available.
14. How can I stay updated on further developments or reports in the High Performance Foam Market?
To stay informed about further developments, trends, and reports in the High Performance Foam Market, consider subscribing to industry newsletters, following relevant companies and organizations, or regularly checking reputable industry news sources and publications.
Methodology
Step 1 - Identification of Relevant Samples Size from Population Database


Step 2 - Approaches for Defining Global Market Size (Value, Volume* & Price*)

Note*: In applicable scenarios
Step 3 - Data Sources
Primary Research
- Web Analytics
- Survey Reports
- Research Institute
- Latest Research Reports
- Opinion Leaders
Secondary Research
- Annual Reports
- White Paper
- Latest Press Release
- Industry Association
- Paid Database
- Investor Presentations

Step 4 - Data Triangulation
Involves using different sources of information in order to increase the validity of a study
These sources are likely to be stakeholders in a program - participants, other researchers, program staff, other community members, and so on.
Then we put all data in single framework & apply various statistical tools to find out the dynamic on the market.
During the analysis stage, feedback from the stakeholder groups would be compared to determine areas of agreement as well as areas of divergence