

Key Insights
The global mineral spirits market, valued at approximately $10.68 billion in 2025, is projected to experience significant expansion with a Compound Annual Growth Rate (CAGR) of 11.93% from 2025 to 2033. This robust growth is driven by escalating demand across key applications, including paint thinners, industrial cleaning agents, and degreasers. The expanding construction and automotive sectors are primary contributors, utilizing mineral spirits in paints, coatings, and essential cleaning solutions. Furthermore, its cost-effectiveness and effectiveness as a solvent in diverse industrial processes are key growth enablers. The market is segmented by grade (low-flash, regular-flash, high-flash) and application, with paint thinners and cleaning agents holding substantial market share. However, stringent environmental regulations on volatile organic compounds (VOCs) and the increasing adoption of eco-friendly alternatives present notable challenges.
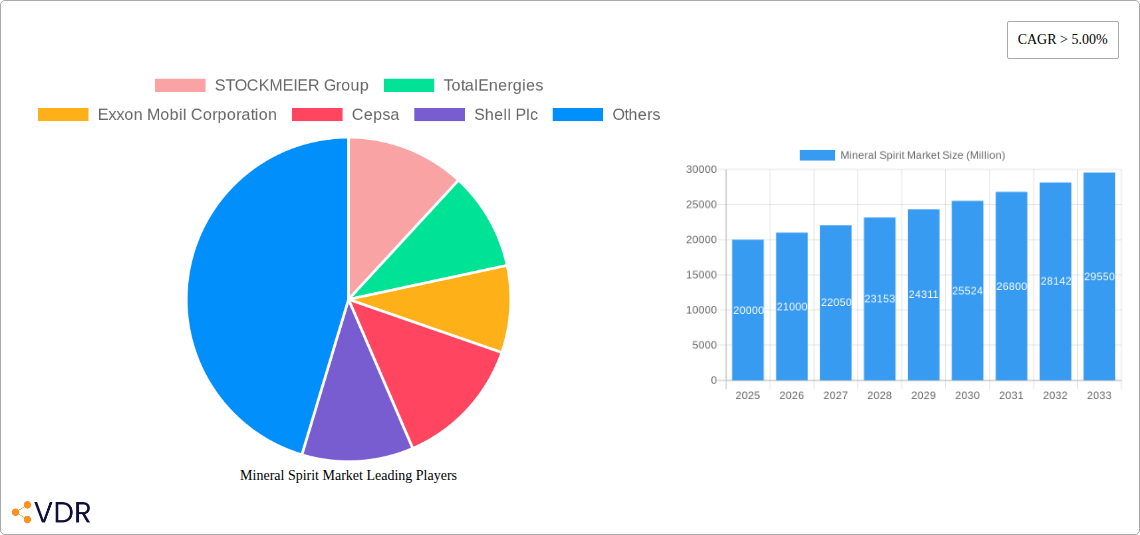
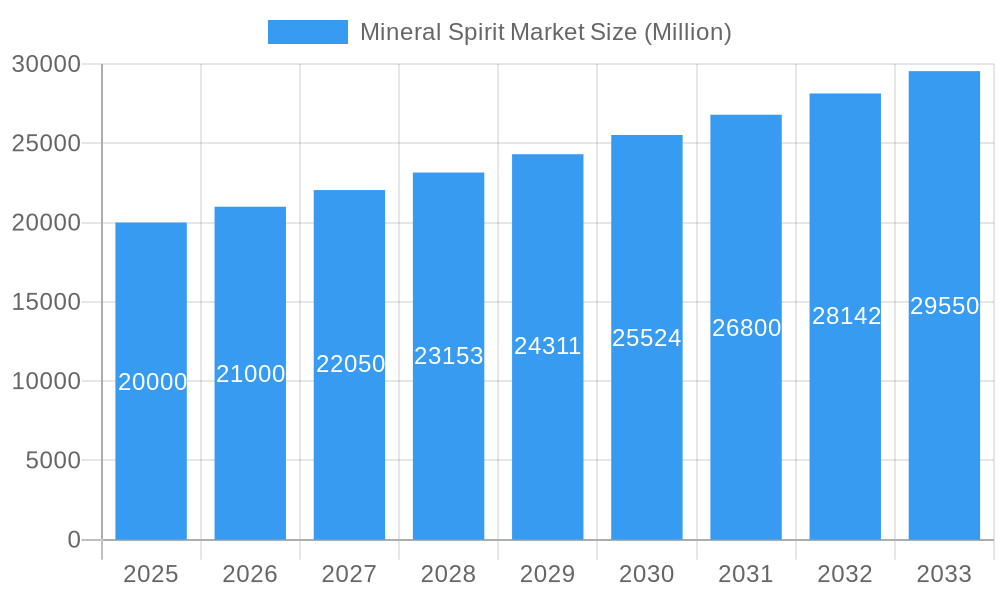
Mineral Spirit Market Market Size (In Billion)
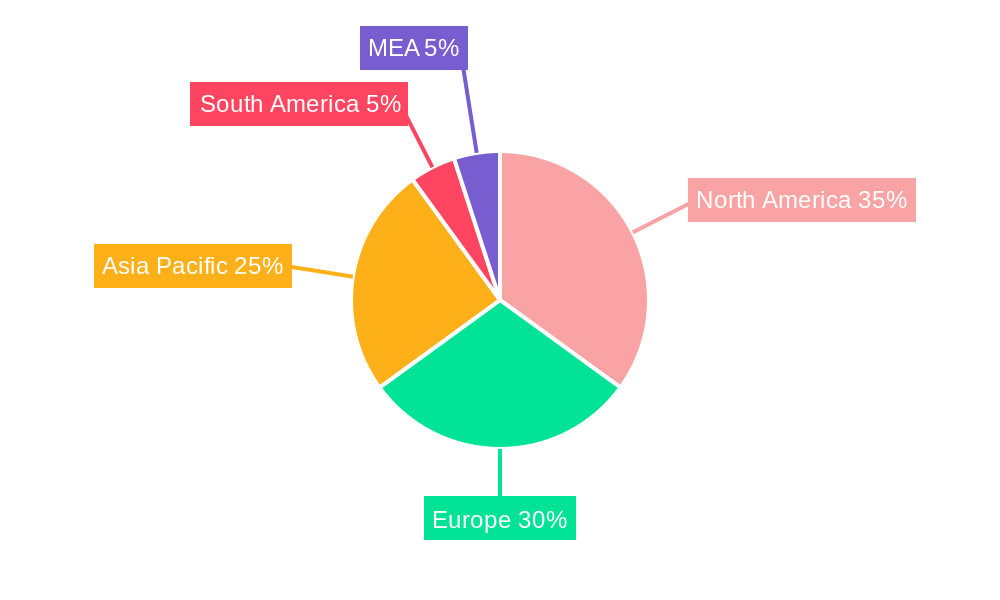
Established market leaders such as STOCKMEIER Group, TotalEnergies, and Exxon Mobil Corporation, alongside regional enterprises, define the competitive landscape. Geographic expansion into emerging economies, particularly within the Asia-Pacific and South America regions, is anticipated to unlock significant opportunities. North America and Europe exhibit strong market presence due to mature industries and regulatory environments. Conversely, the Asia-Pacific region, led by China and India, is poised for substantial growth driven by rapid industrialization. Future market dynamics will likely be shaped by strategic alliances, technological innovations in low-VOC formulations, and the exploration of novel application areas. Despite regulatory hurdles, the mineral spirits market's intrinsic value proposition, stemming from its broad utility and economic viability, ensures sustained demand. A strategic focus on innovation and sustainable practices is crucial for maintaining market competitiveness and attracting environmentally aware consumers.
Mineral Spirit Market Company Market Share
Mineral Spirit Market: A Comprehensive Report (2019-2033)
This in-depth report provides a comprehensive analysis of the global Mineral Spirit Market, encompassing market dynamics, growth trends, regional dominance, product landscape, key players, and future outlook. The study period covers 2019-2033, with 2025 as the base and estimated year. This report is essential for industry professionals, investors, and strategic decision-makers seeking a detailed understanding of this vital sector. The parent market is the Chemical solvents market and the child market is the aliphatic solvents market.
Mineral Spirit Market Dynamics & Structure
This section analyzes the Mineral Spirit market's competitive landscape, technological advancements, regulatory environment, and market forces. The market is moderately concentrated, with key players such as STOCKMEIER Group, TotalEnergies, and Exxon Mobil Corporation holding significant shares. Technological innovation focuses on enhancing product purity, reducing environmental impact, and developing specialized grades for specific applications. Stringent environmental regulations influence production processes and product formulations. Competitive substitutes include other solvents, but mineral spirits retain a strong position due to their cost-effectiveness and versatility. Market consolidation through mergers and acquisitions (M&A) is observed, with xx deals recorded between 2019 and 2024, representing a xx% increase compared to the previous period. End-user demographics are diverse, spanning various industries.
- Market Concentration: Moderately concentrated, with top 5 players holding approximately xx% market share in 2024.
- Technological Innovation: Focus on improved purity, reduced VOCs, and specialized grades.
- Regulatory Framework: Stringent environmental regulations impacting production and formulation.
- Competitive Substitutes: Other solvents, but mineral spirits maintain a strong position due to cost-effectiveness.
- M&A Activity: xx deals between 2019-2024, representing xx% increase compared to the previous period.
- Innovation Barriers: High capital investment for new technologies, stringent regulatory compliance.
Mineral Spirit Market Growth Trends & Insights
The global Mineral Spirit market experienced significant growth during the historical period (2019-2024), expanding from xx million units in 2019 to xx million units in 2024, exhibiting a CAGR of xx%. This growth is driven by increasing demand across various applications, particularly in the paint thinner and degreasing agent segments. Technological advancements, such as the development of low-VOC mineral spirits, are further driving adoption. Consumer behavior shifts towards environmentally friendly products are influencing market trends. The forecast period (2025-2033) projects continued growth, with the market expected to reach xx million units by 2033, driven by factors including increasing industrialization in developing economies and the rising demand for sustainable solutions. The market penetration is expected to reach xx% by 2033.
Dominant Regions, Countries, or Segments in Mineral Spirit Market
The North American region holds the largest market share, followed by Asia Pacific. Within grades, the Regular-flash grade dominates, accounting for xx% of the market in 2024. The paint thinner application segment is the largest end-use sector, driven by growth in the construction and automotive industries.
- Leading Region: North America (xx% market share in 2024)
- Key Country: United States (xx% of North American market in 2024)
- Dominant Grade: Regular-flash Grade (xx% market share in 2024)
- Largest Application: Paint Thinner (xx% market share in 2024)
- Growth Drivers: Increasing industrialization, construction activity, and automotive production in key regions.
Mineral Spirit Market Product Landscape
Mineral spirits are offered in various grades (low-flash, regular-flash, high-flash), each tailored to specific applications. Recent innovations focus on improved purity, reduced volatile organic compound (VOC) content, and enhanced performance characteristics, aligning with stricter environmental regulations. The unique selling proposition for various grades lies in their specific flash points and applications. Advancements in refining technologies lead to greater efficiency and reduced environmental impact.
Key Drivers, Barriers & Challenges in Mineral Spirit Market
Key Drivers:
- Growing demand from diverse industries (paints, coatings, cleaning).
- Increasing industrialization and construction activities in developing economies.
- Development of low-VOC and eco-friendly mineral spirit formulations.
Challenges & Restraints:
- Fluctuating crude oil prices impacting production costs.
- Stringent environmental regulations and compliance requirements.
- Intense competition from alternative solvents. The impact of these challenges is estimated to reduce the market CAGR by approximately xx% between 2025 and 2033.
Emerging Opportunities in Mineral Spirit Market
Emerging opportunities include expansion into untapped markets in developing economies, the development of specialized grades for niche applications, and catering to the increasing demand for sustainable and environmentally friendly solvents. The focus on biodegradable and renewable-based mineral spirits presents significant opportunities for growth.
Growth Accelerators in the Mineral Spirit Market Industry
Technological advancements in refining processes, leading to improved product quality and reduced environmental impact, are key growth accelerators. Strategic partnerships between producers and end-users facilitate the development of customized solutions. Market expansion into new geographical regions, especially in developing economies experiencing rapid industrialization, further fuels growth.
Key Players Shaping the Mineral Spirit Market Market
- STOCKMEIER Group
- TotalEnergies
- Exxon Mobil Corporation
- Cepsa
- Shell Plc
- KH Chemicals
- HCS Group GmbH
- DHC Solvent Chemie GmbH
- Neste
- Kuwaitintlfactory
- KAPCO PETROLEUM INDUSTRIES FZC
- Al Sanea
- Mehta Petro Refineries Limited
Notable Milestones in Mineral Spirit Market Sector
- December 2022: ExxonMobil announces a five-year corporate plan, increasing investment in lower-emission projects to approximately USD 17 billion by 2027. This signals a shift towards sustainability in the industry.
- July 2022: Adnoc Distribution's acquisition of a 50% stake in TotalEnergies Marketing Egypt and its white spirit supply agreement with Adnoc signifies increased market consolidation and potential for enhanced market share.
In-Depth Mineral Spirit Market Market Outlook
The Mineral Spirit market is poised for continued growth, driven by ongoing industrialization, increasing demand from various sectors, and the development of more sustainable products. Strategic investments in research and development, along with expansion into new markets, present significant opportunities for growth and profitability. The focus on environmentally friendly solutions will further shape market dynamics and drive future innovation.
Mineral Spirit Market Segmentation
-
1. Grade
- 1.1. Low-flash Grade
- 1.2. Regular-flash Grade
- 1.3. High-flash Grade
-
2. Application
- 2.1. Paint Thinner
- 2.2. Cleansing Agent
- 2.3. Degreasing Agent
- 2.4. Fuel
- 2.5. Disinfectant
- 2.6. Other Applications
Mineral Spirit Market Segmentation By Geography
-
1. Asia Pacific
- 1.1. China
- 1.2. India
- 1.3. Japan
- 1.4. South Korea
- 1.5. Rest of Asia Pacific
-
2. North America
- 2.1. United States
- 2.2. Canada
- 2.3. Mexico
-
3. Europe
- 3.1. Germany
- 3.2. United Kingdom
- 3.3. Italy
- 3.4. France
- 3.5. Rest of Europe
-
4. South America
- 4.1. Brazil
- 4.2. Argentina
- 4.3. Rest of South America
-
5. Middle East and Africa
- 5.1. Saudi Arabia
- 5.2. South Africa
- 5.3. Rest of Middle East and Africa
Mineral Spirit Market Regional Market Share
Geographic Coverage of Mineral Spirit Market
Mineral Spirit Market REPORT HIGHLIGHTS
| Aspects | Details |
|---|---|
| Study Period | 2020-2034 |
| Base Year | 2025 |
| Estimated Year | 2026 |
| Forecast Period | 2026-2034 |
| Historical Period | 2020-2025 |
| Growth Rate | CAGR of 11.93% from 2020-2034 |
| Segmentation |
|
Table of Contents
- 1. Introduction
- 1.1. Research Scope
- 1.2. Market Segmentation
- 1.3. Research Objective
- 1.4. Definitions and Assumptions
- 2. Executive Summary
- 2.1. Market Snapshot
- 3. Market Dynamics
- 3.1. Market Drivers
- 3.2. Market Restrains
- 3.3. Market Trends
- 3.4. Market Opportunities
- 4. Market Factor Analysis
- 4.1. Porters Five Forces
- 4.1.1. Bargaining Power of Suppliers
- 4.1.2. Bargaining Power of Buyers
- 4.1.3. Threat of New Entrants
- 4.1.4. Threat of Substitutes
- 4.1.5. Competitive Rivalry
- 4.2. PESTEL analysis
- 4.3. BCG Analysis
- 4.3.1. Stars (High Growth, High Market Share)
- 4.3.2. Cash Cows (Low Growth, High Market Share)
- 4.3.3. Question Mark (High Growth, Low Market Share)
- 4.3.4. Dogs (Low Growth, Low Market Share)
- 4.4. Ansoff Matrix Analysis
- 4.5. Supply Chain Analysis
- 4.6. Regulatory Landscape
- 4.7. Current Market Potential and Opportunity Assessment (TAM–SAM–SOM Framework)
- 4.8. VDR Analyst Note
- 4.1. Porters Five Forces
- 5. Market Analysis, Insights and Forecast 2021-2033
- 5.1. Market Analysis, Insights and Forecast - by Grade
- 5.1.1. Low-flash Grade
- 5.1.2. Regular-flash Grade
- 5.1.3. High-flash Grade
- 5.2. Market Analysis, Insights and Forecast - by Application
- 5.2.1. Paint Thinner
- 5.2.2. Cleansing Agent
- 5.2.3. Degreasing Agent
- 5.2.4. Fuel
- 5.2.5. Disinfectant
- 5.2.6. Other Applications
- 5.3. Market Analysis, Insights and Forecast - by Region
- 5.3.1. Asia Pacific
- 5.3.2. North America
- 5.3.3. Europe
- 5.3.4. South America
- 5.3.5. Middle East and Africa
- 5.1. Market Analysis, Insights and Forecast - by Grade
- 6. Global Mineral Spirit Market Analysis, Insights and Forecast, 2021-2033
- 6.1. Market Analysis, Insights and Forecast - by Grade
- 6.1.1. Low-flash Grade
- 6.1.2. Regular-flash Grade
- 6.1.3. High-flash Grade
- 6.2. Market Analysis, Insights and Forecast - by Application
- 6.2.1. Paint Thinner
- 6.2.2. Cleansing Agent
- 6.2.3. Degreasing Agent
- 6.2.4. Fuel
- 6.2.5. Disinfectant
- 6.2.6. Other Applications
- 6.1. Market Analysis, Insights and Forecast - by Grade
- 7. Asia Pacific Mineral Spirit Market Analysis, Insights and Forecast, 2021-2033
- 7.1. Market Analysis, Insights and Forecast - by Grade
- 7.1.1. Low-flash Grade
- 7.1.2. Regular-flash Grade
- 7.1.3. High-flash Grade
- 7.2. Market Analysis, Insights and Forecast - by Application
- 7.2.1. Paint Thinner
- 7.2.2. Cleansing Agent
- 7.2.3. Degreasing Agent
- 7.2.4. Fuel
- 7.2.5. Disinfectant
- 7.2.6. Other Applications
- 7.1. Market Analysis, Insights and Forecast - by Grade
- 8. North America Mineral Spirit Market Analysis, Insights and Forecast, 2021-2033
- 8.1. Market Analysis, Insights and Forecast - by Grade
- 8.1.1. Low-flash Grade
- 8.1.2. Regular-flash Grade
- 8.1.3. High-flash Grade
- 8.2. Market Analysis, Insights and Forecast - by Application
- 8.2.1. Paint Thinner
- 8.2.2. Cleansing Agent
- 8.2.3. Degreasing Agent
- 8.2.4. Fuel
- 8.2.5. Disinfectant
- 8.2.6. Other Applications
- 8.1. Market Analysis, Insights and Forecast - by Grade
- 9. Europe Mineral Spirit Market Analysis, Insights and Forecast, 2021-2033
- 9.1. Market Analysis, Insights and Forecast - by Grade
- 9.1.1. Low-flash Grade
- 9.1.2. Regular-flash Grade
- 9.1.3. High-flash Grade
- 9.2. Market Analysis, Insights and Forecast - by Application
- 9.2.1. Paint Thinner
- 9.2.2. Cleansing Agent
- 9.2.3. Degreasing Agent
- 9.2.4. Fuel
- 9.2.5. Disinfectant
- 9.2.6. Other Applications
- 9.1. Market Analysis, Insights and Forecast - by Grade
- 10. South America Mineral Spirit Market Analysis, Insights and Forecast, 2021-2033
- 10.1. Market Analysis, Insights and Forecast - by Grade
- 10.1.1. Low-flash Grade
- 10.1.2. Regular-flash Grade
- 10.1.3. High-flash Grade
- 10.2. Market Analysis, Insights and Forecast - by Application
- 10.2.1. Paint Thinner
- 10.2.2. Cleansing Agent
- 10.2.3. Degreasing Agent
- 10.2.4. Fuel
- 10.2.5. Disinfectant
- 10.2.6. Other Applications
- 10.1. Market Analysis, Insights and Forecast - by Grade
- 11. Middle East and Africa Mineral Spirit Market Analysis, Insights and Forecast, 2021-2033
- 11.1. Market Analysis, Insights and Forecast - by Grade
- 11.1.1. Low-flash Grade
- 11.1.2. Regular-flash Grade
- 11.1.3. High-flash Grade
- 11.2. Market Analysis, Insights and Forecast - by Application
- 11.2.1. Paint Thinner
- 11.2.2. Cleansing Agent
- 11.2.3. Degreasing Agent
- 11.2.4. Fuel
- 11.2.5. Disinfectant
- 11.2.6. Other Applications
- 11.1. Market Analysis, Insights and Forecast - by Grade
- 12. Competitive Analysis
- 12.1. Company Profiles
- 12.1.1 STOCKMEIER Group
- 12.1.1.1. Company Overview
- 12.1.1.2. Products
- 12.1.1.3. Company Financials
- 12.1.1.4. SWOT Analysis
- 12.1.2 TotalEnergies
- 12.1.2.1. Company Overview
- 12.1.2.2. Products
- 12.1.2.3. Company Financials
- 12.1.2.4. SWOT Analysis
- 12.1.3 Exxon Mobil Corporation
- 12.1.3.1. Company Overview
- 12.1.3.2. Products
- 12.1.3.3. Company Financials
- 12.1.3.4. SWOT Analysis
- 12.1.4 Cepsa
- 12.1.4.1. Company Overview
- 12.1.4.2. Products
- 12.1.4.3. Company Financials
- 12.1.4.4. SWOT Analysis
- 12.1.5 Shell Plc
- 12.1.5.1. Company Overview
- 12.1.5.2. Products
- 12.1.5.3. Company Financials
- 12.1.5.4. SWOT Analysis
- 12.1.6 KH Chemicals
- 12.1.6.1. Company Overview
- 12.1.6.2. Products
- 12.1.6.3. Company Financials
- 12.1.6.4. SWOT Analysis
- 12.1.7 HCS Group GmbH
- 12.1.7.1. Company Overview
- 12.1.7.2. Products
- 12.1.7.3. Company Financials
- 12.1.7.4. SWOT Analysis
- 12.1.8 DHC Solvent Chemie GmbH
- 12.1.8.1. Company Overview
- 12.1.8.2. Products
- 12.1.8.3. Company Financials
- 12.1.8.4. SWOT Analysis
- 12.1.9 Neste
- 12.1.9.1. Company Overview
- 12.1.9.2. Products
- 12.1.9.3. Company Financials
- 12.1.9.4. SWOT Analysis
- 12.1.10 Kuwaitintlfactory
- 12.1.10.1. Company Overview
- 12.1.10.2. Products
- 12.1.10.3. Company Financials
- 12.1.10.4. SWOT Analysis
- 12.1.11 KAPCO PETROLEUM INDUSTRIES FZC
- 12.1.11.1. Company Overview
- 12.1.11.2. Products
- 12.1.11.3. Company Financials
- 12.1.11.4. SWOT Analysis
- 12.1.12 Al Sanea
- 12.1.12.1. Company Overview
- 12.1.12.2. Products
- 12.1.12.3. Company Financials
- 12.1.12.4. SWOT Analysis
- 12.1.13 Mehta Petro Refineries Limited
- 12.1.13.1. Company Overview
- 12.1.13.2. Products
- 12.1.13.3. Company Financials
- 12.1.13.4. SWOT Analysis
- 12.1.1 STOCKMEIER Group
- 12.2. Market Entropy
- 12.2.1 Company's Key Areas Served
- 12.2.2 Recent Developments
- 12.3. Company Market Share Analysis 2025
- 12.3.1 Top 5 Companies Market Share Analysis
- 12.3.2 Top 3 Companies Market Share Analysis
- 12.4. List of Potential Customers
- 13. Research Methodology
List of Figures
- Figure 1: Global Mineral Spirit Market Revenue Breakdown (billion, %) by Region 2025 & 2033
- Figure 2: Global Mineral Spirit Market Volume Breakdown (K Litres, %) by Region 2025 & 2033
- Figure 3: Asia Pacific Mineral Spirit Market Revenue (billion), by Grade 2025 & 2033
- Figure 4: Asia Pacific Mineral Spirit Market Volume (K Litres), by Grade 2025 & 2033
- Figure 5: Asia Pacific Mineral Spirit Market Revenue Share (%), by Grade 2025 & 2033
- Figure 6: Asia Pacific Mineral Spirit Market Volume Share (%), by Grade 2025 & 2033
- Figure 7: Asia Pacific Mineral Spirit Market Revenue (billion), by Application 2025 & 2033
- Figure 8: Asia Pacific Mineral Spirit Market Volume (K Litres), by Application 2025 & 2033
- Figure 9: Asia Pacific Mineral Spirit Market Revenue Share (%), by Application 2025 & 2033
- Figure 10: Asia Pacific Mineral Spirit Market Volume Share (%), by Application 2025 & 2033
- Figure 11: Asia Pacific Mineral Spirit Market Revenue (billion), by Country 2025 & 2033
- Figure 12: Asia Pacific Mineral Spirit Market Volume (K Litres), by Country 2025 & 2033
- Figure 13: Asia Pacific Mineral Spirit Market Revenue Share (%), by Country 2025 & 2033
- Figure 14: Asia Pacific Mineral Spirit Market Volume Share (%), by Country 2025 & 2033
- Figure 15: North America Mineral Spirit Market Revenue (billion), by Grade 2025 & 2033
- Figure 16: North America Mineral Spirit Market Volume (K Litres), by Grade 2025 & 2033
- Figure 17: North America Mineral Spirit Market Revenue Share (%), by Grade 2025 & 2033
- Figure 18: North America Mineral Spirit Market Volume Share (%), by Grade 2025 & 2033
- Figure 19: North America Mineral Spirit Market Revenue (billion), by Application 2025 & 2033
- Figure 20: North America Mineral Spirit Market Volume (K Litres), by Application 2025 & 2033
- Figure 21: North America Mineral Spirit Market Revenue Share (%), by Application 2025 & 2033
- Figure 22: North America Mineral Spirit Market Volume Share (%), by Application 2025 & 2033
- Figure 23: North America Mineral Spirit Market Revenue (billion), by Country 2025 & 2033
- Figure 24: North America Mineral Spirit Market Volume (K Litres), by Country 2025 & 2033
- Figure 25: North America Mineral Spirit Market Revenue Share (%), by Country 2025 & 2033
- Figure 26: North America Mineral Spirit Market Volume Share (%), by Country 2025 & 2033
- Figure 27: Europe Mineral Spirit Market Revenue (billion), by Grade 2025 & 2033
- Figure 28: Europe Mineral Spirit Market Volume (K Litres), by Grade 2025 & 2033
- Figure 29: Europe Mineral Spirit Market Revenue Share (%), by Grade 2025 & 2033
- Figure 30: Europe Mineral Spirit Market Volume Share (%), by Grade 2025 & 2033
- Figure 31: Europe Mineral Spirit Market Revenue (billion), by Application 2025 & 2033
- Figure 32: Europe Mineral Spirit Market Volume (K Litres), by Application 2025 & 2033
- Figure 33: Europe Mineral Spirit Market Revenue Share (%), by Application 2025 & 2033
- Figure 34: Europe Mineral Spirit Market Volume Share (%), by Application 2025 & 2033
- Figure 35: Europe Mineral Spirit Market Revenue (billion), by Country 2025 & 2033
- Figure 36: Europe Mineral Spirit Market Volume (K Litres), by Country 2025 & 2033
- Figure 37: Europe Mineral Spirit Market Revenue Share (%), by Country 2025 & 2033
- Figure 38: Europe Mineral Spirit Market Volume Share (%), by Country 2025 & 2033
- Figure 39: South America Mineral Spirit Market Revenue (billion), by Grade 2025 & 2033
- Figure 40: South America Mineral Spirit Market Volume (K Litres), by Grade 2025 & 2033
- Figure 41: South America Mineral Spirit Market Revenue Share (%), by Grade 2025 & 2033
- Figure 42: South America Mineral Spirit Market Volume Share (%), by Grade 2025 & 2033
- Figure 43: South America Mineral Spirit Market Revenue (billion), by Application 2025 & 2033
- Figure 44: South America Mineral Spirit Market Volume (K Litres), by Application 2025 & 2033
- Figure 45: South America Mineral Spirit Market Revenue Share (%), by Application 2025 & 2033
- Figure 46: South America Mineral Spirit Market Volume Share (%), by Application 2025 & 2033
- Figure 47: South America Mineral Spirit Market Revenue (billion), by Country 2025 & 2033
- Figure 48: South America Mineral Spirit Market Volume (K Litres), by Country 2025 & 2033
- Figure 49: South America Mineral Spirit Market Revenue Share (%), by Country 2025 & 2033
- Figure 50: South America Mineral Spirit Market Volume Share (%), by Country 2025 & 2033
- Figure 51: Middle East and Africa Mineral Spirit Market Revenue (billion), by Grade 2025 & 2033
- Figure 52: Middle East and Africa Mineral Spirit Market Volume (K Litres), by Grade 2025 & 2033
- Figure 53: Middle East and Africa Mineral Spirit Market Revenue Share (%), by Grade 2025 & 2033
- Figure 54: Middle East and Africa Mineral Spirit Market Volume Share (%), by Grade 2025 & 2033
- Figure 55: Middle East and Africa Mineral Spirit Market Revenue (billion), by Application 2025 & 2033
- Figure 56: Middle East and Africa Mineral Spirit Market Volume (K Litres), by Application 2025 & 2033
- Figure 57: Middle East and Africa Mineral Spirit Market Revenue Share (%), by Application 2025 & 2033
- Figure 58: Middle East and Africa Mineral Spirit Market Volume Share (%), by Application 2025 & 2033
- Figure 59: Middle East and Africa Mineral Spirit Market Revenue (billion), by Country 2025 & 2033
- Figure 60: Middle East and Africa Mineral Spirit Market Volume (K Litres), by Country 2025 & 2033
- Figure 61: Middle East and Africa Mineral Spirit Market Revenue Share (%), by Country 2025 & 2033
- Figure 62: Middle East and Africa Mineral Spirit Market Volume Share (%), by Country 2025 & 2033
List of Tables
- Table 1: Global Mineral Spirit Market Revenue billion Forecast, by Grade 2020 & 2033
- Table 2: Global Mineral Spirit Market Volume K Litres Forecast, by Grade 2020 & 2033
- Table 3: Global Mineral Spirit Market Revenue billion Forecast, by Application 2020 & 2033
- Table 4: Global Mineral Spirit Market Volume K Litres Forecast, by Application 2020 & 2033
- Table 5: Global Mineral Spirit Market Revenue billion Forecast, by Region 2020 & 2033
- Table 6: Global Mineral Spirit Market Volume K Litres Forecast, by Region 2020 & 2033
- Table 7: Global Mineral Spirit Market Revenue billion Forecast, by Grade 2020 & 2033
- Table 8: Global Mineral Spirit Market Volume K Litres Forecast, by Grade 2020 & 2033
- Table 9: Global Mineral Spirit Market Revenue billion Forecast, by Application 2020 & 2033
- Table 10: Global Mineral Spirit Market Volume K Litres Forecast, by Application 2020 & 2033
- Table 11: Global Mineral Spirit Market Revenue billion Forecast, by Country 2020 & 2033
- Table 12: Global Mineral Spirit Market Volume K Litres Forecast, by Country 2020 & 2033
- Table 13: China Mineral Spirit Market Revenue (billion) Forecast, by Application 2020 & 2033
- Table 14: China Mineral Spirit Market Volume (K Litres) Forecast, by Application 2020 & 2033
- Table 15: India Mineral Spirit Market Revenue (billion) Forecast, by Application 2020 & 2033
- Table 16: India Mineral Spirit Market Volume (K Litres) Forecast, by Application 2020 & 2033
- Table 17: Japan Mineral Spirit Market Revenue (billion) Forecast, by Application 2020 & 2033
- Table 18: Japan Mineral Spirit Market Volume (K Litres) Forecast, by Application 2020 & 2033
- Table 19: South Korea Mineral Spirit Market Revenue (billion) Forecast, by Application 2020 & 2033
- Table 20: South Korea Mineral Spirit Market Volume (K Litres) Forecast, by Application 2020 & 2033
- Table 21: Rest of Asia Pacific Mineral Spirit Market Revenue (billion) Forecast, by Application 2020 & 2033
- Table 22: Rest of Asia Pacific Mineral Spirit Market Volume (K Litres) Forecast, by Application 2020 & 2033
- Table 23: Global Mineral Spirit Market Revenue billion Forecast, by Grade 2020 & 2033
- Table 24: Global Mineral Spirit Market Volume K Litres Forecast, by Grade 2020 & 2033
- Table 25: Global Mineral Spirit Market Revenue billion Forecast, by Application 2020 & 2033
- Table 26: Global Mineral Spirit Market Volume K Litres Forecast, by Application 2020 & 2033
- Table 27: Global Mineral Spirit Market Revenue billion Forecast, by Country 2020 & 2033
- Table 28: Global Mineral Spirit Market Volume K Litres Forecast, by Country 2020 & 2033
- Table 29: United States Mineral Spirit Market Revenue (billion) Forecast, by Application 2020 & 2033
- Table 30: United States Mineral Spirit Market Volume (K Litres) Forecast, by Application 2020 & 2033
- Table 31: Canada Mineral Spirit Market Revenue (billion) Forecast, by Application 2020 & 2033
- Table 32: Canada Mineral Spirit Market Volume (K Litres) Forecast, by Application 2020 & 2033
- Table 33: Mexico Mineral Spirit Market Revenue (billion) Forecast, by Application 2020 & 2033
- Table 34: Mexico Mineral Spirit Market Volume (K Litres) Forecast, by Application 2020 & 2033
- Table 35: Global Mineral Spirit Market Revenue billion Forecast, by Grade 2020 & 2033
- Table 36: Global Mineral Spirit Market Volume K Litres Forecast, by Grade 2020 & 2033
- Table 37: Global Mineral Spirit Market Revenue billion Forecast, by Application 2020 & 2033
- Table 38: Global Mineral Spirit Market Volume K Litres Forecast, by Application 2020 & 2033
- Table 39: Global Mineral Spirit Market Revenue billion Forecast, by Country 2020 & 2033
- Table 40: Global Mineral Spirit Market Volume K Litres Forecast, by Country 2020 & 2033
- Table 41: Germany Mineral Spirit Market Revenue (billion) Forecast, by Application 2020 & 2033
- Table 42: Germany Mineral Spirit Market Volume (K Litres) Forecast, by Application 2020 & 2033
- Table 43: United Kingdom Mineral Spirit Market Revenue (billion) Forecast, by Application 2020 & 2033
- Table 44: United Kingdom Mineral Spirit Market Volume (K Litres) Forecast, by Application 2020 & 2033
- Table 45: Italy Mineral Spirit Market Revenue (billion) Forecast, by Application 2020 & 2033
- Table 46: Italy Mineral Spirit Market Volume (K Litres) Forecast, by Application 2020 & 2033
- Table 47: France Mineral Spirit Market Revenue (billion) Forecast, by Application 2020 & 2033
- Table 48: France Mineral Spirit Market Volume (K Litres) Forecast, by Application 2020 & 2033
- Table 49: Rest of Europe Mineral Spirit Market Revenue (billion) Forecast, by Application 2020 & 2033
- Table 50: Rest of Europe Mineral Spirit Market Volume (K Litres) Forecast, by Application 2020 & 2033
- Table 51: Global Mineral Spirit Market Revenue billion Forecast, by Grade 2020 & 2033
- Table 52: Global Mineral Spirit Market Volume K Litres Forecast, by Grade 2020 & 2033
- Table 53: Global Mineral Spirit Market Revenue billion Forecast, by Application 2020 & 2033
- Table 54: Global Mineral Spirit Market Volume K Litres Forecast, by Application 2020 & 2033
- Table 55: Global Mineral Spirit Market Revenue billion Forecast, by Country 2020 & 2033
- Table 56: Global Mineral Spirit Market Volume K Litres Forecast, by Country 2020 & 2033
- Table 57: Brazil Mineral Spirit Market Revenue (billion) Forecast, by Application 2020 & 2033
- Table 58: Brazil Mineral Spirit Market Volume (K Litres) Forecast, by Application 2020 & 2033
- Table 59: Argentina Mineral Spirit Market Revenue (billion) Forecast, by Application 2020 & 2033
- Table 60: Argentina Mineral Spirit Market Volume (K Litres) Forecast, by Application 2020 & 2033
- Table 61: Rest of South America Mineral Spirit Market Revenue (billion) Forecast, by Application 2020 & 2033
- Table 62: Rest of South America Mineral Spirit Market Volume (K Litres) Forecast, by Application 2020 & 2033
- Table 63: Global Mineral Spirit Market Revenue billion Forecast, by Grade 2020 & 2033
- Table 64: Global Mineral Spirit Market Volume K Litres Forecast, by Grade 2020 & 2033
- Table 65: Global Mineral Spirit Market Revenue billion Forecast, by Application 2020 & 2033
- Table 66: Global Mineral Spirit Market Volume K Litres Forecast, by Application 2020 & 2033
- Table 67: Global Mineral Spirit Market Revenue billion Forecast, by Country 2020 & 2033
- Table 68: Global Mineral Spirit Market Volume K Litres Forecast, by Country 2020 & 2033
- Table 69: Saudi Arabia Mineral Spirit Market Revenue (billion) Forecast, by Application 2020 & 2033
- Table 70: Saudi Arabia Mineral Spirit Market Volume (K Litres) Forecast, by Application 2020 & 2033
- Table 71: South Africa Mineral Spirit Market Revenue (billion) Forecast, by Application 2020 & 2033
- Table 72: South Africa Mineral Spirit Market Volume (K Litres) Forecast, by Application 2020 & 2033
- Table 73: Rest of Middle East and Africa Mineral Spirit Market Revenue (billion) Forecast, by Application 2020 & 2033
- Table 74: Rest of Middle East and Africa Mineral Spirit Market Volume (K Litres) Forecast, by Application 2020 & 2033
Frequently Asked Questions
1. What is the projected Compound Annual Growth Rate (CAGR) of the Mineral Spirit Market?
The projected CAGR is approximately 11.93%.
2. Which companies are prominent players in the Mineral Spirit Market?
Key companies in the market include STOCKMEIER Group, TotalEnergies, Exxon Mobil Corporation, Cepsa, Shell Plc, KH Chemicals, HCS Group GmbH, DHC Solvent Chemie GmbH, Neste, Kuwaitintlfactory, KAPCO PETROLEUM INDUSTRIES FZC, Al Sanea, Mehta Petro Refineries Limited.
3. What are the main segments of the Mineral Spirit Market?
The market segments include Grade, Application.
4. Can you provide details about the market size?
The market size is estimated to be USD 10.68 billion as of 2022.
5. What are some drivers contributing to market growth?
Increasing Demand from the Paints and Coatings Industry; Augmenting Infrastructure Development.
6. What are the notable trends driving market growth?
Growing Demand from Paint Thinner Application.
7. Are there any restraints impacting market growth?
Toxic and Hazardous Nature of White Spirit; Other Restraints.
8. Can you provide examples of recent developments in the market?
December 2022: ExxonMobil unveiled its five-year corporate plan. It includes a significant investment increase directed at emission reductions and accretive lower-emission projects, including its Low Carbon Solutions company. By 2027, the business plan will maintain annual capital expenditures at USD 20-25 billion while increasing lower-emissions investments to around USD 17 billion.
9. What pricing options are available for accessing the report?
Pricing options include single-user, multi-user, and enterprise licenses priced at USD 3,950, USD 4,950, and USD 6,950 respectively.
10. Is the market size provided in terms of value or volume?
The market size is provided in terms of value, measured in billion and volume, measured in K Litres.
11. Are there any specific market keywords associated with the report?
Yes, the market keyword associated with the report is "Mineral Spirit Market," which aids in identifying and referencing the specific market segment covered.
12. How do I determine which pricing option suits my needs best?
The pricing options vary based on user requirements and access needs. Individual users may opt for single-user licenses, while businesses requiring broader access may choose multi-user or enterprise licenses for cost-effective access to the report.
13. Are there any additional resources or data provided in the Mineral Spirit Market report?
While the report offers comprehensive insights, it's advisable to review the specific contents or supplementary materials provided to ascertain if additional resources or data are available.
14. How can I stay updated on further developments or reports in the Mineral Spirit Market?
To stay informed about further developments, trends, and reports in the Mineral Spirit Market, consider subscribing to industry newsletters, following relevant companies and organizations, or regularly checking reputable industry news sources and publications.
Methodology
Step 1 - Identification of Relevant Samples Size from Population Database


Step 2 - Approaches for Defining Global Market Size (Value, Volume* & Price*)

Note*: In applicable scenarios
Step 3 - Data Sources
Primary Research
- Web Analytics
- Survey Reports
- Research Institute
- Latest Research Reports
- Opinion Leaders
Secondary Research
- Annual Reports
- White Paper
- Latest Press Release
- Industry Association
- Paid Database
- Investor Presentations

Step 4 - Data Triangulation
Involves using different sources of information in order to increase the validity of a study
These sources are likely to be stakeholders in a program - participants, other researchers, program staff, other community members, and so on.
Then we put all data in single framework & apply various statistical tools to find out the dynamic on the market.
During the analysis stage, feedback from the stakeholder groups would be compared to determine areas of agreement as well as areas of divergence