
Key Insights
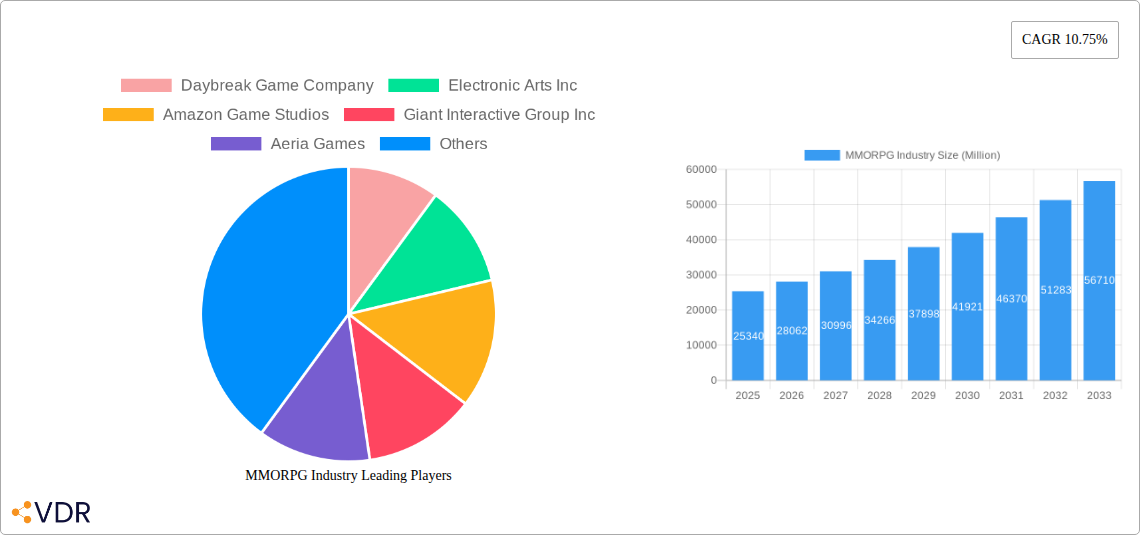
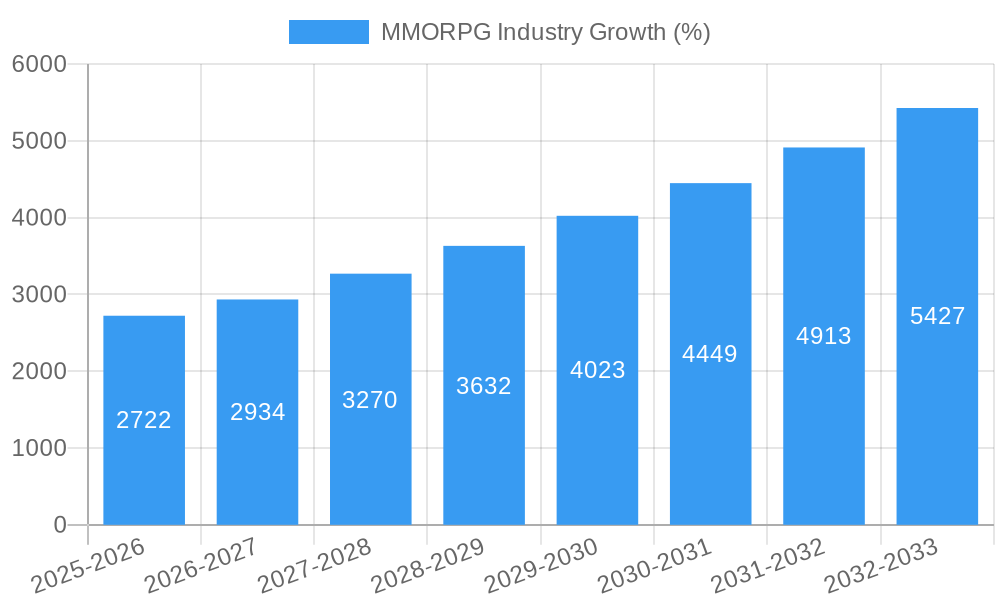
The MMORPG (Massively Multiplayer Online Role-Playing Game) market, valued at $25.34 billion in 2025, exhibits robust growth potential, projected to expand at a Compound Annual Growth Rate (CAGR) of 10.75% from 2025 to 2033. This growth is fueled by several key drivers. The increasing penetration of high-speed internet and mobile devices, particularly smartphones, has broadened access to MMORPGs globally, leading to a surge in player bases. Furthermore, the continuous evolution of game mechanics, graphics, and social features keeps the genre engaging and attracts both new and returning players. The rise of esports and competitive gaming within the MMORPG landscape also contributes significantly to market expansion. Finally, the ongoing development of cross-platform compatibility allows players to seamlessly transition between different devices, enhancing accessibility and user experience. The market is segmented by gaming platform (mobile, tablet, gaming console, PC), reflecting the diverse preferences of gamers and the strategic adaptations by developers.
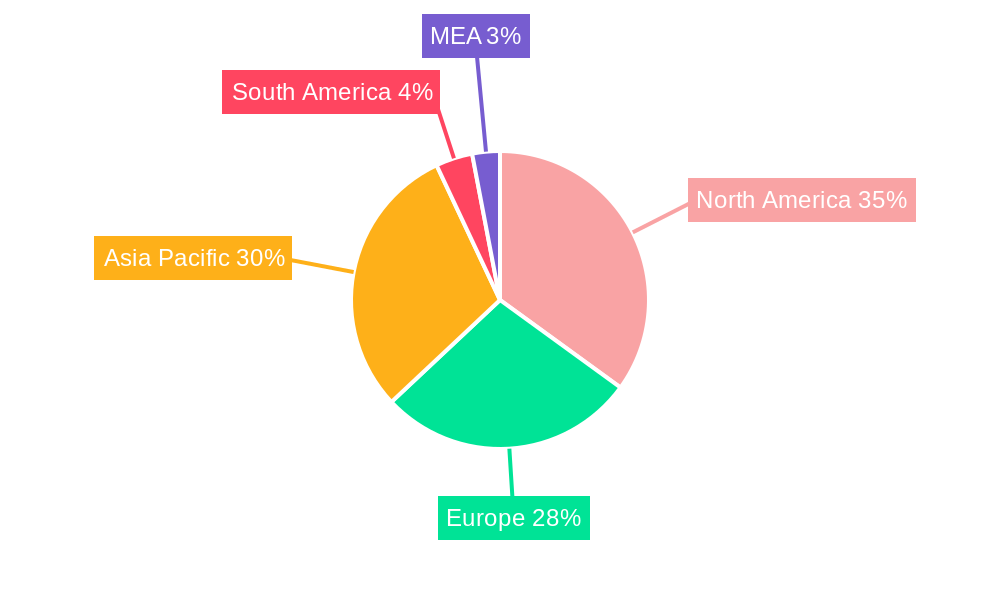
However, the market also faces certain restraints. The increasing development costs associated with creating high-quality MMORPGs can pose challenges for smaller developers. Furthermore, competition amongst established studios and the emergence of new players necessitates constant innovation to maintain market share. Maintaining player engagement over extended periods, especially in the face of new game releases, is a crucial factor impacting the long-term success of MMORPG titles. Despite these challenges, the overall growth trajectory remains positive, driven by technological advancements, evolving player demographics, and the enduring appeal of the MMORPG genre. Regional variations exist, with North America, Europe, and Asia-Pacific acting as major markets, while emerging markets in South America and MEA also present substantial growth opportunities. The success of individual companies like Tencent, Activision Blizzard, and NetEase underscores the profitability and competitive landscape of the industry.
MMORPG Industry Market Report: 2019-2033
This comprehensive report provides a detailed analysis of the Massively Multiplayer Online Role-Playing Game (MMORPG) industry, encompassing market dynamics, growth trends, regional dominance, key players, and future outlook. The report covers the period from 2019 to 2033, with a focus on 2025 as the base and estimated year. This in-depth study serves as an essential resource for industry professionals, investors, and strategists seeking to navigate this dynamic and ever-evolving market. Parent market: Gaming industry; Child market: MMORPG sub-segment. Total market size projected to reach xx Million units by 2033.
MMORPG Industry Market Dynamics & Structure
The MMORPG market, valued at xx Million units in 2024, is characterized by moderate concentration, with a few dominant players and a large number of smaller independent studios. Technological innovation, particularly in graphics, gameplay mechanics, and virtual reality (VR) integration, is a key driver. Regulatory frameworks concerning in-game purchases and data privacy vary across regions, influencing market access and operational costs. Competitive substitutes include other online games, such as battle royale and MOBA titles, posing a continuous challenge. The end-user demographic skews towards young adults (18-35) but is broadening to include older players and a more diverse range of interests. M&A activity remains significant, with xx deals recorded between 2019 and 2024, primarily focusing on acquiring smaller studios with unique IP or technical expertise.
- Market Concentration: Moderately concentrated, with top 5 players holding approximately 60% market share.
- Technological Innovation Drivers: VR/AR integration, improved graphics engines, enhanced social features.
- Regulatory Frameworks: Varying regulations across regions regarding in-app purchases and data privacy.
- Competitive Product Substitutes: Battle Royale, MOBA, and other online gaming genres.
- End-User Demographics: Primarily young adults (18-35), expanding to include a wider age range.
- M&A Trends: xx M&A deals between 2019 and 2024, primarily focusing on smaller studios with unique IP.
MMORPG Industry Growth Trends & Insights
The MMORPG market experienced a CAGR of xx% during the historical period (2019-2024), driven by increasing smartphone penetration, improved internet infrastructure, and the rising popularity of esports. Technological advancements, particularly in mobile gaming, broadened accessibility and expanded the user base. The adoption rate of MMORPGs is expected to continue increasing, fueled by the continuous innovation in game mechanics, storytelling, and social interaction. Consumer behavior shifts toward freemium models and subscription services are altering revenue streams for developers. The forecast period (2025-2033) anticipates a CAGR of xx%, leading to a projected market size of xx Million units by 2033. Market penetration will increase steadily due to continued technological advancement and a broader appeal to a wider demographic.
Dominant Regions, Countries, or Segments in MMORPG Industry
Asia, particularly China, South Korea, and Japan, are dominant regions, accounting for approximately 70% of the global MMORPG market. This dominance is driven by strong internet infrastructure, high smartphone penetration, and a large and engaged gaming community. The Mobile gaming segment exhibits the fastest growth among the platforms (Mobile, Tablet, Gaming Console, PC), projected to capture xx% of the total market share by 2033, primarily due to ease of access and broader reach.
- Key Drivers in Asia: Strong internet infrastructure, high smartphone penetration rates, large gaming community.
- Mobile Segment Dominance: Ease of access, broader reach, and continuous innovation in mobile gaming technology.
- PC Segment: Retains a significant market share due to sophisticated gameplay and dedicated player base.
- Growth Potential: Untapped markets in developing economies offer significant growth opportunities.
MMORPG Industry Product Landscape
MMORPGs are constantly evolving, incorporating advanced graphics, enhanced storytelling, and more immersive gameplay experiences. Recent innovations focus on cross-platform compatibility, integration of VR/AR technologies, and the development of web3-native games leveraging blockchain technology for enhanced in-game economies and asset ownership. Unique selling propositions often include compelling narratives, diverse character customization, and engaging social features that foster a strong community.
Key Drivers, Barriers & Challenges in MMORPG Industry
Key Drivers:
- Increasing smartphone and internet penetration globally.
- Technological advancements leading to improved graphics and gameplay.
- Growing popularity of esports and live-streaming.
Key Challenges:
- Intense competition from other gaming genres.
- Maintaining player engagement in long-term games.
- Addressing concerns regarding in-app purchases and game addiction.
- Supply chain disruptions impacting development and release timelines. Estimated impact on revenue: xx Million units in 2024.
Emerging Opportunities in MMORPG Industry
- Expansion into untapped markets (e.g., Africa, Latin America).
- Development of cloud-based MMORPGs for improved accessibility.
- Integration of metaverse technologies for enhanced player experiences.
Growth Accelerators in the MMORPG Industry
Technological breakthroughs in rendering technology, AI-driven game design, and the integration of virtual and augmented reality (VR/AR) will propel significant growth. Strategic partnerships between established gaming companies and emerging developers will provide access to new technologies and distribution channels. Expansion into new geographic markets, particularly in regions with emerging internet infrastructure, will also fuel substantial growth.
Key Players Shaping the MMORPG Industry Market
- Daybreak Game Company
- Electronic Arts Inc
- Amazon Game Studios
- Giant Interactive Group Inc
- Aeria Games
- CCP games UK Ltd
- NCSOFT Corporation
- Activision Blizzard Inc
- Neteasegames Inc
- Tencent Holdings Limited
- Bright Star Studios
- Ubisoft Entertainment SA
- Jagex Limited
- Gravity Corporatio
- Nexon Co Ltd
Notable Milestones in MMORPG Industry Sector
- January 2023: Launch of Search for Animera, a web3-native MMORPG on ImmutableX, highlighting the growing integration of blockchain technology.
- September 2022: Global release of Dekaron G, a mobile MMORPG, expanding the reach of a classic PC title to a wider audience.
- June 2022: Clockwork Labs secures USD 22 million in funding for BitCraft, indicating investor confidence in community-driven sandbox MMORPGs.
- May 2022: Gravity Co Ltd launches Ragnarok V: Returns, demonstrating the continued popularity of established franchises and the success of multi-platform releases.
In-Depth MMORPG Industry Market Outlook
The MMORPG market shows strong potential for continued growth, driven by technological innovation and expanding accessibility. Strategic opportunities lie in developing innovative gameplay mechanics, leveraging emerging technologies (e.g., VR/AR, blockchain), and expanding into new markets. The focus on community engagement, enhanced storytelling, and cross-platform play will be crucial for maintaining player retention and attracting new users. The market is poised for a period of sustained expansion, propelled by these factors, promising substantial returns for savvy investors and developers.
MMORPG Industry Segmentation
-
1. Gaming Platform
- 1.1. Mobile
- 1.2. Tablet
- 1.3. Gaming Console
- 1.4. PC
MMORPG Industry Segmentation By Geography
-
1. North America
- 1.1. United States
- 1.2. Canada
-
2. Europe
- 2.1. United Kingdom
- 2.2. Germany
- 2.3. France
- 2.4. Italy
- 2.5. Russia
-
3. Asia
- 3.1. China
- 3.2. India
- 3.3. Japan
- 3.4. South Korea
- 4. Australia and New Zealand
-
5. Latin America
- 5.1. Brazil
- 5.2. Mexico
- 5.3. Argentina
-
6. Middle East and Africa
- 6.1. United Arab Emirates
- 6.2. Saudi Arabia
- 6.3. South Africa
MMORPG Industry REPORT HIGHLIGHTS
| Aspects | Details |
|---|---|
| Study Period | 2019-2033 |
| Base Year | 2024 |
| Estimated Year | 2025 |
| Forecast Period | 2025-2033 |
| Historical Period | 2019-2024 |
| Growth Rate | CAGR of 10.75% from 2019-2033 |
| Segmentation |
|
Table of Contents
- 1. Introduction
- 1.1. Research Scope
- 1.2. Market Segmentation
- 1.3. Research Methodology
- 1.4. Definitions and Assumptions
- 2. Executive Summary
- 2.1. Introduction
- 3. Market Dynamics
- 3.1. Introduction
- 3.2. Market Drivers
- 3.2.1 Rising Smartphone Penetration and Increasing Penetration of Internet among Developing Economies; Technological Advancement such as IoT
- 3.2.2 AR
- 3.2.3 and VR; Emergence of Gamification
- 3.3. Market Restrains
- 3.3.1 Costs
- 3.3.2 Interoperability
- 3.3.3 and Security Concerns
- 3.4. Market Trends
- 3.4.1. Rising Smartphone Penetration and Increasing Penetration of Internet among Developing Economies may Drive the Market Growth
- 4. Market Factor Analysis
- 4.1. Porters Five Forces
- 4.2. Supply/Value Chain
- 4.3. PESTEL analysis
- 4.4. Market Entropy
- 4.5. Patent/Trademark Analysis
- 5. Global MMORPG Industry Analysis, Insights and Forecast, 2019-2031
- 5.1. Market Analysis, Insights and Forecast - by Gaming Platform
- 5.1.1. Mobile
- 5.1.2. Tablet
- 5.1.3. Gaming Console
- 5.1.4. PC
- 5.2. Market Analysis, Insights and Forecast - by Region
- 5.2.1. North America
- 5.2.2. Europe
- 5.2.3. Asia
- 5.2.4. Australia and New Zealand
- 5.2.5. Latin America
- 5.2.6. Middle East and Africa
- 5.1. Market Analysis, Insights and Forecast - by Gaming Platform
- 6. North America MMORPG Industry Analysis, Insights and Forecast, 2019-2031
- 6.1. Market Analysis, Insights and Forecast - by Gaming Platform
- 6.1.1. Mobile
- 6.1.2. Tablet
- 6.1.3. Gaming Console
- 6.1.4. PC
- 6.1. Market Analysis, Insights and Forecast - by Gaming Platform
- 7. Europe MMORPG Industry Analysis, Insights and Forecast, 2019-2031
- 7.1. Market Analysis, Insights and Forecast - by Gaming Platform
- 7.1.1. Mobile
- 7.1.2. Tablet
- 7.1.3. Gaming Console
- 7.1.4. PC
- 7.1. Market Analysis, Insights and Forecast - by Gaming Platform
- 8. Asia MMORPG Industry Analysis, Insights and Forecast, 2019-2031
- 8.1. Market Analysis, Insights and Forecast - by Gaming Platform
- 8.1.1. Mobile
- 8.1.2. Tablet
- 8.1.3. Gaming Console
- 8.1.4. PC
- 8.1. Market Analysis, Insights and Forecast - by Gaming Platform
- 9. Australia and New Zealand MMORPG Industry Analysis, Insights and Forecast, 2019-2031
- 9.1. Market Analysis, Insights and Forecast - by Gaming Platform
- 9.1.1. Mobile
- 9.1.2. Tablet
- 9.1.3. Gaming Console
- 9.1.4. PC
- 9.1. Market Analysis, Insights and Forecast - by Gaming Platform
- 10. Latin America MMORPG Industry Analysis, Insights and Forecast, 2019-2031
- 10.1. Market Analysis, Insights and Forecast - by Gaming Platform
- 10.1.1. Mobile
- 10.1.2. Tablet
- 10.1.3. Gaming Console
- 10.1.4. PC
- 10.1. Market Analysis, Insights and Forecast - by Gaming Platform
- 11. Middle East and Africa MMORPG Industry Analysis, Insights and Forecast, 2019-2031
- 11.1. Market Analysis, Insights and Forecast - by Gaming Platform
- 11.1.1. Mobile
- 11.1.2. Tablet
- 11.1.3. Gaming Console
- 11.1.4. PC
- 11.1. Market Analysis, Insights and Forecast - by Gaming Platform
- 12. North America MMORPG Industry Analysis, Insights and Forecast, 2019-2031
- 12.1. Market Analysis, Insights and Forecast - By Country/Sub-region
- 12.1.1 United States
- 12.1.2 Canada
- 12.1.3 Mexico
- 13. Europe MMORPG Industry Analysis, Insights and Forecast, 2019-2031
- 13.1. Market Analysis, Insights and Forecast - By Country/Sub-region
- 13.1.1 Germany
- 13.1.2 United Kingdom
- 13.1.3 France
- 13.1.4 Spain
- 13.1.5 Italy
- 13.1.6 Spain
- 13.1.7 Belgium
- 13.1.8 Netherland
- 13.1.9 Nordics
- 13.1.10 Rest of Europe
- 14. Asia Pacific MMORPG Industry Analysis, Insights and Forecast, 2019-2031
- 14.1. Market Analysis, Insights and Forecast - By Country/Sub-region
- 14.1.1 China
- 14.1.2 Japan
- 14.1.3 India
- 14.1.4 South Korea
- 14.1.5 Southeast Asia
- 14.1.6 Australia
- 14.1.7 Indonesia
- 14.1.8 Phillipes
- 14.1.9 Singapore
- 14.1.10 Thailandc
- 14.1.11 Rest of Asia Pacific
- 15. South America MMORPG Industry Analysis, Insights and Forecast, 2019-2031
- 15.1. Market Analysis, Insights and Forecast - By Country/Sub-region
- 15.1.1 Brazil
- 15.1.2 Argentina
- 15.1.3 Peru
- 15.1.4 Chile
- 15.1.5 Colombia
- 15.1.6 Ecuador
- 15.1.7 Venezuela
- 15.1.8 Rest of South America
- 16. MEA MMORPG Industry Analysis, Insights and Forecast, 2019-2031
- 16.1. Market Analysis, Insights and Forecast - By Country/Sub-region
- 16.1.1 United Arab Emirates
- 16.1.2 Saudi Arabia
- 16.1.3 South Africa
- 16.1.4 Rest of Middle East and Africa
- 17. Competitive Analysis
- 17.1. Global Market Share Analysis 2024
- 17.2. Company Profiles
- 17.2.1 Daybreak Game Company
- 17.2.1.1. Overview
- 17.2.1.2. Products
- 17.2.1.3. SWOT Analysis
- 17.2.1.4. Recent Developments
- 17.2.1.5. Financials (Based on Availability)
- 17.2.2 Electronic Arts Inc
- 17.2.2.1. Overview
- 17.2.2.2. Products
- 17.2.2.3. SWOT Analysis
- 17.2.2.4. Recent Developments
- 17.2.2.5. Financials (Based on Availability)
- 17.2.3 Amazon Game Studios
- 17.2.3.1. Overview
- 17.2.3.2. Products
- 17.2.3.3. SWOT Analysis
- 17.2.3.4. Recent Developments
- 17.2.3.5. Financials (Based on Availability)
- 17.2.4 Giant Interactive Group Inc
- 17.2.4.1. Overview
- 17.2.4.2. Products
- 17.2.4.3. SWOT Analysis
- 17.2.4.4. Recent Developments
- 17.2.4.5. Financials (Based on Availability)
- 17.2.5 Aeria Games
- 17.2.5.1. Overview
- 17.2.5.2. Products
- 17.2.5.3. SWOT Analysis
- 17.2.5.4. Recent Developments
- 17.2.5.5. Financials (Based on Availability)
- 17.2.6 CCP games UK Ltd
- 17.2.6.1. Overview
- 17.2.6.2. Products
- 17.2.6.3. SWOT Analysis
- 17.2.6.4. Recent Developments
- 17.2.6.5. Financials (Based on Availability)
- 17.2.7 NCSOFT Corporation
- 17.2.7.1. Overview
- 17.2.7.2. Products
- 17.2.7.3. SWOT Analysis
- 17.2.7.4. Recent Developments
- 17.2.7.5. Financials (Based on Availability)
- 17.2.8 Activision Blizzard Inc
- 17.2.8.1. Overview
- 17.2.8.2. Products
- 17.2.8.3. SWOT Analysis
- 17.2.8.4. Recent Developments
- 17.2.8.5. Financials (Based on Availability)
- 17.2.9 Neteasegames Inc
- 17.2.9.1. Overview
- 17.2.9.2. Products
- 17.2.9.3. SWOT Analysis
- 17.2.9.4. Recent Developments
- 17.2.9.5. Financials (Based on Availability)
- 17.2.10 Tencent Holdings Limited
- 17.2.10.1. Overview
- 17.2.10.2. Products
- 17.2.10.3. SWOT Analysis
- 17.2.10.4. Recent Developments
- 17.2.10.5. Financials (Based on Availability)
- 17.2.11 Bright Star Studios
- 17.2.11.1. Overview
- 17.2.11.2. Products
- 17.2.11.3. SWOT Analysis
- 17.2.11.4. Recent Developments
- 17.2.11.5. Financials (Based on Availability)
- 17.2.12 Ubisoft Entertainment SA
- 17.2.12.1. Overview
- 17.2.12.2. Products
- 17.2.12.3. SWOT Analysis
- 17.2.12.4. Recent Developments
- 17.2.12.5. Financials (Based on Availability)
- 17.2.13 Jagex Limited
- 17.2.13.1. Overview
- 17.2.13.2. Products
- 17.2.13.3. SWOT Analysis
- 17.2.13.4. Recent Developments
- 17.2.13.5. Financials (Based on Availability)
- 17.2.14 Gravity Corporatio
- 17.2.14.1. Overview
- 17.2.14.2. Products
- 17.2.14.3. SWOT Analysis
- 17.2.14.4. Recent Developments
- 17.2.14.5. Financials (Based on Availability)
- 17.2.15 Nexon Co Ltd
- 17.2.15.1. Overview
- 17.2.15.2. Products
- 17.2.15.3. SWOT Analysis
- 17.2.15.4. Recent Developments
- 17.2.15.5. Financials (Based on Availability)
- 17.2.1 Daybreak Game Company
List of Figures
- Figure 1: Global MMORPG Industry Revenue Breakdown (Million, %) by Region 2024 & 2032
- Figure 2: North America MMORPG Industry Revenue (Million), by Country 2024 & 2032
- Figure 3: North America MMORPG Industry Revenue Share (%), by Country 2024 & 2032
- Figure 4: Europe MMORPG Industry Revenue (Million), by Country 2024 & 2032
- Figure 5: Europe MMORPG Industry Revenue Share (%), by Country 2024 & 2032
- Figure 6: Asia Pacific MMORPG Industry Revenue (Million), by Country 2024 & 2032
- Figure 7: Asia Pacific MMORPG Industry Revenue Share (%), by Country 2024 & 2032
- Figure 8: South America MMORPG Industry Revenue (Million), by Country 2024 & 2032
- Figure 9: South America MMORPG Industry Revenue Share (%), by Country 2024 & 2032
- Figure 10: MEA MMORPG Industry Revenue (Million), by Country 2024 & 2032
- Figure 11: MEA MMORPG Industry Revenue Share (%), by Country 2024 & 2032
- Figure 12: North America MMORPG Industry Revenue (Million), by Gaming Platform 2024 & 2032
- Figure 13: North America MMORPG Industry Revenue Share (%), by Gaming Platform 2024 & 2032
- Figure 14: North America MMORPG Industry Revenue (Million), by Country 2024 & 2032
- Figure 15: North America MMORPG Industry Revenue Share (%), by Country 2024 & 2032
- Figure 16: Europe MMORPG Industry Revenue (Million), by Gaming Platform 2024 & 2032
- Figure 17: Europe MMORPG Industry Revenue Share (%), by Gaming Platform 2024 & 2032
- Figure 18: Europe MMORPG Industry Revenue (Million), by Country 2024 & 2032
- Figure 19: Europe MMORPG Industry Revenue Share (%), by Country 2024 & 2032
- Figure 20: Asia MMORPG Industry Revenue (Million), by Gaming Platform 2024 & 2032
- Figure 21: Asia MMORPG Industry Revenue Share (%), by Gaming Platform 2024 & 2032
- Figure 22: Asia MMORPG Industry Revenue (Million), by Country 2024 & 2032
- Figure 23: Asia MMORPG Industry Revenue Share (%), by Country 2024 & 2032
- Figure 24: Australia and New Zealand MMORPG Industry Revenue (Million), by Gaming Platform 2024 & 2032
- Figure 25: Australia and New Zealand MMORPG Industry Revenue Share (%), by Gaming Platform 2024 & 2032
- Figure 26: Australia and New Zealand MMORPG Industry Revenue (Million), by Country 2024 & 2032
- Figure 27: Australia and New Zealand MMORPG Industry Revenue Share (%), by Country 2024 & 2032
- Figure 28: Latin America MMORPG Industry Revenue (Million), by Gaming Platform 2024 & 2032
- Figure 29: Latin America MMORPG Industry Revenue Share (%), by Gaming Platform 2024 & 2032
- Figure 30: Latin America MMORPG Industry Revenue (Million), by Country 2024 & 2032
- Figure 31: Latin America MMORPG Industry Revenue Share (%), by Country 2024 & 2032
- Figure 32: Middle East and Africa MMORPG Industry Revenue (Million), by Gaming Platform 2024 & 2032
- Figure 33: Middle East and Africa MMORPG Industry Revenue Share (%), by Gaming Platform 2024 & 2032
- Figure 34: Middle East and Africa MMORPG Industry Revenue (Million), by Country 2024 & 2032
- Figure 35: Middle East and Africa MMORPG Industry Revenue Share (%), by Country 2024 & 2032
List of Tables
- Table 1: Global MMORPG Industry Revenue Million Forecast, by Region 2019 & 2032
- Table 2: Global MMORPG Industry Revenue Million Forecast, by Gaming Platform 2019 & 2032
- Table 3: Global MMORPG Industry Revenue Million Forecast, by Region 2019 & 2032
- Table 4: Global MMORPG Industry Revenue Million Forecast, by Country 2019 & 2032
- Table 5: United States MMORPG Industry Revenue (Million) Forecast, by Application 2019 & 2032
- Table 6: Canada MMORPG Industry Revenue (Million) Forecast, by Application 2019 & 2032
- Table 7: Mexico MMORPG Industry Revenue (Million) Forecast, by Application 2019 & 2032
- Table 8: Global MMORPG Industry Revenue Million Forecast, by Country 2019 & 2032
- Table 9: Germany MMORPG Industry Revenue (Million) Forecast, by Application 2019 & 2032
- Table 10: United Kingdom MMORPG Industry Revenue (Million) Forecast, by Application 2019 & 2032
- Table 11: France MMORPG Industry Revenue (Million) Forecast, by Application 2019 & 2032
- Table 12: Spain MMORPG Industry Revenue (Million) Forecast, by Application 2019 & 2032
- Table 13: Italy MMORPG Industry Revenue (Million) Forecast, by Application 2019 & 2032
- Table 14: Spain MMORPG Industry Revenue (Million) Forecast, by Application 2019 & 2032
- Table 15: Belgium MMORPG Industry Revenue (Million) Forecast, by Application 2019 & 2032
- Table 16: Netherland MMORPG Industry Revenue (Million) Forecast, by Application 2019 & 2032
- Table 17: Nordics MMORPG Industry Revenue (Million) Forecast, by Application 2019 & 2032
- Table 18: Rest of Europe MMORPG Industry Revenue (Million) Forecast, by Application 2019 & 2032
- Table 19: Global MMORPG Industry Revenue Million Forecast, by Country 2019 & 2032
- Table 20: China MMORPG Industry Revenue (Million) Forecast, by Application 2019 & 2032
- Table 21: Japan MMORPG Industry Revenue (Million) Forecast, by Application 2019 & 2032
- Table 22: India MMORPG Industry Revenue (Million) Forecast, by Application 2019 & 2032
- Table 23: South Korea MMORPG Industry Revenue (Million) Forecast, by Application 2019 & 2032
- Table 24: Southeast Asia MMORPG Industry Revenue (Million) Forecast, by Application 2019 & 2032
- Table 25: Australia MMORPG Industry Revenue (Million) Forecast, by Application 2019 & 2032
- Table 26: Indonesia MMORPG Industry Revenue (Million) Forecast, by Application 2019 & 2032
- Table 27: Phillipes MMORPG Industry Revenue (Million) Forecast, by Application 2019 & 2032
- Table 28: Singapore MMORPG Industry Revenue (Million) Forecast, by Application 2019 & 2032
- Table 29: Thailandc MMORPG Industry Revenue (Million) Forecast, by Application 2019 & 2032
- Table 30: Rest of Asia Pacific MMORPG Industry Revenue (Million) Forecast, by Application 2019 & 2032
- Table 31: Global MMORPG Industry Revenue Million Forecast, by Country 2019 & 2032
- Table 32: Brazil MMORPG Industry Revenue (Million) Forecast, by Application 2019 & 2032
- Table 33: Argentina MMORPG Industry Revenue (Million) Forecast, by Application 2019 & 2032
- Table 34: Peru MMORPG Industry Revenue (Million) Forecast, by Application 2019 & 2032
- Table 35: Chile MMORPG Industry Revenue (Million) Forecast, by Application 2019 & 2032
- Table 36: Colombia MMORPG Industry Revenue (Million) Forecast, by Application 2019 & 2032
- Table 37: Ecuador MMORPG Industry Revenue (Million) Forecast, by Application 2019 & 2032
- Table 38: Venezuela MMORPG Industry Revenue (Million) Forecast, by Application 2019 & 2032
- Table 39: Rest of South America MMORPG Industry Revenue (Million) Forecast, by Application 2019 & 2032
- Table 40: Global MMORPG Industry Revenue Million Forecast, by Country 2019 & 2032
- Table 41: United Arab Emirates MMORPG Industry Revenue (Million) Forecast, by Application 2019 & 2032
- Table 42: Saudi Arabia MMORPG Industry Revenue (Million) Forecast, by Application 2019 & 2032
- Table 43: South Africa MMORPG Industry Revenue (Million) Forecast, by Application 2019 & 2032
- Table 44: Rest of Middle East and Africa MMORPG Industry Revenue (Million) Forecast, by Application 2019 & 2032
- Table 45: Global MMORPG Industry Revenue Million Forecast, by Gaming Platform 2019 & 2032
- Table 46: Global MMORPG Industry Revenue Million Forecast, by Country 2019 & 2032
- Table 47: United States MMORPG Industry Revenue (Million) Forecast, by Application 2019 & 2032
- Table 48: Canada MMORPG Industry Revenue (Million) Forecast, by Application 2019 & 2032
- Table 49: Global MMORPG Industry Revenue Million Forecast, by Gaming Platform 2019 & 2032
- Table 50: Global MMORPG Industry Revenue Million Forecast, by Country 2019 & 2032
- Table 51: United Kingdom MMORPG Industry Revenue (Million) Forecast, by Application 2019 & 2032
- Table 52: Germany MMORPG Industry Revenue (Million) Forecast, by Application 2019 & 2032
- Table 53: France MMORPG Industry Revenue (Million) Forecast, by Application 2019 & 2032
- Table 54: Italy MMORPG Industry Revenue (Million) Forecast, by Application 2019 & 2032
- Table 55: Russia MMORPG Industry Revenue (Million) Forecast, by Application 2019 & 2032
- Table 56: Global MMORPG Industry Revenue Million Forecast, by Gaming Platform 2019 & 2032
- Table 57: Global MMORPG Industry Revenue Million Forecast, by Country 2019 & 2032
- Table 58: China MMORPG Industry Revenue (Million) Forecast, by Application 2019 & 2032
- Table 59: India MMORPG Industry Revenue (Million) Forecast, by Application 2019 & 2032
- Table 60: Japan MMORPG Industry Revenue (Million) Forecast, by Application 2019 & 2032
- Table 61: South Korea MMORPG Industry Revenue (Million) Forecast, by Application 2019 & 2032
- Table 62: Global MMORPG Industry Revenue Million Forecast, by Gaming Platform 2019 & 2032
- Table 63: Global MMORPG Industry Revenue Million Forecast, by Country 2019 & 2032
- Table 64: Global MMORPG Industry Revenue Million Forecast, by Gaming Platform 2019 & 2032
- Table 65: Global MMORPG Industry Revenue Million Forecast, by Country 2019 & 2032
- Table 66: Brazil MMORPG Industry Revenue (Million) Forecast, by Application 2019 & 2032
- Table 67: Mexico MMORPG Industry Revenue (Million) Forecast, by Application 2019 & 2032
- Table 68: Argentina MMORPG Industry Revenue (Million) Forecast, by Application 2019 & 2032
- Table 69: Global MMORPG Industry Revenue Million Forecast, by Gaming Platform 2019 & 2032
- Table 70: Global MMORPG Industry Revenue Million Forecast, by Country 2019 & 2032
- Table 71: United Arab Emirates MMORPG Industry Revenue (Million) Forecast, by Application 2019 & 2032
- Table 72: Saudi Arabia MMORPG Industry Revenue (Million) Forecast, by Application 2019 & 2032
- Table 73: South Africa MMORPG Industry Revenue (Million) Forecast, by Application 2019 & 2032
Frequently Asked Questions
1. What is the projected Compound Annual Growth Rate (CAGR) of the MMORPG Industry?
The projected CAGR is approximately 10.75%.
2. Which companies are prominent players in the MMORPG Industry?
Key companies in the market include Daybreak Game Company, Electronic Arts Inc, Amazon Game Studios, Giant Interactive Group Inc, Aeria Games, CCP games UK Ltd, NCSOFT Corporation, Activision Blizzard Inc, Neteasegames Inc, Tencent Holdings Limited, Bright Star Studios, Ubisoft Entertainment SA, Jagex Limited, Gravity Corporatio, Nexon Co Ltd.
3. What are the main segments of the MMORPG Industry?
The market segments include Gaming Platform.
4. Can you provide details about the market size?
The market size is estimated to be USD 25.34 Million as of 2022.
5. What are some drivers contributing to market growth?
Rising Smartphone Penetration and Increasing Penetration of Internet among Developing Economies; Technological Advancement such as IoT. AR. and VR; Emergence of Gamification.
6. What are the notable trends driving market growth?
Rising Smartphone Penetration and Increasing Penetration of Internet among Developing Economies may Drive the Market Growth.
7. Are there any restraints impacting market growth?
Costs. Interoperability. and Security Concerns.
8. Can you provide examples of recent developments in the market?
January 2023: The development team behind Search for Animera, a web3-native massively multiplayer online role-playing game (MMORPG), announced the game's launch on ImmutableX, the go-to Ethereum platform for creating and scaling web3 games. By partnering with ImmutableX and utilizing its platform for the project's infrastructure, the developers of Animera can make sure that users may benefit from the simplicity of quick transactions, free mining, and trade, as well as the strength of Ethereum's built-in security.
9. What pricing options are available for accessing the report?
Pricing options include single-user, multi-user, and enterprise licenses priced at USD 4750, USD 5250, and USD 8750 respectively.
10. Is the market size provided in terms of value or volume?
The market size is provided in terms of value, measured in Million.
11. Are there any specific market keywords associated with the report?
Yes, the market keyword associated with the report is "MMORPG Industry," which aids in identifying and referencing the specific market segment covered.
12. How do I determine which pricing option suits my needs best?
The pricing options vary based on user requirements and access needs. Individual users may opt for single-user licenses, while businesses requiring broader access may choose multi-user or enterprise licenses for cost-effective access to the report.
13. Are there any additional resources or data provided in the MMORPG Industry report?
While the report offers comprehensive insights, it's advisable to review the specific contents or supplementary materials provided to ascertain if additional resources or data are available.
14. How can I stay updated on further developments or reports in the MMORPG Industry?
To stay informed about further developments, trends, and reports in the MMORPG Industry, consider subscribing to industry newsletters, following relevant companies and organizations, or regularly checking reputable industry news sources and publications.
Methodology
Step 1 - Identification of Relevant Samples Size from Population Database


Step 2 - Approaches for Defining Global Market Size (Value, Volume* & Price*)

Note*: In applicable scenarios
Step 3 - Data Sources
Primary Research
- Web Analytics
- Survey Reports
- Research Institute
- Latest Research Reports
- Opinion Leaders
Secondary Research
- Annual Reports
- White Paper
- Latest Press Release
- Industry Association
- Paid Database
- Investor Presentations

Step 4 - Data Triangulation
Involves using different sources of information in order to increase the validity of a study
These sources are likely to be stakeholders in a program - participants, other researchers, program staff, other community members, and so on.
Then we put all data in single framework & apply various statistical tools to find out the dynamic on the market.
During the analysis stage, feedback from the stakeholder groups would be compared to determine areas of agreement as well as areas of divergence


