
Key Insights
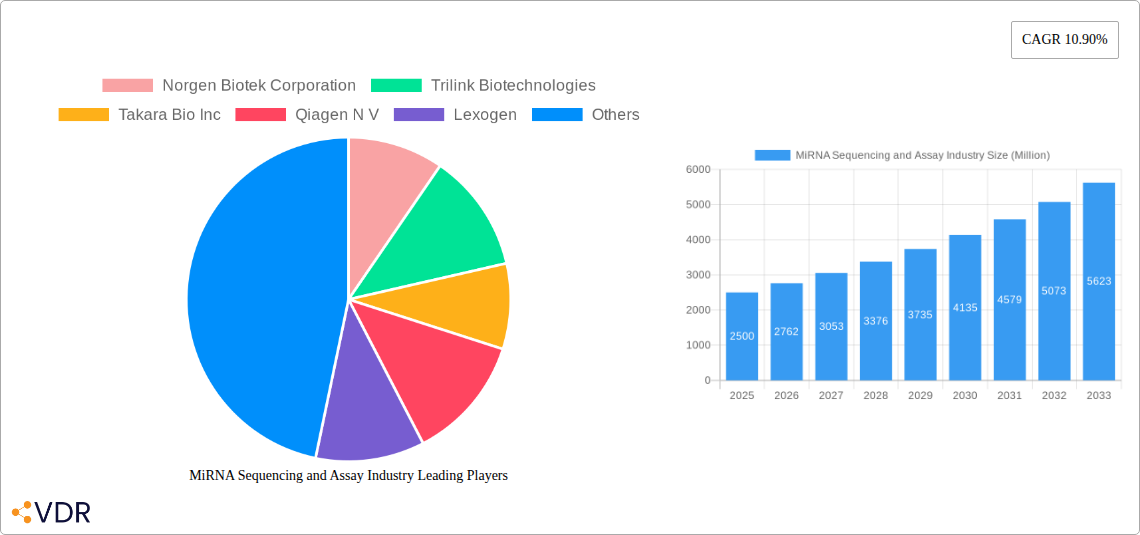
The microRNA (miRNA) sequencing and assay market is experiencing robust growth, driven by the increasing understanding of miRNAs' crucial roles in gene regulation and disease pathogenesis. The market, valued at approximately $2.5 billion in 2025, is projected to expand at a Compound Annual Growth Rate (CAGR) of 10.9% from 2025 to 2033. This growth is fueled by several key factors. Advancements in sequencing technologies, such as next-generation sequencing (NGS), are enabling more cost-effective and higher-throughput miRNA profiling. The rising adoption of personalized medicine, where miRNA biomarkers play a significant role in diagnostics and therapeutics, is another major driver. Furthermore, the expanding applications of miRNA analysis across diverse fields, including oncology, cardiology, and neurology, contribute significantly to market expansion. The clinical laboratory segment currently dominates the end-user market, reflecting the increasing use of miRNA assays in diagnostic testing. However, the life science research sector is also a substantial contributor, as researchers continue to unravel the complex roles of miRNAs in various biological processes. The sequencing by synthesis (SBS) technology currently holds a leading market share within the technology segment, but the nanopore sequencing technology is gaining traction due to its portability and real-time capabilities.
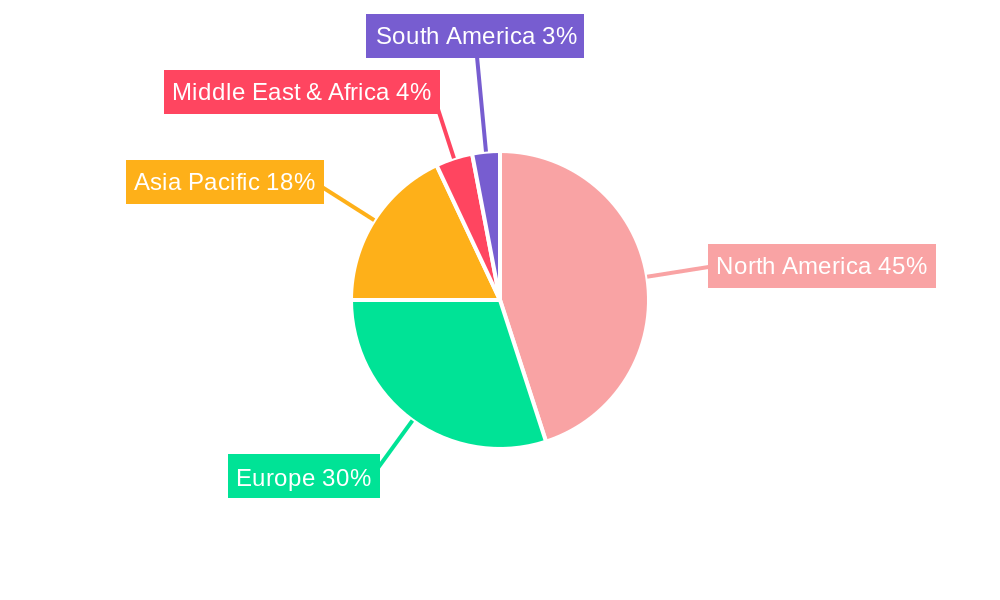
Geographic distribution shows North America currently leading the market, driven by robust funding for research and development and advanced healthcare infrastructure. However, the Asia-Pacific region is anticipated to exhibit the fastest growth in the forecast period, fueled by increasing healthcare spending and growing awareness of the diagnostic potential of miRNA technologies in developing economies. Competitive rivalry is intense, with key players such as Illumina, Thermo Fisher Scientific, and Qiagen dominating the market through technological innovation, strategic acquisitions, and extensive distribution networks. While challenges exist, such as the standardization of miRNA analysis protocols and the high cost of advanced sequencing technologies, the long-term outlook remains positive due to the continuous evolution of the field and expanding clinical applications. The market's trajectory strongly suggests a continued upward trend as the understanding and applications of miRNA technologies further expand.
This in-depth report provides a comprehensive analysis of the global miRNA Sequencing and Assay market, offering valuable insights for industry professionals, investors, and researchers. The report covers market dynamics, growth trends, regional analysis, product landscape, key players, and future outlook, using data from the historical period (2019-2024), base year (2025), and forecast period (2025-2033). The total market size is projected to reach xx Million by 2033.
MiRNA Sequencing and Assay Industry Market Dynamics & Structure
The miRNA Sequencing and Assay market is characterized by a moderately concentrated landscape with key players including Norgen Biotek Corporation, Trilink Biotechnologies, Takara Bio Inc, Qiagen N V, Lexogen, Oxford Nanopore Technologies, New England Biolabs Inc, PerkinElmer Inc, Illumina Inc, and Thermo Fisher Scientific. The market is driven by technological advancements in sequencing technologies, increasing research activities in miRNA research, and growing demand for personalized medicine.
- Market Concentration: The market exhibits moderate concentration, with the top 5 players holding an estimated xx% market share in 2025.
- Technological Innovation: Constant improvements in sequencing technologies (e.g., Nanopore sequencing) and assay development are major drivers.
- Regulatory Framework: Stringent regulatory approvals for diagnostic assays influence market growth.
- Competitive Substitutes: Alternative technologies for gene expression analysis pose competitive pressure.
- End-User Demographics: Clinical laboratories and life science organizations are the primary end-users.
- M&A Trends: The number of M&A deals in this sector averaged xx per year during 2019-2024.
MiRNA Sequencing and Assay Industry Growth Trends & Insights
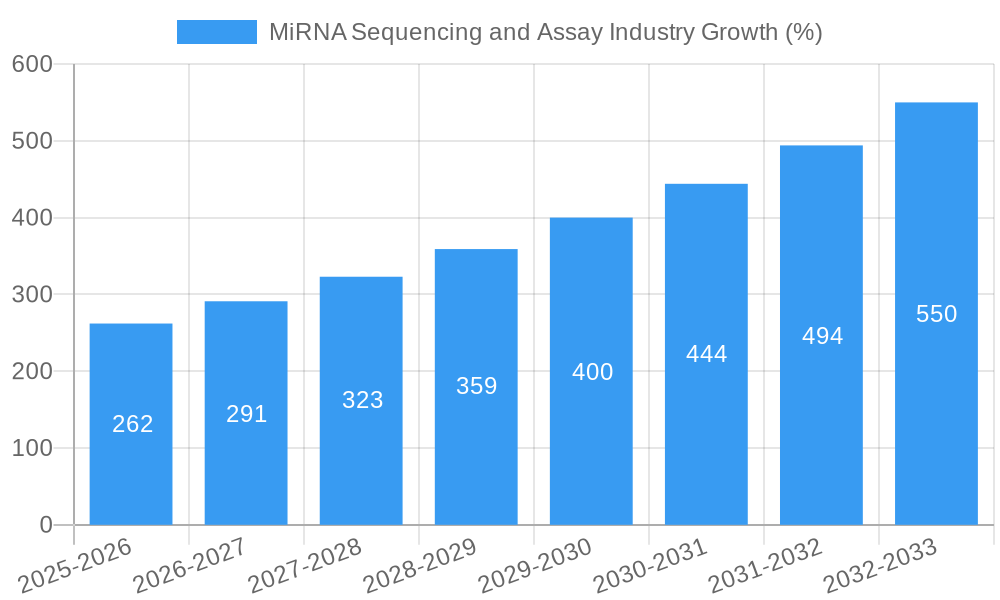
The global miRNA Sequencing and Assay market experienced significant growth during the historical period (2019-2024), exhibiting a CAGR of xx%. This growth is attributed to factors such as the increasing adoption of high-throughput sequencing technologies, expanding applications in disease diagnostics and therapeutics, and rising investments in life sciences research. The market is expected to continue its growth trajectory during the forecast period (2025-2033), with a projected CAGR of xx%, reaching a market value of xx Million by 2033. This growth will be driven by the continuous improvement in sequencing technologies, such as the development of more accurate, faster, and cost-effective assays, and the expanding application of miRNA analysis in various fields, such as cancer diagnostics and personalized medicine. Market penetration is expected to increase significantly, particularly in emerging economies.
Dominant Regions, Countries, or Segments in MiRNA Sequencing and Assay Industry
North America currently dominates the miRNA Sequencing and Assay market, driven by robust R&D investments, advanced healthcare infrastructure, and the presence of major players. Europe follows as a significant market, while the Asia-Pacific region is anticipated to show substantial growth, fueled by rising healthcare spending and increasing adoption of advanced technologies.
- By Product: Sequencing consumables currently hold the largest market share, followed by library preparation kits.
- By Technology: Sequencing by synthesis currently dominates the technology segment due to its wide adoption and established market presence. However, nanopore sequencing is showing rapid growth due to its portability and real-time capabilities.
- By End-User: Clinical laboratories are the leading end-user segment due to the increasing use of miRNA analysis in diagnostics.
MiRNA Sequencing and Assay Industry Product Landscape
The market offers a diverse range of products, including sequencing consumables (e.g., reagents, flow cells), library preparation kits, and data analysis software. Recent innovations focus on improving assay sensitivity, specificity, and throughput. Unique selling propositions often center on ease of use, cost-effectiveness, and advanced data analysis capabilities. Technological advancements like next-generation sequencing (NGS) platforms have significantly improved the efficiency and accuracy of miRNA profiling.
Key Drivers, Barriers & Challenges in MiRNA Sequencing and Assay Industry
Key Drivers:
- Technological advancements leading to higher throughput and lower costs.
- Growing demand for personalized medicine and companion diagnostics.
- Increasing research funding and government initiatives supporting genomic research.
Key Challenges:
- High initial investment costs for equipment and consumables can limit market accessibility.
- Complex data analysis and interpretation can pose a significant barrier for smaller labs.
- Stringent regulatory pathways and approval processes for new assays can slow down market entry.
Emerging Opportunities in MiRNA Sequencing and Assay Industry
Untapped markets in developing countries, the development of novel applications in areas like liquid biopsies and early disease detection, and the integration of AI and machine learning for improved data analysis represent key emerging opportunities.
Growth Accelerators in the MiRNA Sequencing and Assay Industry
Technological breakthroughs in sequencing technologies, strategic partnerships between research institutions and commercial entities, and aggressive market expansion strategies (especially in Asia-Pacific) are significant growth catalysts for this sector.
Key Players Shaping the MiRNA Sequencing and Assay Market
- Norgen Biotek Corporation
- Trilink Biotechnologies
- Takara Bio Inc
- Qiagen N V
- Lexogen
- Oxford Nanopore Technologies
- New England Biolabs Inc
- PerkinElmer Inc
- Illumina Inc
- Thermo Fisher Scientific
Notable Milestones in MiRNA Sequencing and Assay Industry Sector
- April 2022: HTC Molecular Diagnostics Inc. launched new features for its HTG EdgeSeq technology, enabling miRNA and mRNA profiling from a single sample.
- January 2022: Allogene Therapeutics collaborated with Antion Biosciences to leverage miRNA technology (miCAR) in developing next-generation allogeneic CAR T therapies.
In-Depth MiRNA Sequencing and Assay Industry Market Outlook
The miRNA Sequencing and Assay market presents substantial long-term growth potential, driven by continuous technological innovation and expanding applications across various sectors. Strategic partnerships, market penetration in emerging economies, and the development of more sophisticated and user-friendly assays will further accelerate market expansion in the coming years. The market is poised for significant growth, offering lucrative opportunities for companies involved in research, development, and commercialization of miRNA sequencing and assay technologies.
MiRNA Sequencing and Assay Industry Segmentation
-
1. Product
- 1.1. Sequencing Consumables
- 1.2. Library Preparation Kits
-
2. Technology
- 2.1. Sequencing by Synthesis
- 2.2. Ion Semiconductor
- 2.3. SOLiD
- 2.4. Nanopore Sequencing
-
3. End User
- 3.1. Clinical Laboratory
- 3.2. Life Science Organization
- 3.3. Other End Users
MiRNA Sequencing and Assay Industry Segmentation By Geography
-
1. North America
- 1.1. United States
- 1.2. Canada
- 1.3. Mexico
-
2. Europe
- 2.1. Germany
- 2.2. United Kingdom
- 2.3. France
- 2.4. Italy
- 2.5. Spain
- 2.6. Rest of Europe
-
3. Asia Pacific
- 3.1. China
- 3.2. Japan
- 3.3. India
- 3.4. Australia
- 3.5. South Korea
- 3.6. Rest of Asia Pacific
-
4. Middle East and Africa
- 4.1. GCC
- 4.2. South Africa
- 4.3. Rest of Middle East and Africa
-
5. South America
- 5.1. Brazil
- 5.2. Argentina
- 5.3. Rest of South America
MiRNA Sequencing and Assay Industry REPORT HIGHLIGHTS
| Aspects | Details |
|---|---|
| Study Period | 2019-2033 |
| Base Year | 2024 |
| Estimated Year | 2025 |
| Forecast Period | 2025-2033 |
| Historical Period | 2019-2024 |
| Growth Rate | CAGR of 10.90% from 2019-2033 |
| Segmentation |
|
Table of Contents
- 1. Introduction
- 1.1. Research Scope
- 1.2. Market Segmentation
- 1.3. Research Methodology
- 1.4. Definitions and Assumptions
- 2. Executive Summary
- 2.1. Introduction
- 3. Market Dynamics
- 3.1. Introduction
- 3.2. Market Drivers
- 3.2.1. MiRNA Sequencing and Assay Sequencing Supremacy Over Other Methods; Increased Research in the Field of Genomics; Reduced Sequencing Costs
- 3.3. Market Restrains
- 3.3.1. Paucity of Expert and Need for Computing Infrastructure
- 3.4. Market Trends
- 3.4.1. Library Preparation Kits are Expected to Hold the Largest Market Share in the miRNA Sequencing and Assay Market
- 4. Market Factor Analysis
- 4.1. Porters Five Forces
- 4.2. Supply/Value Chain
- 4.3. PESTEL analysis
- 4.4. Market Entropy
- 4.5. Patent/Trademark Analysis
- 5. Global MiRNA Sequencing and Assay Industry Analysis, Insights and Forecast, 2019-2031
- 5.1. Market Analysis, Insights and Forecast - by Product
- 5.1.1. Sequencing Consumables
- 5.1.2. Library Preparation Kits
- 5.2. Market Analysis, Insights and Forecast - by Technology
- 5.2.1. Sequencing by Synthesis
- 5.2.2. Ion Semiconductor
- 5.2.3. SOLiD
- 5.2.4. Nanopore Sequencing
- 5.3. Market Analysis, Insights and Forecast - by End User
- 5.3.1. Clinical Laboratory
- 5.3.2. Life Science Organization
- 5.3.3. Other End Users
- 5.4. Market Analysis, Insights and Forecast - by Region
- 5.4.1. North America
- 5.4.2. Europe
- 5.4.3. Asia Pacific
- 5.4.4. Middle East and Africa
- 5.4.5. South America
- 5.1. Market Analysis, Insights and Forecast - by Product
- 6. North America MiRNA Sequencing and Assay Industry Analysis, Insights and Forecast, 2019-2031
- 6.1. Market Analysis, Insights and Forecast - by Product
- 6.1.1. Sequencing Consumables
- 6.1.2. Library Preparation Kits
- 6.2. Market Analysis, Insights and Forecast - by Technology
- 6.2.1. Sequencing by Synthesis
- 6.2.2. Ion Semiconductor
- 6.2.3. SOLiD
- 6.2.4. Nanopore Sequencing
- 6.3. Market Analysis, Insights and Forecast - by End User
- 6.3.1. Clinical Laboratory
- 6.3.2. Life Science Organization
- 6.3.3. Other End Users
- 6.1. Market Analysis, Insights and Forecast - by Product
- 7. Europe MiRNA Sequencing and Assay Industry Analysis, Insights and Forecast, 2019-2031
- 7.1. Market Analysis, Insights and Forecast - by Product
- 7.1.1. Sequencing Consumables
- 7.1.2. Library Preparation Kits
- 7.2. Market Analysis, Insights and Forecast - by Technology
- 7.2.1. Sequencing by Synthesis
- 7.2.2. Ion Semiconductor
- 7.2.3. SOLiD
- 7.2.4. Nanopore Sequencing
- 7.3. Market Analysis, Insights and Forecast - by End User
- 7.3.1. Clinical Laboratory
- 7.3.2. Life Science Organization
- 7.3.3. Other End Users
- 7.1. Market Analysis, Insights and Forecast - by Product
- 8. Asia Pacific MiRNA Sequencing and Assay Industry Analysis, Insights and Forecast, 2019-2031
- 8.1. Market Analysis, Insights and Forecast - by Product
- 8.1.1. Sequencing Consumables
- 8.1.2. Library Preparation Kits
- 8.2. Market Analysis, Insights and Forecast - by Technology
- 8.2.1. Sequencing by Synthesis
- 8.2.2. Ion Semiconductor
- 8.2.3. SOLiD
- 8.2.4. Nanopore Sequencing
- 8.3. Market Analysis, Insights and Forecast - by End User
- 8.3.1. Clinical Laboratory
- 8.3.2. Life Science Organization
- 8.3.3. Other End Users
- 8.1. Market Analysis, Insights and Forecast - by Product
- 9. Middle East and Africa MiRNA Sequencing and Assay Industry Analysis, Insights and Forecast, 2019-2031
- 9.1. Market Analysis, Insights and Forecast - by Product
- 9.1.1. Sequencing Consumables
- 9.1.2. Library Preparation Kits
- 9.2. Market Analysis, Insights and Forecast - by Technology
- 9.2.1. Sequencing by Synthesis
- 9.2.2. Ion Semiconductor
- 9.2.3. SOLiD
- 9.2.4. Nanopore Sequencing
- 9.3. Market Analysis, Insights and Forecast - by End User
- 9.3.1. Clinical Laboratory
- 9.3.2. Life Science Organization
- 9.3.3. Other End Users
- 9.1. Market Analysis, Insights and Forecast - by Product
- 10. South America MiRNA Sequencing and Assay Industry Analysis, Insights and Forecast, 2019-2031
- 10.1. Market Analysis, Insights and Forecast - by Product
- 10.1.1. Sequencing Consumables
- 10.1.2. Library Preparation Kits
- 10.2. Market Analysis, Insights and Forecast - by Technology
- 10.2.1. Sequencing by Synthesis
- 10.2.2. Ion Semiconductor
- 10.2.3. SOLiD
- 10.2.4. Nanopore Sequencing
- 10.3. Market Analysis, Insights and Forecast - by End User
- 10.3.1. Clinical Laboratory
- 10.3.2. Life Science Organization
- 10.3.3. Other End Users
- 10.1. Market Analysis, Insights and Forecast - by Product
- 11. North America MiRNA Sequencing and Assay Industry Analysis, Insights and Forecast, 2019-2031
- 11.1. Market Analysis, Insights and Forecast - By Country/Sub-region
- 11.1.1 United States
- 11.1.2 Canada
- 11.1.3 Mexico
- 12. Europe MiRNA Sequencing and Assay Industry Analysis, Insights and Forecast, 2019-2031
- 12.1. Market Analysis, Insights and Forecast - By Country/Sub-region
- 12.1.1 Germany
- 12.1.2 United Kingdom
- 12.1.3 France
- 12.1.4 Italy
- 12.1.5 Spain
- 12.1.6 Rest of Europe
- 13. Asia Pacific MiRNA Sequencing and Assay Industry Analysis, Insights and Forecast, 2019-2031
- 13.1. Market Analysis, Insights and Forecast - By Country/Sub-region
- 13.1.1 China
- 13.1.2 Japan
- 13.1.3 India
- 13.1.4 Australia
- 13.1.5 South Korea
- 13.1.6 Rest of Asia Pacific
- 14. Middle East and Africa MiRNA Sequencing and Assay Industry Analysis, Insights and Forecast, 2019-2031
- 14.1. Market Analysis, Insights and Forecast - By Country/Sub-region
- 14.1.1 GCC
- 14.1.2 South Africa
- 14.1.3 Rest of Middle East and Africa
- 15. South America MiRNA Sequencing and Assay Industry Analysis, Insights and Forecast, 2019-2031
- 15.1. Market Analysis, Insights and Forecast - By Country/Sub-region
- 15.1.1 Brazil
- 15.1.2 Argentina
- 15.1.3 Rest of South America
- 16. Competitive Analysis
- 16.1. Global Market Share Analysis 2024
- 16.2. Company Profiles
- 16.2.1 Norgen Biotek Corporation
- 16.2.1.1. Overview
- 16.2.1.2. Products
- 16.2.1.3. SWOT Analysis
- 16.2.1.4. Recent Developments
- 16.2.1.5. Financials (Based on Availability)
- 16.2.2 Trilink Biotechnologies
- 16.2.2.1. Overview
- 16.2.2.2. Products
- 16.2.2.3. SWOT Analysis
- 16.2.2.4. Recent Developments
- 16.2.2.5. Financials (Based on Availability)
- 16.2.3 Takara Bio Inc
- 16.2.3.1. Overview
- 16.2.3.2. Products
- 16.2.3.3. SWOT Analysis
- 16.2.3.4. Recent Developments
- 16.2.3.5. Financials (Based on Availability)
- 16.2.4 Qiagen N V
- 16.2.4.1. Overview
- 16.2.4.2. Products
- 16.2.4.3. SWOT Analysis
- 16.2.4.4. Recent Developments
- 16.2.4.5. Financials (Based on Availability)
- 16.2.5 Lexogen
- 16.2.5.1. Overview
- 16.2.5.2. Products
- 16.2.5.3. SWOT Analysis
- 16.2.5.4. Recent Developments
- 16.2.5.5. Financials (Based on Availability)
- 16.2.6 Oxford Nanopore Technologies*List Not Exhaustive
- 16.2.6.1. Overview
- 16.2.6.2. Products
- 16.2.6.3. SWOT Analysis
- 16.2.6.4. Recent Developments
- 16.2.6.5. Financials (Based on Availability)
- 16.2.7 New England Biolabs Inc
- 16.2.7.1. Overview
- 16.2.7.2. Products
- 16.2.7.3. SWOT Analysis
- 16.2.7.4. Recent Developments
- 16.2.7.5. Financials (Based on Availability)
- 16.2.8 PerkinElmer Inc
- 16.2.8.1. Overview
- 16.2.8.2. Products
- 16.2.8.3. SWOT Analysis
- 16.2.8.4. Recent Developments
- 16.2.8.5. Financials (Based on Availability)
- 16.2.9 Illumina Inc
- 16.2.9.1. Overview
- 16.2.9.2. Products
- 16.2.9.3. SWOT Analysis
- 16.2.9.4. Recent Developments
- 16.2.9.5. Financials (Based on Availability)
- 16.2.10 Thermo Fisher Scientific
- 16.2.10.1. Overview
- 16.2.10.2. Products
- 16.2.10.3. SWOT Analysis
- 16.2.10.4. Recent Developments
- 16.2.10.5. Financials (Based on Availability)
- 16.2.1 Norgen Biotek Corporation
List of Figures
- Figure 1: Global MiRNA Sequencing and Assay Industry Revenue Breakdown (Million, %) by Region 2024 & 2032
- Figure 2: North America MiRNA Sequencing and Assay Industry Revenue (Million), by Country 2024 & 2032
- Figure 3: North America MiRNA Sequencing and Assay Industry Revenue Share (%), by Country 2024 & 2032
- Figure 4: Europe MiRNA Sequencing and Assay Industry Revenue (Million), by Country 2024 & 2032
- Figure 5: Europe MiRNA Sequencing and Assay Industry Revenue Share (%), by Country 2024 & 2032
- Figure 6: Asia Pacific MiRNA Sequencing and Assay Industry Revenue (Million), by Country 2024 & 2032
- Figure 7: Asia Pacific MiRNA Sequencing and Assay Industry Revenue Share (%), by Country 2024 & 2032
- Figure 8: Middle East and Africa MiRNA Sequencing and Assay Industry Revenue (Million), by Country 2024 & 2032
- Figure 9: Middle East and Africa MiRNA Sequencing and Assay Industry Revenue Share (%), by Country 2024 & 2032
- Figure 10: South America MiRNA Sequencing and Assay Industry Revenue (Million), by Country 2024 & 2032
- Figure 11: South America MiRNA Sequencing and Assay Industry Revenue Share (%), by Country 2024 & 2032
- Figure 12: North America MiRNA Sequencing and Assay Industry Revenue (Million), by Product 2024 & 2032
- Figure 13: North America MiRNA Sequencing and Assay Industry Revenue Share (%), by Product 2024 & 2032
- Figure 14: North America MiRNA Sequencing and Assay Industry Revenue (Million), by Technology 2024 & 2032
- Figure 15: North America MiRNA Sequencing and Assay Industry Revenue Share (%), by Technology 2024 & 2032
- Figure 16: North America MiRNA Sequencing and Assay Industry Revenue (Million), by End User 2024 & 2032
- Figure 17: North America MiRNA Sequencing and Assay Industry Revenue Share (%), by End User 2024 & 2032
- Figure 18: North America MiRNA Sequencing and Assay Industry Revenue (Million), by Country 2024 & 2032
- Figure 19: North America MiRNA Sequencing and Assay Industry Revenue Share (%), by Country 2024 & 2032
- Figure 20: Europe MiRNA Sequencing and Assay Industry Revenue (Million), by Product 2024 & 2032
- Figure 21: Europe MiRNA Sequencing and Assay Industry Revenue Share (%), by Product 2024 & 2032
- Figure 22: Europe MiRNA Sequencing and Assay Industry Revenue (Million), by Technology 2024 & 2032
- Figure 23: Europe MiRNA Sequencing and Assay Industry Revenue Share (%), by Technology 2024 & 2032
- Figure 24: Europe MiRNA Sequencing and Assay Industry Revenue (Million), by End User 2024 & 2032
- Figure 25: Europe MiRNA Sequencing and Assay Industry Revenue Share (%), by End User 2024 & 2032
- Figure 26: Europe MiRNA Sequencing and Assay Industry Revenue (Million), by Country 2024 & 2032
- Figure 27: Europe MiRNA Sequencing and Assay Industry Revenue Share (%), by Country 2024 & 2032
- Figure 28: Asia Pacific MiRNA Sequencing and Assay Industry Revenue (Million), by Product 2024 & 2032
- Figure 29: Asia Pacific MiRNA Sequencing and Assay Industry Revenue Share (%), by Product 2024 & 2032
- Figure 30: Asia Pacific MiRNA Sequencing and Assay Industry Revenue (Million), by Technology 2024 & 2032
- Figure 31: Asia Pacific MiRNA Sequencing and Assay Industry Revenue Share (%), by Technology 2024 & 2032
- Figure 32: Asia Pacific MiRNA Sequencing and Assay Industry Revenue (Million), by End User 2024 & 2032
- Figure 33: Asia Pacific MiRNA Sequencing and Assay Industry Revenue Share (%), by End User 2024 & 2032
- Figure 34: Asia Pacific MiRNA Sequencing and Assay Industry Revenue (Million), by Country 2024 & 2032
- Figure 35: Asia Pacific MiRNA Sequencing and Assay Industry Revenue Share (%), by Country 2024 & 2032
- Figure 36: Middle East and Africa MiRNA Sequencing and Assay Industry Revenue (Million), by Product 2024 & 2032
- Figure 37: Middle East and Africa MiRNA Sequencing and Assay Industry Revenue Share (%), by Product 2024 & 2032
- Figure 38: Middle East and Africa MiRNA Sequencing and Assay Industry Revenue (Million), by Technology 2024 & 2032
- Figure 39: Middle East and Africa MiRNA Sequencing and Assay Industry Revenue Share (%), by Technology 2024 & 2032
- Figure 40: Middle East and Africa MiRNA Sequencing and Assay Industry Revenue (Million), by End User 2024 & 2032
- Figure 41: Middle East and Africa MiRNA Sequencing and Assay Industry Revenue Share (%), by End User 2024 & 2032
- Figure 42: Middle East and Africa MiRNA Sequencing and Assay Industry Revenue (Million), by Country 2024 & 2032
- Figure 43: Middle East and Africa MiRNA Sequencing and Assay Industry Revenue Share (%), by Country 2024 & 2032
- Figure 44: South America MiRNA Sequencing and Assay Industry Revenue (Million), by Product 2024 & 2032
- Figure 45: South America MiRNA Sequencing and Assay Industry Revenue Share (%), by Product 2024 & 2032
- Figure 46: South America MiRNA Sequencing and Assay Industry Revenue (Million), by Technology 2024 & 2032
- Figure 47: South America MiRNA Sequencing and Assay Industry Revenue Share (%), by Technology 2024 & 2032
- Figure 48: South America MiRNA Sequencing and Assay Industry Revenue (Million), by End User 2024 & 2032
- Figure 49: South America MiRNA Sequencing and Assay Industry Revenue Share (%), by End User 2024 & 2032
- Figure 50: South America MiRNA Sequencing and Assay Industry Revenue (Million), by Country 2024 & 2032
- Figure 51: South America MiRNA Sequencing and Assay Industry Revenue Share (%), by Country 2024 & 2032
List of Tables
- Table 1: Global MiRNA Sequencing and Assay Industry Revenue Million Forecast, by Region 2019 & 2032
- Table 2: Global MiRNA Sequencing and Assay Industry Revenue Million Forecast, by Product 2019 & 2032
- Table 3: Global MiRNA Sequencing and Assay Industry Revenue Million Forecast, by Technology 2019 & 2032
- Table 4: Global MiRNA Sequencing and Assay Industry Revenue Million Forecast, by End User 2019 & 2032
- Table 5: Global MiRNA Sequencing and Assay Industry Revenue Million Forecast, by Region 2019 & 2032
- Table 6: Global MiRNA Sequencing and Assay Industry Revenue Million Forecast, by Country 2019 & 2032
- Table 7: United States MiRNA Sequencing and Assay Industry Revenue (Million) Forecast, by Application 2019 & 2032
- Table 8: Canada MiRNA Sequencing and Assay Industry Revenue (Million) Forecast, by Application 2019 & 2032
- Table 9: Mexico MiRNA Sequencing and Assay Industry Revenue (Million) Forecast, by Application 2019 & 2032
- Table 10: Global MiRNA Sequencing and Assay Industry Revenue Million Forecast, by Country 2019 & 2032
- Table 11: Germany MiRNA Sequencing and Assay Industry Revenue (Million) Forecast, by Application 2019 & 2032
- Table 12: United Kingdom MiRNA Sequencing and Assay Industry Revenue (Million) Forecast, by Application 2019 & 2032
- Table 13: France MiRNA Sequencing and Assay Industry Revenue (Million) Forecast, by Application 2019 & 2032
- Table 14: Italy MiRNA Sequencing and Assay Industry Revenue (Million) Forecast, by Application 2019 & 2032
- Table 15: Spain MiRNA Sequencing and Assay Industry Revenue (Million) Forecast, by Application 2019 & 2032
- Table 16: Rest of Europe MiRNA Sequencing and Assay Industry Revenue (Million) Forecast, by Application 2019 & 2032
- Table 17: Global MiRNA Sequencing and Assay Industry Revenue Million Forecast, by Country 2019 & 2032
- Table 18: China MiRNA Sequencing and Assay Industry Revenue (Million) Forecast, by Application 2019 & 2032
- Table 19: Japan MiRNA Sequencing and Assay Industry Revenue (Million) Forecast, by Application 2019 & 2032
- Table 20: India MiRNA Sequencing and Assay Industry Revenue (Million) Forecast, by Application 2019 & 2032
- Table 21: Australia MiRNA Sequencing and Assay Industry Revenue (Million) Forecast, by Application 2019 & 2032
- Table 22: South Korea MiRNA Sequencing and Assay Industry Revenue (Million) Forecast, by Application 2019 & 2032
- Table 23: Rest of Asia Pacific MiRNA Sequencing and Assay Industry Revenue (Million) Forecast, by Application 2019 & 2032
- Table 24: Global MiRNA Sequencing and Assay Industry Revenue Million Forecast, by Country 2019 & 2032
- Table 25: GCC MiRNA Sequencing and Assay Industry Revenue (Million) Forecast, by Application 2019 & 2032
- Table 26: South Africa MiRNA Sequencing and Assay Industry Revenue (Million) Forecast, by Application 2019 & 2032
- Table 27: Rest of Middle East and Africa MiRNA Sequencing and Assay Industry Revenue (Million) Forecast, by Application 2019 & 2032
- Table 28: Global MiRNA Sequencing and Assay Industry Revenue Million Forecast, by Country 2019 & 2032
- Table 29: Brazil MiRNA Sequencing and Assay Industry Revenue (Million) Forecast, by Application 2019 & 2032
- Table 30: Argentina MiRNA Sequencing and Assay Industry Revenue (Million) Forecast, by Application 2019 & 2032
- Table 31: Rest of South America MiRNA Sequencing and Assay Industry Revenue (Million) Forecast, by Application 2019 & 2032
- Table 32: Global MiRNA Sequencing and Assay Industry Revenue Million Forecast, by Product 2019 & 2032
- Table 33: Global MiRNA Sequencing and Assay Industry Revenue Million Forecast, by Technology 2019 & 2032
- Table 34: Global MiRNA Sequencing and Assay Industry Revenue Million Forecast, by End User 2019 & 2032
- Table 35: Global MiRNA Sequencing and Assay Industry Revenue Million Forecast, by Country 2019 & 2032
- Table 36: United States MiRNA Sequencing and Assay Industry Revenue (Million) Forecast, by Application 2019 & 2032
- Table 37: Canada MiRNA Sequencing and Assay Industry Revenue (Million) Forecast, by Application 2019 & 2032
- Table 38: Mexico MiRNA Sequencing and Assay Industry Revenue (Million) Forecast, by Application 2019 & 2032
- Table 39: Global MiRNA Sequencing and Assay Industry Revenue Million Forecast, by Product 2019 & 2032
- Table 40: Global MiRNA Sequencing and Assay Industry Revenue Million Forecast, by Technology 2019 & 2032
- Table 41: Global MiRNA Sequencing and Assay Industry Revenue Million Forecast, by End User 2019 & 2032
- Table 42: Global MiRNA Sequencing and Assay Industry Revenue Million Forecast, by Country 2019 & 2032
- Table 43: Germany MiRNA Sequencing and Assay Industry Revenue (Million) Forecast, by Application 2019 & 2032
- Table 44: United Kingdom MiRNA Sequencing and Assay Industry Revenue (Million) Forecast, by Application 2019 & 2032
- Table 45: France MiRNA Sequencing and Assay Industry Revenue (Million) Forecast, by Application 2019 & 2032
- Table 46: Italy MiRNA Sequencing and Assay Industry Revenue (Million) Forecast, by Application 2019 & 2032
- Table 47: Spain MiRNA Sequencing and Assay Industry Revenue (Million) Forecast, by Application 2019 & 2032
- Table 48: Rest of Europe MiRNA Sequencing and Assay Industry Revenue (Million) Forecast, by Application 2019 & 2032
- Table 49: Global MiRNA Sequencing and Assay Industry Revenue Million Forecast, by Product 2019 & 2032
- Table 50: Global MiRNA Sequencing and Assay Industry Revenue Million Forecast, by Technology 2019 & 2032
- Table 51: Global MiRNA Sequencing and Assay Industry Revenue Million Forecast, by End User 2019 & 2032
- Table 52: Global MiRNA Sequencing and Assay Industry Revenue Million Forecast, by Country 2019 & 2032
- Table 53: China MiRNA Sequencing and Assay Industry Revenue (Million) Forecast, by Application 2019 & 2032
- Table 54: Japan MiRNA Sequencing and Assay Industry Revenue (Million) Forecast, by Application 2019 & 2032
- Table 55: India MiRNA Sequencing and Assay Industry Revenue (Million) Forecast, by Application 2019 & 2032
- Table 56: Australia MiRNA Sequencing and Assay Industry Revenue (Million) Forecast, by Application 2019 & 2032
- Table 57: South Korea MiRNA Sequencing and Assay Industry Revenue (Million) Forecast, by Application 2019 & 2032
- Table 58: Rest of Asia Pacific MiRNA Sequencing and Assay Industry Revenue (Million) Forecast, by Application 2019 & 2032
- Table 59: Global MiRNA Sequencing and Assay Industry Revenue Million Forecast, by Product 2019 & 2032
- Table 60: Global MiRNA Sequencing and Assay Industry Revenue Million Forecast, by Technology 2019 & 2032
- Table 61: Global MiRNA Sequencing and Assay Industry Revenue Million Forecast, by End User 2019 & 2032
- Table 62: Global MiRNA Sequencing and Assay Industry Revenue Million Forecast, by Country 2019 & 2032
- Table 63: GCC MiRNA Sequencing and Assay Industry Revenue (Million) Forecast, by Application 2019 & 2032
- Table 64: South Africa MiRNA Sequencing and Assay Industry Revenue (Million) Forecast, by Application 2019 & 2032
- Table 65: Rest of Middle East and Africa MiRNA Sequencing and Assay Industry Revenue (Million) Forecast, by Application 2019 & 2032
- Table 66: Global MiRNA Sequencing and Assay Industry Revenue Million Forecast, by Product 2019 & 2032
- Table 67: Global MiRNA Sequencing and Assay Industry Revenue Million Forecast, by Technology 2019 & 2032
- Table 68: Global MiRNA Sequencing and Assay Industry Revenue Million Forecast, by End User 2019 & 2032
- Table 69: Global MiRNA Sequencing and Assay Industry Revenue Million Forecast, by Country 2019 & 2032
- Table 70: Brazil MiRNA Sequencing and Assay Industry Revenue (Million) Forecast, by Application 2019 & 2032
- Table 71: Argentina MiRNA Sequencing and Assay Industry Revenue (Million) Forecast, by Application 2019 & 2032
- Table 72: Rest of South America MiRNA Sequencing and Assay Industry Revenue (Million) Forecast, by Application 2019 & 2032
Frequently Asked Questions
1. What is the projected Compound Annual Growth Rate (CAGR) of the MiRNA Sequencing and Assay Industry?
The projected CAGR is approximately 10.90%.
2. Which companies are prominent players in the MiRNA Sequencing and Assay Industry?
Key companies in the market include Norgen Biotek Corporation, Trilink Biotechnologies, Takara Bio Inc, Qiagen N V, Lexogen, Oxford Nanopore Technologies*List Not Exhaustive, New England Biolabs Inc, PerkinElmer Inc, Illumina Inc, Thermo Fisher Scientific.
3. What are the main segments of the MiRNA Sequencing and Assay Industry?
The market segments include Product, Technology, End User.
4. Can you provide details about the market size?
The market size is estimated to be USD XX Million as of 2022.
5. What are some drivers contributing to market growth?
MiRNA Sequencing and Assay Sequencing Supremacy Over Other Methods; Increased Research in the Field of Genomics; Reduced Sequencing Costs.
6. What are the notable trends driving market growth?
Library Preparation Kits are Expected to Hold the Largest Market Share in the miRNA Sequencing and Assay Market.
7. Are there any restraints impacting market growth?
Paucity of Expert and Need for Computing Infrastructure.
8. Can you provide examples of recent developments in the market?
April 2022: HTC Molecular Diagnostics Inc. unveiled new features of its proprietary HTG EdgeSeq technology. The company has improved its technology, and now its new sample preparation harmonization enables miRNA and mRNA profiling without the need for additional samples.
9. What pricing options are available for accessing the report?
Pricing options include single-user, multi-user, and enterprise licenses priced at USD 4750, USD 5250, and USD 8750 respectively.
10. Is the market size provided in terms of value or volume?
The market size is provided in terms of value, measured in Million.
11. Are there any specific market keywords associated with the report?
Yes, the market keyword associated with the report is "MiRNA Sequencing and Assay Industry," which aids in identifying and referencing the specific market segment covered.
12. How do I determine which pricing option suits my needs best?
The pricing options vary based on user requirements and access needs. Individual users may opt for single-user licenses, while businesses requiring broader access may choose multi-user or enterprise licenses for cost-effective access to the report.
13. Are there any additional resources or data provided in the MiRNA Sequencing and Assay Industry report?
While the report offers comprehensive insights, it's advisable to review the specific contents or supplementary materials provided to ascertain if additional resources or data are available.
14. How can I stay updated on further developments or reports in the MiRNA Sequencing and Assay Industry?
To stay informed about further developments, trends, and reports in the MiRNA Sequencing and Assay Industry, consider subscribing to industry newsletters, following relevant companies and organizations, or regularly checking reputable industry news sources and publications.
Methodology
Step 1 - Identification of Relevant Samples Size from Population Database


Step 2 - Approaches for Defining Global Market Size (Value, Volume* & Price*)

Note*: In applicable scenarios
Step 3 - Data Sources
Primary Research
- Web Analytics
- Survey Reports
- Research Institute
- Latest Research Reports
- Opinion Leaders
Secondary Research
- Annual Reports
- White Paper
- Latest Press Release
- Industry Association
- Paid Database
- Investor Presentations

Step 4 - Data Triangulation
Involves using different sources of information in order to increase the validity of a study
These sources are likely to be stakeholders in a program - participants, other researchers, program staff, other community members, and so on.
Then we put all data in single framework & apply various statistical tools to find out the dynamic on the market.
During the analysis stage, feedback from the stakeholder groups would be compared to determine areas of agreement as well as areas of divergence


