
Key Insights
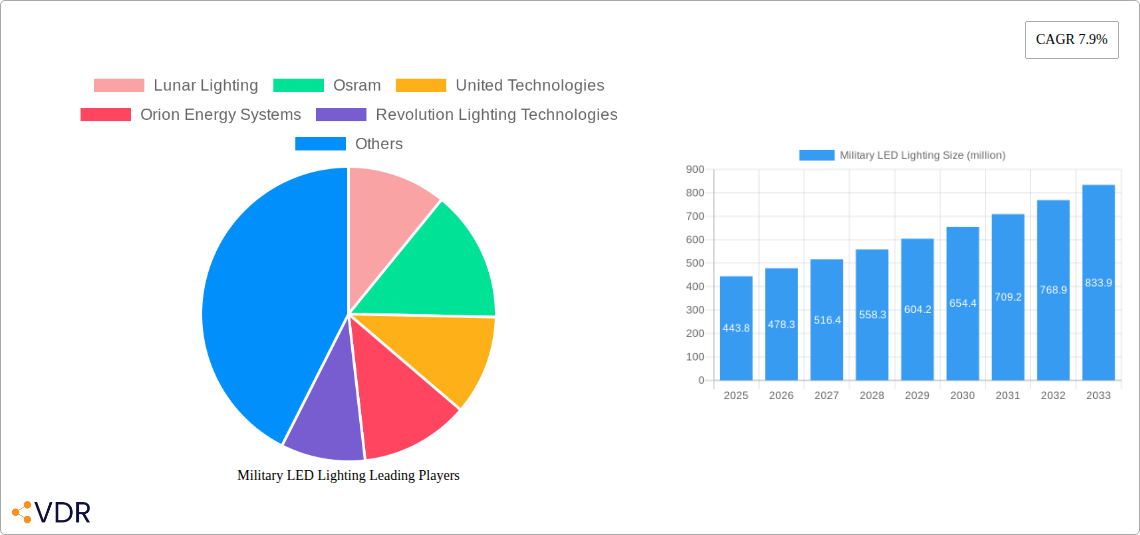
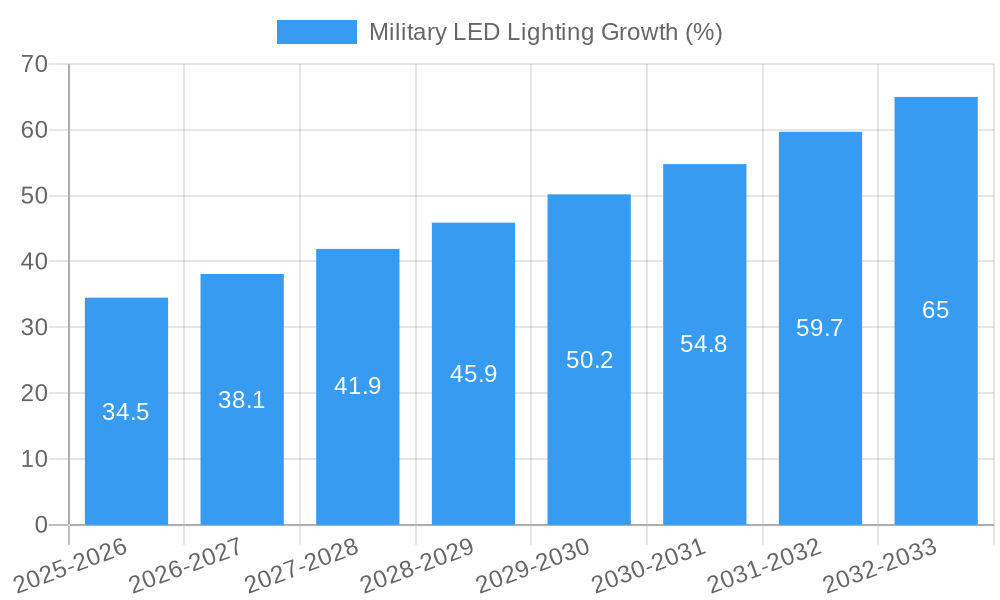
The Military LED Lighting market is experiencing robust growth, projected to reach $443.8 million in 2025 and exhibiting a Compound Annual Growth Rate (CAGR) of 7.9% from 2025 to 2033. This expansion is driven by several key factors. Firstly, the increasing adoption of energy-efficient lighting solutions within military operations is a major catalyst. LED lighting offers significant advantages over traditional lighting technologies, including reduced energy consumption, longer lifespan, and improved durability, which are critical in demanding military environments. Secondly, advancements in LED technology are continuously enhancing brightness, color rendering, and overall performance, making them increasingly suitable for a wider range of military applications, from ground vehicles and aircraft to naval vessels and base installations. Furthermore, enhanced safety and improved situational awareness are also significant drivers, as LED lighting can provide better visibility and reduce eye strain for personnel operating in challenging conditions. Finally, government initiatives promoting energy efficiency and sustainability within defense budgets are further fueling market expansion.
The competitive landscape is characterized by a mix of established players and emerging companies. Key players like Lunar Lighting, Osram, United Technologies, Orion Energy Systems, Revolution Lighting Technologies, Laminators Technologies, Larson Electronics, Deco Lighting, Honeywell, and Rockwell Collins are actively involved in developing and supplying innovative LED lighting solutions tailored to military specifications. These companies are focusing on research and development to create durable, reliable, and energy-efficient products that meet the stringent requirements of military applications. Market segmentation, while not explicitly provided, likely includes various lighting types (e.g., high-intensity, low-intensity, specialized tactical lighting), applications (e.g., vehicle lighting, airfield lighting, indoor/outdoor base lighting), and geographic regions. Future growth will depend on continuous technological innovation, government spending on defense modernization, and the increasing demand for superior lighting solutions across various military sectors.
Military LED Lighting Market Report: 2019-2033
This comprehensive report provides a detailed analysis of the Military LED Lighting market, offering invaluable insights for industry professionals, investors, and strategic decision-makers. The study covers the period from 2019 to 2033, with a base year of 2025 and a forecast period extending to 2033. The report meticulously examines market dynamics, growth trends, regional dominance, product landscapes, and key players, equipping readers with the knowledge necessary to navigate this rapidly evolving sector. The parent market is the broader defense and aerospace lighting market, while the child market is specifically military applications. The market size is projected to reach xx million units by 2033.
Military LED Lighting Market Dynamics & Structure
This section analyzes the competitive landscape, technological advancements, regulatory influences, and market trends shaping the Military LED Lighting industry. The market is moderately concentrated, with key players holding significant shares. However, the entry of innovative startups is also impacting the market dynamics.
- Market Concentration: The top 5 players account for approximately xx% of the market share in 2025. This is expected to slightly decrease to xx% by 2033 due to increased competition.
- Technological Innovation: Advancements in LED technology, such as improved efficiency, durability, and miniaturization, are driving market growth. However, high initial investment costs for R&D and manufacturing present a barrier to entry for smaller players.
- Regulatory Framework: Stringent military standards and certifications are essential, impacting the product development and deployment process. Compliance costs can be significant.
- Competitive Product Substitutes: Traditional lighting technologies (e.g., incandescent and fluorescent) are gradually being replaced, but some niche applications still rely on these older technologies.
- End-User Demographics: The primary end-users are military branches (army, navy, air force), defense contractors, and government agencies worldwide.
- M&A Trends: The number of M&A deals in the Military LED Lighting sector between 2019 and 2024 averaged xx deals annually. This trend is expected to continue, with a projected xx deals annually from 2025 to 2033, driven by the need for consolidation and access to advanced technologies.
Military LED Lighting Growth Trends & Insights
The Military LED Lighting market experienced significant growth during the historical period (2019-2024), with a CAGR of xx%. This robust growth is attributed to several factors, including increasing defense budgets globally, the growing demand for energy-efficient and durable lighting solutions within the military, and technological advancements that are improving the performance and cost-effectiveness of Military LED Lighting. The market is expected to continue its expansion during the forecast period (2025-2033), driven by ongoing technological innovations, the increasing adoption of LED lighting in military vehicles and equipment, and the rising focus on enhancing the safety and operational effectiveness of military forces. Market penetration is expected to increase from xx% in 2025 to xx% by 2033. The CAGR for the forecast period is projected at xx%.
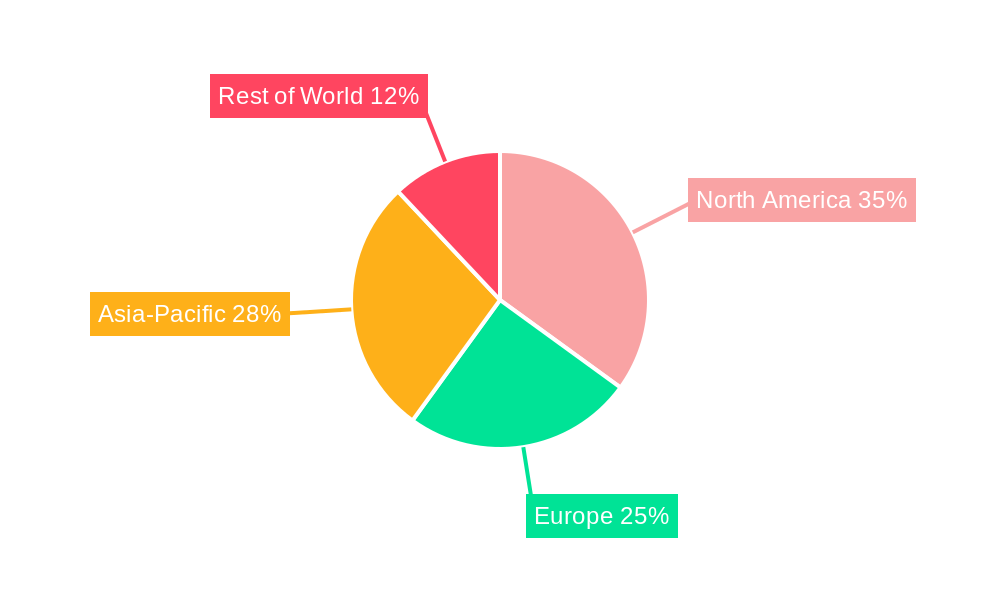
Dominant Regions, Countries, or Segments in Military LED Lighting
North America currently holds the largest market share in the Military LED Lighting sector, driven by significant defense spending and technological advancements in the region. However, the Asia-Pacific region is experiencing rapid growth, fueled by increasing defense budgets in countries like China and India, and is projected to witness substantial growth in the coming years.
- Key Drivers for North America: High defense spending, strong technological infrastructure, and presence of major manufacturers.
- Key Drivers for Asia-Pacific: Rising defense budgets, modernization of military infrastructure, and increasing adoption of advanced technologies.
- Europe: Stable market growth driven by continuous upgrades in military equipment and infrastructure across several European nations.
- Market Share: North America holds approximately xx% of the global market share in 2025, expected to slightly decrease to xx% by 2033 as the Asia-Pacific region expands.
Military LED Lighting Product Landscape
Military LED Lighting products are designed to withstand harsh environmental conditions and offer superior performance compared to traditional lighting solutions. Innovations focus on enhancing durability, efficiency, and features like night vision compatibility and reduced infrared signature. These advancements are driven by the specific demands of military applications, such as improved visibility in low-light conditions, enhanced situational awareness, and reduced power consumption for extended operational capabilities. Key product segments include high-intensity lighting systems, compact and ruggedized fixtures, and specialized lighting for night vision applications.
Key Drivers, Barriers & Challenges in Military LED Lighting
Key Drivers: Increased defense budgets globally, the growing need for energy-efficient and durable lighting solutions, advancements in LED technology, and stringent environmental regulations are key drivers.
Challenges & Restraints: High initial investment costs, stringent military standards and certifications, and potential supply chain disruptions related to raw materials and manufacturing capabilities pose challenges. The competitive landscape also presents hurdles for smaller players attempting to gain market share. Estimated quantifiable impact of supply chain disruptions is a xx% reduction in production capacity in 2025.
Emerging Opportunities in Military LED Lighting
Emerging opportunities include the integration of smart lighting technologies, the development of specialized lighting solutions for drones and unmanned aerial vehicles (UAVs), and the expansion into new military applications like wearable lighting systems. Furthermore, the growing demand for sustainable and environmentally friendly solutions presents opportunities for manufacturers to develop eco-friendly LED lighting products that meet the rigorous requirements of the military sector.
Growth Accelerators in the Military LED Lighting Industry
Technological breakthroughs in LED technology, strategic partnerships between manufacturers and defense contractors, and government initiatives to promote energy efficiency in the military are key catalysts for long-term growth. The development of innovative lighting solutions specifically designed for military applications will further drive market expansion.
Key Players Shaping the Military LED Lighting Market
- Lunar Lighting
- Osram
- United Technologies
- Orion Energy Systems
- Revolution Lighting Technologies
- Laminators technologies
- Larson Electronics
- Deco Lighting
- Honeywell
- Rockwell Collins
Notable Milestones in Military LED Lighting Sector
- 2020, Q3: Introduction of a new high-intensity LED lighting system by Lunar Lighting, significantly improving visibility in adverse weather conditions.
- 2022, Q1: Acquisition of a smaller LED lighting manufacturer by Osram, expanding its product portfolio and market reach.
- 2023, Q4: Successful implementation of energy-efficient LED lighting in a major military base, demonstrating cost and efficiency benefits. (Further milestones can be added as needed.)
In-Depth Military LED Lighting Market Outlook
The Military LED Lighting market is poised for sustained growth, driven by ongoing technological advancements, increasing defense budgets, and the growing adoption of energy-efficient and durable lighting solutions in military applications. Strategic partnerships, product innovation, and expansion into new markets will create significant opportunities for key players in the coming years. The long-term outlook remains positive, with substantial growth potential in both established and emerging markets.
Military LED Lighting Segmentation
-
1. Application
- 1.1. Ground
- 1.2. Airborne
- 1.3. Marine
-
2. Types
- 2.1. High Power
- 2.2. Medium Power
- 2.3. Low Power
Military LED Lighting Segmentation By Geography
-
1. North America
- 1.1. United States
- 1.2. Canada
- 1.3. Mexico
-
2. South America
- 2.1. Brazil
- 2.2. Argentina
- 2.3. Rest of South America
-
3. Europe
- 3.1. United Kingdom
- 3.2. Germany
- 3.3. France
- 3.4. Italy
- 3.5. Spain
- 3.6. Russia
- 3.7. Benelux
- 3.8. Nordics
- 3.9. Rest of Europe
-
4. Middle East & Africa
- 4.1. Turkey
- 4.2. Israel
- 4.3. GCC
- 4.4. North Africa
- 4.5. South Africa
- 4.6. Rest of Middle East & Africa
-
5. Asia Pacific
- 5.1. China
- 5.2. India
- 5.3. Japan
- 5.4. South Korea
- 5.5. ASEAN
- 5.6. Oceania
- 5.7. Rest of Asia Pacific
Military LED Lighting REPORT HIGHLIGHTS
| Aspects | Details |
|---|---|
| Study Period | 2019-2033 |
| Base Year | 2024 |
| Estimated Year | 2025 |
| Forecast Period | 2025-2033 |
| Historical Period | 2019-2024 |
| Growth Rate | CAGR of 7.9% from 2019-2033 |
| Segmentation |
|
Table of Contents
- 1. Introduction
- 1.1. Research Scope
- 1.2. Market Segmentation
- 1.3. Research Methodology
- 1.4. Definitions and Assumptions
- 2. Executive Summary
- 2.1. Introduction
- 3. Market Dynamics
- 3.1. Introduction
- 3.2. Market Drivers
- 3.3. Market Restrains
- 3.4. Market Trends
- 4. Market Factor Analysis
- 4.1. Porters Five Forces
- 4.2. Supply/Value Chain
- 4.3. PESTEL analysis
- 4.4. Market Entropy
- 4.5. Patent/Trademark Analysis
- 5. Global Military LED Lighting Analysis, Insights and Forecast, 2019-2031
- 5.1. Market Analysis, Insights and Forecast - by Application
- 5.1.1. Ground
- 5.1.2. Airborne
- 5.1.3. Marine
- 5.2. Market Analysis, Insights and Forecast - by Types
- 5.2.1. High Power
- 5.2.2. Medium Power
- 5.2.3. Low Power
- 5.3. Market Analysis, Insights and Forecast - by Region
- 5.3.1. North America
- 5.3.2. South America
- 5.3.3. Europe
- 5.3.4. Middle East & Africa
- 5.3.5. Asia Pacific
- 5.1. Market Analysis, Insights and Forecast - by Application
- 6. North America Military LED Lighting Analysis, Insights and Forecast, 2019-2031
- 6.1. Market Analysis, Insights and Forecast - by Application
- 6.1.1. Ground
- 6.1.2. Airborne
- 6.1.3. Marine
- 6.2. Market Analysis, Insights and Forecast - by Types
- 6.2.1. High Power
- 6.2.2. Medium Power
- 6.2.3. Low Power
- 6.1. Market Analysis, Insights and Forecast - by Application
- 7. South America Military LED Lighting Analysis, Insights and Forecast, 2019-2031
- 7.1. Market Analysis, Insights and Forecast - by Application
- 7.1.1. Ground
- 7.1.2. Airborne
- 7.1.3. Marine
- 7.2. Market Analysis, Insights and Forecast - by Types
- 7.2.1. High Power
- 7.2.2. Medium Power
- 7.2.3. Low Power
- 7.1. Market Analysis, Insights and Forecast - by Application
- 8. Europe Military LED Lighting Analysis, Insights and Forecast, 2019-2031
- 8.1. Market Analysis, Insights and Forecast - by Application
- 8.1.1. Ground
- 8.1.2. Airborne
- 8.1.3. Marine
- 8.2. Market Analysis, Insights and Forecast - by Types
- 8.2.1. High Power
- 8.2.2. Medium Power
- 8.2.3. Low Power
- 8.1. Market Analysis, Insights and Forecast - by Application
- 9. Middle East & Africa Military LED Lighting Analysis, Insights and Forecast, 2019-2031
- 9.1. Market Analysis, Insights and Forecast - by Application
- 9.1.1. Ground
- 9.1.2. Airborne
- 9.1.3. Marine
- 9.2. Market Analysis, Insights and Forecast - by Types
- 9.2.1. High Power
- 9.2.2. Medium Power
- 9.2.3. Low Power
- 9.1. Market Analysis, Insights and Forecast - by Application
- 10. Asia Pacific Military LED Lighting Analysis, Insights and Forecast, 2019-2031
- 10.1. Market Analysis, Insights and Forecast - by Application
- 10.1.1. Ground
- 10.1.2. Airborne
- 10.1.3. Marine
- 10.2. Market Analysis, Insights and Forecast - by Types
- 10.2.1. High Power
- 10.2.2. Medium Power
- 10.2.3. Low Power
- 10.1. Market Analysis, Insights and Forecast - by Application
- 11. Competitive Analysis
- 11.1. Global Market Share Analysis 2024
- 11.2. Company Profiles
- 11.2.1 Lunar Lighting
- 11.2.1.1. Overview
- 11.2.1.2. Products
- 11.2.1.3. SWOT Analysis
- 11.2.1.4. Recent Developments
- 11.2.1.5. Financials (Based on Availability)
- 11.2.2 Osram
- 11.2.2.1. Overview
- 11.2.2.2. Products
- 11.2.2.3. SWOT Analysis
- 11.2.2.4. Recent Developments
- 11.2.2.5. Financials (Based on Availability)
- 11.2.3 United Technologies
- 11.2.3.1. Overview
- 11.2.3.2. Products
- 11.2.3.3. SWOT Analysis
- 11.2.3.4. Recent Developments
- 11.2.3.5. Financials (Based on Availability)
- 11.2.4 Orion Energy Systems
- 11.2.4.1. Overview
- 11.2.4.2. Products
- 11.2.4.3. SWOT Analysis
- 11.2.4.4. Recent Developments
- 11.2.4.5. Financials (Based on Availability)
- 11.2.5 Revolution Lighting Technologies
- 11.2.5.1. Overview
- 11.2.5.2. Products
- 11.2.5.3. SWOT Analysis
- 11.2.5.4. Recent Developments
- 11.2.5.5. Financials (Based on Availability)
- 11.2.6 Laminators technologies
- 11.2.6.1. Overview
- 11.2.6.2. Products
- 11.2.6.3. SWOT Analysis
- 11.2.6.4. Recent Developments
- 11.2.6.5. Financials (Based on Availability)
- 11.2.7 Larson Electronics
- 11.2.7.1. Overview
- 11.2.7.2. Products
- 11.2.7.3. SWOT Analysis
- 11.2.7.4. Recent Developments
- 11.2.7.5. Financials (Based on Availability)
- 11.2.8 Deco Lighting
- 11.2.8.1. Overview
- 11.2.8.2. Products
- 11.2.8.3. SWOT Analysis
- 11.2.8.4. Recent Developments
- 11.2.8.5. Financials (Based on Availability)
- 11.2.9 Honeywell
- 11.2.9.1. Overview
- 11.2.9.2. Products
- 11.2.9.3. SWOT Analysis
- 11.2.9.4. Recent Developments
- 11.2.9.5. Financials (Based on Availability)
- 11.2.10 Rockwell Collins
- 11.2.10.1. Overview
- 11.2.10.2. Products
- 11.2.10.3. SWOT Analysis
- 11.2.10.4. Recent Developments
- 11.2.10.5. Financials (Based on Availability)
- 11.2.1 Lunar Lighting
List of Figures
- Figure 1: Global Military LED Lighting Revenue Breakdown (million, %) by Region 2024 & 2032
- Figure 2: North America Military LED Lighting Revenue (million), by Application 2024 & 2032
- Figure 3: North America Military LED Lighting Revenue Share (%), by Application 2024 & 2032
- Figure 4: North America Military LED Lighting Revenue (million), by Types 2024 & 2032
- Figure 5: North America Military LED Lighting Revenue Share (%), by Types 2024 & 2032
- Figure 6: North America Military LED Lighting Revenue (million), by Country 2024 & 2032
- Figure 7: North America Military LED Lighting Revenue Share (%), by Country 2024 & 2032
- Figure 8: South America Military LED Lighting Revenue (million), by Application 2024 & 2032
- Figure 9: South America Military LED Lighting Revenue Share (%), by Application 2024 & 2032
- Figure 10: South America Military LED Lighting Revenue (million), by Types 2024 & 2032
- Figure 11: South America Military LED Lighting Revenue Share (%), by Types 2024 & 2032
- Figure 12: South America Military LED Lighting Revenue (million), by Country 2024 & 2032
- Figure 13: South America Military LED Lighting Revenue Share (%), by Country 2024 & 2032
- Figure 14: Europe Military LED Lighting Revenue (million), by Application 2024 & 2032
- Figure 15: Europe Military LED Lighting Revenue Share (%), by Application 2024 & 2032
- Figure 16: Europe Military LED Lighting Revenue (million), by Types 2024 & 2032
- Figure 17: Europe Military LED Lighting Revenue Share (%), by Types 2024 & 2032
- Figure 18: Europe Military LED Lighting Revenue (million), by Country 2024 & 2032
- Figure 19: Europe Military LED Lighting Revenue Share (%), by Country 2024 & 2032
- Figure 20: Middle East & Africa Military LED Lighting Revenue (million), by Application 2024 & 2032
- Figure 21: Middle East & Africa Military LED Lighting Revenue Share (%), by Application 2024 & 2032
- Figure 22: Middle East & Africa Military LED Lighting Revenue (million), by Types 2024 & 2032
- Figure 23: Middle East & Africa Military LED Lighting Revenue Share (%), by Types 2024 & 2032
- Figure 24: Middle East & Africa Military LED Lighting Revenue (million), by Country 2024 & 2032
- Figure 25: Middle East & Africa Military LED Lighting Revenue Share (%), by Country 2024 & 2032
- Figure 26: Asia Pacific Military LED Lighting Revenue (million), by Application 2024 & 2032
- Figure 27: Asia Pacific Military LED Lighting Revenue Share (%), by Application 2024 & 2032
- Figure 28: Asia Pacific Military LED Lighting Revenue (million), by Types 2024 & 2032
- Figure 29: Asia Pacific Military LED Lighting Revenue Share (%), by Types 2024 & 2032
- Figure 30: Asia Pacific Military LED Lighting Revenue (million), by Country 2024 & 2032
- Figure 31: Asia Pacific Military LED Lighting Revenue Share (%), by Country 2024 & 2032
List of Tables
- Table 1: Global Military LED Lighting Revenue million Forecast, by Region 2019 & 2032
- Table 2: Global Military LED Lighting Revenue million Forecast, by Application 2019 & 2032
- Table 3: Global Military LED Lighting Revenue million Forecast, by Types 2019 & 2032
- Table 4: Global Military LED Lighting Revenue million Forecast, by Region 2019 & 2032
- Table 5: Global Military LED Lighting Revenue million Forecast, by Application 2019 & 2032
- Table 6: Global Military LED Lighting Revenue million Forecast, by Types 2019 & 2032
- Table 7: Global Military LED Lighting Revenue million Forecast, by Country 2019 & 2032
- Table 8: United States Military LED Lighting Revenue (million) Forecast, by Application 2019 & 2032
- Table 9: Canada Military LED Lighting Revenue (million) Forecast, by Application 2019 & 2032
- Table 10: Mexico Military LED Lighting Revenue (million) Forecast, by Application 2019 & 2032
- Table 11: Global Military LED Lighting Revenue million Forecast, by Application 2019 & 2032
- Table 12: Global Military LED Lighting Revenue million Forecast, by Types 2019 & 2032
- Table 13: Global Military LED Lighting Revenue million Forecast, by Country 2019 & 2032
- Table 14: Brazil Military LED Lighting Revenue (million) Forecast, by Application 2019 & 2032
- Table 15: Argentina Military LED Lighting Revenue (million) Forecast, by Application 2019 & 2032
- Table 16: Rest of South America Military LED Lighting Revenue (million) Forecast, by Application 2019 & 2032
- Table 17: Global Military LED Lighting Revenue million Forecast, by Application 2019 & 2032
- Table 18: Global Military LED Lighting Revenue million Forecast, by Types 2019 & 2032
- Table 19: Global Military LED Lighting Revenue million Forecast, by Country 2019 & 2032
- Table 20: United Kingdom Military LED Lighting Revenue (million) Forecast, by Application 2019 & 2032
- Table 21: Germany Military LED Lighting Revenue (million) Forecast, by Application 2019 & 2032
- Table 22: France Military LED Lighting Revenue (million) Forecast, by Application 2019 & 2032
- Table 23: Italy Military LED Lighting Revenue (million) Forecast, by Application 2019 & 2032
- Table 24: Spain Military LED Lighting Revenue (million) Forecast, by Application 2019 & 2032
- Table 25: Russia Military LED Lighting Revenue (million) Forecast, by Application 2019 & 2032
- Table 26: Benelux Military LED Lighting Revenue (million) Forecast, by Application 2019 & 2032
- Table 27: Nordics Military LED Lighting Revenue (million) Forecast, by Application 2019 & 2032
- Table 28: Rest of Europe Military LED Lighting Revenue (million) Forecast, by Application 2019 & 2032
- Table 29: Global Military LED Lighting Revenue million Forecast, by Application 2019 & 2032
- Table 30: Global Military LED Lighting Revenue million Forecast, by Types 2019 & 2032
- Table 31: Global Military LED Lighting Revenue million Forecast, by Country 2019 & 2032
- Table 32: Turkey Military LED Lighting Revenue (million) Forecast, by Application 2019 & 2032
- Table 33: Israel Military LED Lighting Revenue (million) Forecast, by Application 2019 & 2032
- Table 34: GCC Military LED Lighting Revenue (million) Forecast, by Application 2019 & 2032
- Table 35: North Africa Military LED Lighting Revenue (million) Forecast, by Application 2019 & 2032
- Table 36: South Africa Military LED Lighting Revenue (million) Forecast, by Application 2019 & 2032
- Table 37: Rest of Middle East & Africa Military LED Lighting Revenue (million) Forecast, by Application 2019 & 2032
- Table 38: Global Military LED Lighting Revenue million Forecast, by Application 2019 & 2032
- Table 39: Global Military LED Lighting Revenue million Forecast, by Types 2019 & 2032
- Table 40: Global Military LED Lighting Revenue million Forecast, by Country 2019 & 2032
- Table 41: China Military LED Lighting Revenue (million) Forecast, by Application 2019 & 2032
- Table 42: India Military LED Lighting Revenue (million) Forecast, by Application 2019 & 2032
- Table 43: Japan Military LED Lighting Revenue (million) Forecast, by Application 2019 & 2032
- Table 44: South Korea Military LED Lighting Revenue (million) Forecast, by Application 2019 & 2032
- Table 45: ASEAN Military LED Lighting Revenue (million) Forecast, by Application 2019 & 2032
- Table 46: Oceania Military LED Lighting Revenue (million) Forecast, by Application 2019 & 2032
- Table 47: Rest of Asia Pacific Military LED Lighting Revenue (million) Forecast, by Application 2019 & 2032
Frequently Asked Questions
1. What is the projected Compound Annual Growth Rate (CAGR) of the Military LED Lighting?
The projected CAGR is approximately 7.9%.
2. Which companies are prominent players in the Military LED Lighting?
Key companies in the market include Lunar Lighting, Osram, United Technologies, Orion Energy Systems, Revolution Lighting Technologies, Laminators technologies, Larson Electronics, Deco Lighting, Honeywell, Rockwell Collins.
3. What are the main segments of the Military LED Lighting?
The market segments include Application, Types.
4. Can you provide details about the market size?
The market size is estimated to be USD 443.8 million as of 2022.
5. What are some drivers contributing to market growth?
N/A
6. What are the notable trends driving market growth?
N/A
7. Are there any restraints impacting market growth?
N/A
8. Can you provide examples of recent developments in the market?
N/A
9. What pricing options are available for accessing the report?
Pricing options include single-user, multi-user, and enterprise licenses priced at USD 2900.00, USD 4350.00, and USD 5800.00 respectively.
10. Is the market size provided in terms of value or volume?
The market size is provided in terms of value, measured in million.
11. Are there any specific market keywords associated with the report?
Yes, the market keyword associated with the report is "Military LED Lighting," which aids in identifying and referencing the specific market segment covered.
12. How do I determine which pricing option suits my needs best?
The pricing options vary based on user requirements and access needs. Individual users may opt for single-user licenses, while businesses requiring broader access may choose multi-user or enterprise licenses for cost-effective access to the report.
13. Are there any additional resources or data provided in the Military LED Lighting report?
While the report offers comprehensive insights, it's advisable to review the specific contents or supplementary materials provided to ascertain if additional resources or data are available.
14. How can I stay updated on further developments or reports in the Military LED Lighting?
To stay informed about further developments, trends, and reports in the Military LED Lighting, consider subscribing to industry newsletters, following relevant companies and organizations, or regularly checking reputable industry news sources and publications.
Methodology
Step 1 - Identification of Relevant Samples Size from Population Database


Step 2 - Approaches for Defining Global Market Size (Value, Volume* & Price*)

Note*: In applicable scenarios
Step 3 - Data Sources
Primary Research
- Web Analytics
- Survey Reports
- Research Institute
- Latest Research Reports
- Opinion Leaders
Secondary Research
- Annual Reports
- White Paper
- Latest Press Release
- Industry Association
- Paid Database
- Investor Presentations

Step 4 - Data Triangulation
Involves using different sources of information in order to increase the validity of a study
These sources are likely to be stakeholders in a program - participants, other researchers, program staff, other community members, and so on.
Then we put all data in single framework & apply various statistical tools to find out the dynamic on the market.
During the analysis stage, feedback from the stakeholder groups would be compared to determine areas of agreement as well as areas of divergence


